HAL Id: halshs-00559637
https://halshs.archives-ouvertes.fr/halshs-00559637v3
Preprint submitted on 9 Mar 2015HAL is a multi-disciplinary open access archive for the deposit and dissemination of sci-entific research documents, whether they are pub-lished or not. The documents may come from teaching and research institutions in France or abroad, or from public or private research centers.
L’archive ouverte pluridisciplinaire HAL, est destinée au dépôt et à la diffusion de documents scientifiques de niveau recherche, publiés ou non, émanant des établissements d’enseignement et de recherche français ou étrangers, des laboratoires publics ou privés.
Infrastructure maintenance, regeneration and service
quality economics: A rail example
Marc Gaudry, Bernard Lapeyre, Emile Quinet
To cite this version:
Marc Gaudry, Bernard Lapeyre, Emile Quinet. Infrastructure maintenance, regeneration and service quality economics: A rail example . 2015. �halshs-00559637v3�
WORKING PAPER N° 2011 – 03
Infrastructure maintenance, regeneration
and service quality economics: A rail example
Marc Gaudry
Bernard Lapeyre
Émile Quinet
JEL Codes: C61, D61, D92, H54, R41, R48 Keywords:
P
ARIS-
JOURDANS
CIENCESE
CONOMIQUES48, BD JOURDAN – E.N.S. – 75014 PARIS TÉL. : 33(0) 1 43 13 63 00 – FAX : 33 (0) 1 43 13 63 10
www.pse.ens.fr
CENTRE NATIONAL DE LA RECHERCHE SCIENTIFIQUE – ECOLE DES HAUTES ETUDES EN SCIENCES SOCIALES
1
Infrastructure maintenance, regeneration
and service quality economics: A rail example
Marc Gaudry
1, Bernard Lapeyre
2, Émile Quinet
21 Agora Jules Dupuit (AJD), Département de sciences économiques Université de Montréal
Montréal, [email protected]
2 Paris-Jourdan Sciences Économiques (PSE) École des Ponts ParisTech (ENPC)
Paris, [email protected], [email protected]
An earlier draft of 6th October 2010 by Gaudry and Quinet, entitled Optimisation de
l’entretien et de la régénération d’une infrastructure: exploration d’hypothèses, benefitted
from comments by Bernard Caillaud and Matthieu de Lapparent and was presented without econometric tests at the Kuhmo Nectar Conference on Transportation Economics in Stockholm on 1st July 2011 under the title “Joint optimization of continuous maintenance and periodic renewal”. The authors thank Marc Antoni, Richard Arnott, David Meunier and Yves Puttalaz for discussions or comments, Cong-Liem Tran for computing assistance and are grateful to Société nationale des chemins de fer français (SNCF) for financial support and for allowing inclusion in this version of estimates based on databases constructed by Michel Ikonomov and Pascaline Boyer. Exploratory estimates obtained from fixed form regression specifications were presented at the Kuhmo Nectar Conference on Transportation Economics in Berlin on 21st June 2012 through David Meunier’s good offices.
JEL classification codes: C61, D61, D92, H54, R41, R48
Université de Montréal
Agora Jules Dupuit, Publication AJD-136-E ---
Paris-Jourdan Sciences Économiques
Working Paper No 2011-03
2
Abstract
This paper proposes a formalized framework for the joint economic optimization of continuous maintenance and periodic regeneration of rail transport infrastructure taking into account output consisting not only in traffic levels but also in track service quality. Core features of the formulation readily apply to other infrastructures, such as roads. Derivations are made principally under certainty assumptions, using Pontryagin procedures, but some uncertainty conditions are explored through Bellman processes. The resulting general expression for the marginal maintenance cost nests Newbery’s 1988 known result, derived with roads in mind.
The model equations are tested on national French rail track segment databases using Box-Cox transformations and directed (including spatial) autocorrelation of residuals and results are compared to rail regeneration and maintenance practices prevailing in France. In particular, the inverted U-shaped time profile of maintenance expenditures predicted by the model is verified for the part of the network subjected to regeneration and, for the central bout of the three-phase approach, the estimated total current maintenance cost and track service quality supply equations for the whole network include statistically significant target service and service trajectory correction terms implied by the joint optimization approach.
Résumé
La présente analyse utilise un cadre formalisé d’optimisation de la maintenance d’une infrastructure, les activités en question comportant d’une part des opérations continues d’entretien courant et d’autre part, à intervalles espacés, des opérations de régénération de l’infrastructure. On prend aussi en compte le fait que la fonction de coût de maintenance comporte comme produits non seulement les niveaux de trafic mais aussi la qualité de service fournie aux usagers des voies. Même si la formulation est articulée pour des infrastructures ferroviaires, nombre de ses considérations centrales s’appliquent également à d’autres types d’infrastructures, routières notamment. On supposera à titre principal qu’on est en avenir certain, et alors le problème est traité en utilisant les équations de Pontryagin, mais on explorera aussi la situation d’incertitude par le biais de simulations numériques utilisant les procédures Hamilton-Bellman-Jacobi. On en déduit une expression du coût marginal social de maintenance qui comprend comme cas particulier emboîté le résultat obtenu par Newbery en 1988 dans un contexte routier.
On teste économétriquement les équations du modèle à l’aide de transformations Box-Cox en tenant compte de l’autocorrélation dirigée (y compris spatiale) des erreurs ; et on compare les résultats, estimés à partir de données sur les tronçons du réseau ferroviaire national français, aux règles de décision sur la régénération appliquées en France. En particulier, le profil temporel en U renversé des dépenses d’entretien prédit par la formulation choisie est vérifié pour la partie du réseau qui donne lieu à de la régénération et, pour la longue phase centrale du profil triphasé, les équations explicatives des dépenses totales d’entretien courant et de la qualité de voie offerte qui sont estimées pour l’ensemble du réseau comprennent bien les variables de service cible et de correction de la trajectoire du service introduites par le cadre d’optimisation conjointe adopté, variables qui s’avèrent significatives.
Keywords: rail infrastructure, road infrastructure, airport infrastructure, current maintenance,
regenerative maintenance, infrastructure services, marginal cost pricing, Pontryagin maximum principle, Hamilton-Jacobi-Bellman simulation, Box-Cox transformation, directed autocorrelation, spatial autocorrelation, French rail network, rail track quality supply.
3
Table of contents
1. Infrastructure service, maintenance and regeneration ... 4
2. Context of the approach adopted for rail ... 4
3. Jointly optimal maintenance and regeneration ... 5
3.1. An optimal maintenance policy for given renewal horizon T ... 7
3.2. Determination of the optimal renewal horizon T ... 9
3.3. Consequences for optimal intertemporal infrastructure pricing ... 9
4. Effects of uncertainty on maintenance policy ... 11
5. Econometric and calibration tests ... 13
5.1. Data and estimation strategy ... 14
5.2. Are there three phases in current rail Maintenance databases? ... 19
5.3. Model teachings: cruising Maintenance and Service levels ... 22
5.4. Preliminary estimation of Phase B Target Service level Sc ... 23
5.5. Estimation of Phase B Maintenance expenses u ... 28
5.6. Estimation of derived Phase B Service supply S ... 33
5.7. Other calibrations ... 34
6. Conclusion ... 35
7. Acknowledgements ... 36
8. References ... 37
9. Appendix 1. The optimal duration of a renewal ... 40
10. Appendix 2. Discretization of the singular stochastic control problem ... 41
11. Appendix 3. Adding speed to maintenance cost models ... 42
List of figures Figure 1. Effects of tamping frequency ... 6
Figure 2. Typical evolution of service quality and maintenance expense for T=35 ... 9
Figure 3. Analytically derived Pontryagin and Hamilton-Jacobi-Bellman simulation results 12 Figure 4. Maximum allowed speed (km/h) on track segments classified by UIC group... 15
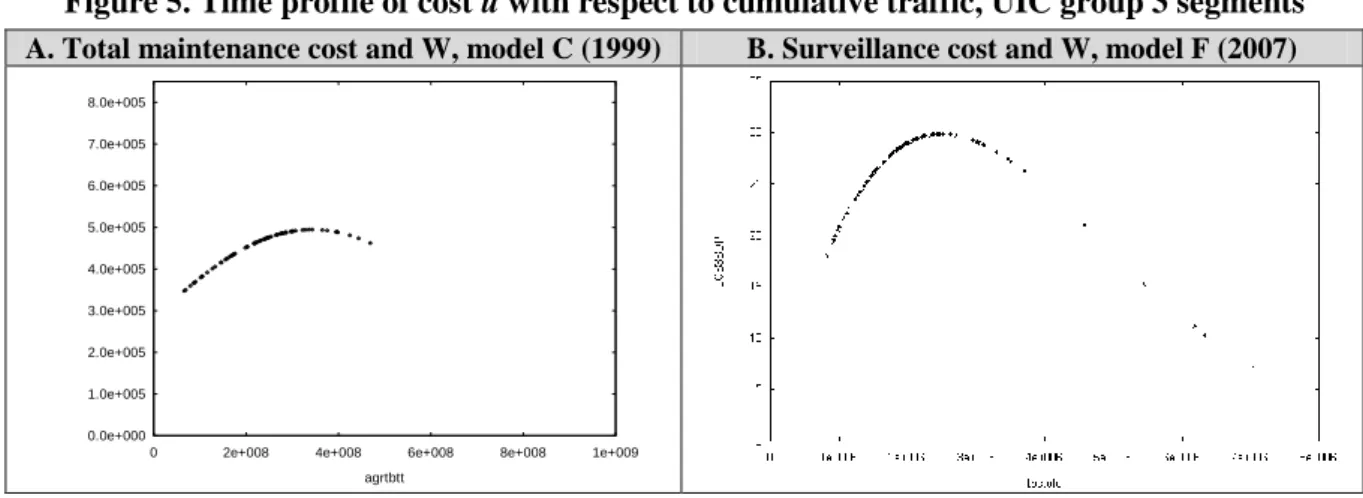
Figure 5. Time profile of cost u with respect to cumulative traffic, UIC group 3 segments .. 20
Figure 6. Changes in Service quality, Phase B segments only ... 24
Figure 7. Total Maintenance cost (euros per km) u, censored 2007 sample (673 obs.) ... 28
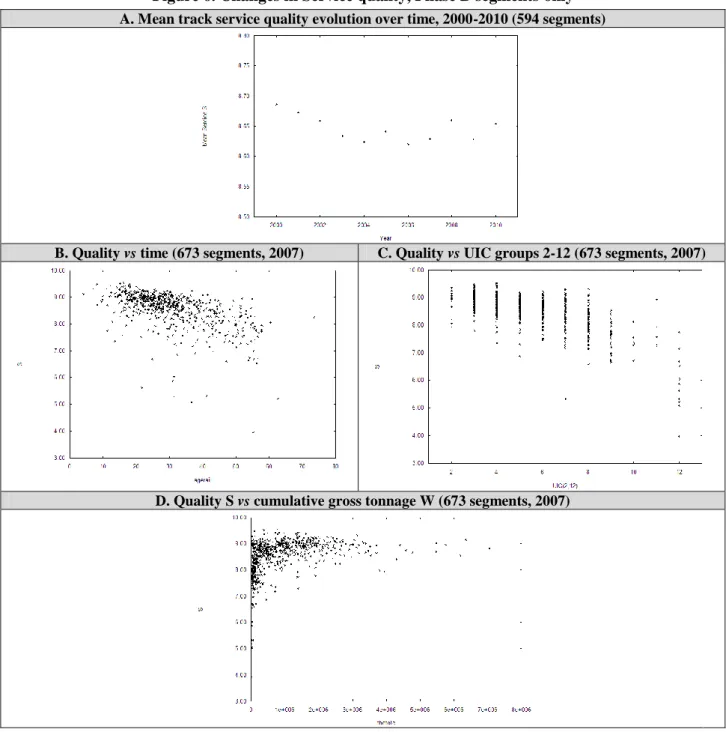
Figure 8. Year-to-year track Service quality changes from 2006 to 2008 ... 34
Figure 9. Relation between the yearly traffic and the lifetime of renewals ... 35
List of frames Frame 1. Parameters and functions used for the simulations ... 11
Frame 2. Impact of aging factors on the productivity of a unit of maintenance expenses ... 26
List of tables Table 1. Revenue differences between standard and optimal intertemporal pricing rules ... 11
Table 2. Estimation sequence for Maintenance and Service equations ... 14
Table 3. Mean values of principal variables available by track segment ... 15
Table 4. Sign conditions for a maximum or a minimum with two BCT on the same Xk ... 16
Table 5. Main variables used to establish the existence of three maintenance cost phases .... 19
Table 6. Phase tests with cumulative traffic variables, classic line network, 1999 & 2007 ... 21
Table 7. Embedded Target Service Sc function results (4060 obs., 2001-2007) ... 27
Table 8. SNCF regions in 2007, their number of neighbors and of segments in the sample .. 30
Table 9. Phase B Maintenance cost u without common max. speed v (580 obs., 2007) ... 32
Table 10. Phase B Maintenance cost u without max. speed by train type vc (580 obs., 2007)32 Table 11. Explaining Service quality changes ΔS by factors defined for 2007 and 2006 ... 34
Table 12. Ratio between Renewal and Maintenance expenses for several levels of traffic ... 35
4
1. Infrastructure service, maintenance and regeneration
Optimization of transport infrastructure maintenance, notably for roads and railways, is a longstanding research concern. Most work belongs to the operations research literature where the types and sequencing of maintenance operations are addressed but little attention is paid to their economic consequences. Other work, more concerned with economics, and notably with pricing, focuses on the econometrics of current maintenance expenditures but takes little account of interactions among types of maintenance, notably between current and regenerative maintenances, and is only weakly related to extant technical knowledge on infrastructure degradation and its consequences for service quality.
We build, at the juncture of these two research directions, a model embodying some core knowledge of degradation mechanisms but simultaneously linking policies on current and regenerative maintenance categories to their service quality impacts. The pricing implications, developed with a rail infrastructure focus, admit of numerous key features common to other transport infrastructure such as roads or airport runways and taxiways, as already pointed out in the first version of this paper (Gaudry & Quinet, 2011), in French. After a short literature review, the third section presents the optimization model and its resolution, as well as its consequences for pricing, uncertainty being introduced in the next section. The fifth presents econometric estimates and comparisons of results to infrastructure management practices. The conclusion points to their limitations and potential refinements.
2. Context of the approach adopted for rail
The first literature stream just mentioned derives from engineering knowledge managerial rules pertaining to maintenance operations and their scheduling. It includes both academic studies and administrative documents produced by national and international agencies supplying advice and computer-based decision tools.
The operations research orientation of such work is clear from recent reviews (e.g. Gu et al., 2012; Kobayashi et al., 2012; Sathay & Madanat, 2011). A notable example of computer-based methods produced by agencies is the Highway Development and Management program (currently HDM-4) distributed by the World Bank to make recommendations on the analysis, planning, management and appraisal of road maintenance, improvements and investment decisions. Tsunokawa & Schofer (1994) use optimal control theory to deduce optimal pavement policy, but do not include in their analysis any reference to quality of service and deliberately adopt a goal of optimal technical policy. Friesz & Fernandez (1979) propose a model which takes into account quality of service, but in an environment of wide uncertainty, and with a view to maintenance policy optimization.
The second literature stream, centered on the estimation of cost functions, takes a more usual economic approach and renounces any detailed analysis of technical processes to estimate econometric linkages among total costs, outputs and input prices if available. Typically, a behavioral assumption of short run cost minimization by infrastructure owners is made with an eye for pricing implications, especially in European countries where the marginal cost pricing doctrine of the European Union Commission is applied.
A particularly complete synthesis of this stream is found in the numerous 2008-2009 country reports of the Cost Allocation of Transport INfrastructure cost (CATRIN) Consortium, summarized in Wheat et al. (2009), and in more recent related contributions (e.g. Andersson
5 coordinated statistical analyses1 linking annual maintenance expenditures to traffic and technical track characteristics for five2 European country rail networks. The resulting cost functions rely on minimal technical knowledge and avoid dealing with the interaction between current and regenerative types of maintenance expenditures, a matter abundantly dealt with in literature of the first category where it is addressed primarily in a technical manner. Andersson et al. and Andersson & Björklund (2012) do bring up or study the rarely mentioned matter of regeneration expenditures but without relating it to that of current maintenance expenditures.
Accounting for the interaction between periodic regeneration and continuous maintenance dimensions of assets, and duly deriving implications for pricing, is rare. For Feldstein & Rothschild (1974), current maintenance has no effect on the replacement of capital goods (machines), in contrast with Rust’s (1987) probabilistic modeling of the choice between maintenance and replacement of a component of an asset of variable service life duration, namely the engine of an urban bus.
Concerning transport infrastructure, Newbery (1988a, 1988b) stands out with a formulation of a road infrastructure deteriorating with traffic axle loads and recovering its initial service quality when regeneration is carried out after a certain time interval. His main result is that, under stationary network conditions (i.e. constant road traffic on all links and life durations uniformly distributed in time), revenue generated under marginal cost pricing equals the optimal regeneration expense. A key structural feature of his seminal analysis, our starting point, is that current maintenance has no effect whatsoever on regeneration timing or requirements, an assumption shared by other authors distinguishing between current and periodic maintenance (regeneration) expenditure, such as Small et al. (1989)3 for roads, or Lévi et al. (2010) for rail tracks.
3. Jointly optimal maintenance and regeneration
Consider an infrastructure defined by a vector K of technical characteristics and supporting at any time t a traffic of density q(t) which creates damages that can be remedied by a combination of current maintenance expenditures ( )u t dt , during any time interval dt, and of regeneration expenditures D, incurred at intervals Ti to be defined, that fully restore the
infrastructure to its initial un-degraded quality state.
This assumption implies that the current maintenance can be approximated by a continuous function, while maintenance appears at discrete points of time. This approximation implies that current maintenance operations are numerous within the time unit, and for the average length of the link under consideration; we will see that, owning to the data used for calibration, these conditions are fulfilled. Furthermore, Tsunokawa & Schofer (1994) have shown that a series of discrete maintenance operations and the corresponding sawtooth path curve of the quality of service can be approximated by a continuous function.
We for instance have notably in mind the lumpy saw-like process whereby tampings reduce the rate of track settlement over time, as in Figure 1.A from Ongaro & Iwnicki (2009, Figure 2), and such successive current maintenance operations (immediately followed by preventive4 rail grinding) to maintain a target service level (say a combination of comfort and safety), reduce the rate of track service quality degradation (as measured by index NL in Figure 1.B from Antoni et al., 2009) when effected at an increasing frequency over the lifetime of a ballast. Such maintenance is known to decrease by about half the slope of the
1
In particular, Box-Cox transformations are applied by all to CES, and by some to other specifications. 2 Austria, France, Great Britain, Sweden, Switzerland.
3 Like Newbery (op. cit.), they ignore any pavement life prolongation caused by non regenerative maintenance. 4
6 degradation curve and to prolong Ti, a key effect of maintenance observed5 on service S and
on Ti. Indeed, “maintenance causes continuous changes in quality (deterioration)”, as long
ago emphasized in a housing maintenance policy model by Arnott et al. (1983).
Figure 1. Effects of tamping frequency
A. On track settlement over time
B. On longitudinal track degradation index NL
⁄ : track degradation index NL
↓ : effect of tamping on NL
←Minimum service level
Duration T between ballast regenerations
The service quality supplied by the infrastructure at time t is designated S(t). Its derivative at time t depends on the current maintenance u(t), on track segment technical characteristics K, on the cumulated traffic borne by the track segment from the last renewal to present, Q(t), on the level of the service quality S(t), on the current traffic level q(t) and on time elapsed since the last renewal t.
The objective function of an infrastructure manager assumed to maximize the collective surplus is then defined, at interest rate j, as the present value of services supplied by the infrastructure minus maintenance expenditures ― both current ones for each period dt and regeneration ones D incurred at intervals Ti. We also make the simplifying assumption that
traffic q(t) is perfectly known and constant over time and denoted by q. These assumptions go beyond mere tractability and stem notably from the fact that, in many situations found in developed countries, the trend of traffic is almost nil and shows little volatility from year to year (at a sufficient level of aggregation). Under such assumptions, the optimal regenerations will be regularly spaced at some interval T and the stated problem can be expressed as:
(1)
( 1) ( 1) ( ), 0 0 ( ), * [ ( ) * * ] or, denoting [ ( ) * * ] by ( ( ), ) : ( ( ), ) * 1 n n T jt j n T jnT nT u t T n T jt jT jT u t T M Max u t a q S e dt De e u t a q S e dt J u t T J u t T De M Max e
, 0 for T 0, (2) (3) (4) ( ) ( , ( ), ) * ( ) ( , ( ), ( ), ) ( ) ( ) i t T dS t dt h K Q t t u t f K Q t q t t Q t q s ds
, for Ti t Ti1. (5)5 An analysis of the evolution of service quality, as measured here for 11 years over 581 segments, shows that, for the overwhelming majority of segments where maintenance has produced large year-to-year service improvements, the speed of degradation, measured before and after over 3 years, is considerably reduced.
7 Clearly, we make several simplifying assumptions: first, we assume that the rate of change of service quality is a linear function of maintenance u; second, we assume that the utility provided by service quality exhibits risk aversion to account for the fact that it stands for the possibility of rupture or accident. Third, we assume that this rate of change of service quality does not depend on service quality S itself. This assumption is perhaps not intuitive, as another specification in which the rate of change is homogenous of degree -1 in S (building in the fact that dS/S is independent of S) seems more intuitive; but such a specification is in fact equivalent to the present one as may be noted by changing S into log(S) and
into exp( )
aS a S , another quite sensible risk averse utility function.
The following assumptions are made concerning the derivatives of functions ( )h and f( ) : (i) ( )h is positive and decreasing in Q(t) and t: for a given quality of service, the efficiency
(physical productivity) of one Euro spent on maintenance decreases with cumulative traffic, represented below by cumulative tonnage W(t) or cumulative number of trains
N(t), and time elapsed since the last renewal;
(ii) f( ) is positive and increasing in Q(t), q(t) and t (as a group called aging factors in Frame 2 below): for a given quality of service, quality degradation increases with cumulative trafic Q(t), current traffic q(t) consisting in c traffic categories qi, and t, time
elapsed since the last renewal;
(iii) u(t) is limited both downward by 0 (to exclude negative maintenance) and upward by m (to account for the fact that constraints, such as time windows for track work and the cost of regeneration, limit feasible maintenance per unit of time).
To solve this programme, first search for the current maintenance function u t( ) which maximizes M*, and therefore J, for given T; then maximize the resulting M*(T) with respect to T.
3.1. An optimal maintenance policy for given renewal horizon T
Maximization of ( ( ), )J u t T for given T is a classical dynamic programming problem. The
Hamiltonian may be written, introducing the co-state function y(t), as:
(6) [ ( ) 1 ( ) ] ( )
( , , ) * ( ) ( , , ,... ,... , )1
i c jt
i i i c
i
H u t
qS t e y t h K Q t u t f K Q q q q t , the solution of which, under Pontryagin’s maximum principle, will satisfy three relations:(7)
( ) * ( , , ) * ( )
0 jt u u S y Max H Max u t h K Q t y t e H y H dS dt with the two-limit constraint on u(t), located in the closed interval [0, m], and the transversality condition y(T)=0 satisfied. The latter implies that the solution u(t) cannot be totally within the interval [0, m] and that one must distinguish three phases depending on whether the value of u which maximizes H is within, or at the limits of, the central domain: Phase A: ( , , ) * ( )h K Q t y t ejt 0. With u(t)=0 over this first interval, we have:
• S(t) found by integration of dS dth K Q t( , , )* ( )u t f K Q q t( , , , ): it is deduced, the phase starting at moment t with f S t( )f denoting service quality at that moment;
• y(t) determined by HS y 0, which yields ( ) ( ) ( ) 1
f
t jv
f t
y t y t
q S t e dv. Phase C: ( , , ) * ( )h K Q t y t ejt 0. With u(t)=m over this third interval, we have:8 • S(t) by integration of dS dth K Q t( , , )*m f K Q q t( , , , ), the phase starting at time t ; m
• y(t) determined by HS y 0, which yields ( ) ( )
m t S jv m t y t y t
qe e dv. Phase B: ( , , ) * ( ) jth K Q t y t e . In reverse order now, we have over the central interval: • y t( )
1 ( , , )h K Q t e
jt, by simple manipulation of the phase condition;• Sc(t), determined by HS y 0, and to be called cruising service quality:
1 2 ( ) 0 ( , , ) ( , , ) jt jt jt S c h t h Q Q t je y H e q S t h K Q t h K Q t ,which, by simplification of the derivative of h with respect to t, may be written:
1 1 ( ) ( ) ( , , ) c dh q S t j h K Q t hdt , or S tc( ) 1 1 1(j dh) q h hdt , or even,
taking into account the above mentioned breakdown of q among traffic categories qi,
applying a logarithmic transformation6 and collecting terms :
(8) [ ( )] 1 ( 1 ) ( ) 1 ' )
1 ²
i c
c i i i
h
Log S t Log q Log Log
j h jh
,where h notably contains Q/t, i.e. current traffic q(t). Then u(t) is given by:
(9) ( ) ( , , , ) 1 ( ) ( , , ) c dS t u t f K Q q t h K Q t dt .
One may now determine dates of phase changes and system behavior between 0 and T for realistic initial and final conditions.
For system behavior, and starting for convenience at T, the end of the period, transversality condition y(T)=0 then requires to be in Phase A, and current maintenance u(t) to be nil. Two possibilities arise when one starts backing-up in time:
(i) either one stays in Phase A because y(t) satisfies the corresponding inequality restriction. The resulting optimal policy is then to perform no current maintenance and to regenerate periodically, as in the road case studied by Newbery (1988a, 1988b);
(ii) or, at a certain instant tf , one has ( ) 1 ( , ( ), ) f
jt
f f f
y t h K Q t t e , as in Phase B where
0<u(t)< m, and service quality then follows trajectory Sc(t). Further, as one approaches
period beginning t=0, a number of possibilities arise depending on how service quality
S(0) achieved by the previous regeneration compares to Sc(t).
If, as in standard practice illustrated in Figure 2, S(0)>Sc(0), one again reaches a Phase A
state, with u(t)=0, i.e. devoid of maintenance. Typical trajectories of service quality and maintenance expenditure are then as shown in Figure 2, with the three phases present. This evolution matches current maintenance practice rather well. For a short period (some months, or at most a few years) after regeneration, maintenance is almost nil (it includes minimal surveillance). During the cruising phase, quality slowly decreases and annual maintenance increases. Shortly before regeneration, maintenance is again nil or minimal.
6 Instead of a logarithmic form, the Box-Cox transformation (BCT) is often used (e.g. Montmarquette & Blais, 1987) as a convenient Arrow-Pratt measure of constant relative risk aversion, concavity (1) indicating risk avoidance and convexity (1) a preference for risk. Here the BCT will be reserved for the variables in h( ) .
9
Figure 2. Typical evolution of service quality and maintenance expense for T=35
A. Service quality (initial value equals 250) B. Maintenance expenditure (nil close to T=35)
Concerning dates of phase changes, and starting from a regeneration establishing initial quality S0, the first one is reached at time t when, with due degradation, cruising quality Si c is
attained and it is verified that:
(10) 0 0 ( , , , ) ( ) i t c i S
f K Q q t dtS t .The next date, tf, of transition between cruising Phase B and the final Phase C is such that:
(11) ( , , ) * ( ) jtf
f
h K Q t y t e
and, because y(T)=0 also holds, one may deduce from the expression for y(t) in Phase A:
(12) f ( ) 1 f T jt jv t e
q S t e dv,which, as an equation, yields the value of t because all the rest is known in terms of f t , f
notably function S(v).
3.2. Determination of the optimal renewal horizon T
The assumption of stationary traffic, made to some extent for convenience in the previous section, is now required for an easy resolution. If J*(T) is, for given T, the highest value of J solving { ( ( ), )} *( )
u
Max J u t T J T , the optimal duration T is that which maximizes (13) * ( ) ( ) 1 jT jT J T De M T e .
It is shown in Appendix 1 that the second derivative of M(T) with respect to T is negative, so there is an extremum and it is a maximum.
3.3. Consequences for optimal intertemporal infrastructure pricing
In the previous section we have made a first assumption that demand is not a function of time itself and that quantities demanded are independent across time slices, a weak assumption to the extent that relatively high travel frequencies should not shift in response to modifications in infrastructure charges arising over time from maintenance activities of relatively low frequency. The relation between traffic q, service quality S and infrastructure charges π are assumed to have the following form:
(14) ql( - S-)l p( ), or p - S- p q( ),
where is the infrastructure charge and S the value of service quality S.
The hypothesis previously adopted that annual traffic q is constant over time implies, by this last equation, a charge varying over time in symmetry with service quality. Such a second
10 best assumption, adopted for resolution convenience, is also grounded in practice to the extent that it matches the manager’s stability policy aimed at freight shipper facility investments and at trip scheduling decisions by travelers using competing means of transport. It implies the p is constant over time but that and S(t) can (and effectively do) vary.
Under these assumptions, the optimization of charges involves the maximization with respect to q of the discounted surplus (SC) arising from managing the infrastructure:
(15)
* * * 0 0 0 1 1 ( , ( ), ) [( ( ( ) ) ) ( )] ( ) ( , ( ), ) 1 q T q jt jT jT SC q u t T p v aS dv u t e dt De p v dv M q u t T e j
with 1 1 0 1 ( , ( ), ) [ ( ) * * ] [ ( ( ), ) ] 1 i i i i T i jT jT jt jT jT i T M q u t T u t a q S e dt De e J u t T De e
(16)Using the results of the previous section, and writing
( ),
*( ) ( , ( ), )
u t T
M q Max M q u t T , the maximization of SC with respect to u(t) and T gives
0
*( ) (1 ) q ( ) *( )
SC q j
p v dvM q andthe maximization of SC*(q) with respect to q yields p and q through:
(17) * ( ) ( ) dM q p q j dq .
One then calculates infrastructure charges π(t) varying in time and equal to:
(18) * ( ) ( )t p q( ) aS t q( , ) jdM q aS t q( , ) dq .
Overall, the generalized cost to the user p is constant through time, with variations in infrastructure charges exactly matching changes in service quality.
The completion of optimal tariff constructs requires determining how M*(q) varies with q. Note first that variations in q imply variations in T but that, by the envelope theorem, no account need be taken of the latter: when traffic increases by δq, one considers only variations in J*(T,q), the duration of inter-regeneration T being held constant. Then:
(19) *( ) 1
0 ( )
1 T jt jT u t aS q e dt dM q dq e q
,In the derivation of the integral, each of the three phases has to be analyzed separately, taking due notice of the fact that the functions S(t) and u(t) are continuous within each phase but that, at points of time ti and tf, S(t) has different RHS and LHS derivatives and u(t) is
discontinuous.
Within Phases A and C, maintenance is nil and the marginal cost equals service degradation. For the instant ti then:
(20) 0 ( ( , ) ) ( , ) i t jt J S t q S t q q e dt q q
,with a similar relationship for the instant tf.
By contrast, in the central cruising Phase B, the derivation of the integral ― call it J ― is:
( , ) ( , ) ( , ) ( , ) ( , ) f f f i i i t t t f jt jt jt i i f t t t t t dJ S t q u t q S t q e dt q e dt e dt u t q u t q dq q q q q
.11 This expression, which easily leads to the calculation of the toll , does comprise u q, but also a supply side effect in the sense that increased traffic at the margin leads the operator to improve service, an effort that benefits all other users: it is a positive externality resembling the Mohring’s (1972) effect for service frequency.
The difference between infrastructure marginal cost and optimal charges can be significant, as simulation cases of Table 1 indicate. For low traffic levels, infrastructure marginal cost charges are higher than optimal charges, indeed a sort of Mohring effect in that higher traffic incites the manager to improve service quality, a motivation that progressively decreases. Note that the optimal charge now includes the anticipated effect of future cumulative traffic: supplementary current traffic increases not only current expenses but also those of all forthcoming years because it damages the way and makes it susceptible to higher maintenance charges in the future.
Table 1. Revenue differences between standard and optimal intertemporal pricing rules
Traffic Revenue from standard marginal charge Revenue from new optimal charge
400 1,509 1,630
300 1.080 1.140
200 0,583 0,588
100 0,173 0,155
50 0,057 0,038
4. Effects of uncertainty on maintenance policy
It has been assumed in the previous sections that there is no uncertainty. But the maintenance process is in fact quite uncertain, especially concerning the link between traffic and resulting damages. To take this fact into account, we adopt the classical assumption that the evolution of the system depends on a Wiener-like random variable process in accordance with:
(21) dS t( )h K Q t u t( , , )[ ( ) f K Q q t dt( , , , )] dz
where the random variable dz denotes a classical Brownian motion, as in Haussmann & Suo (1995a). We will not analytically solve this optimisation problem but simply perform numerical simulations using the usual Hamilton-Jacobi-Bellman (HJB) equation with partial derivatives:
(22) t {[ ( ) S t( )] jt S
( , , ) ( ) ( , , , )
² SS} uJ Max u t qe e J h K Q t u t f K Q q t J
.
Note that such a simulation procedure, with parameters and functions found in Frame 1, where the operator’s attitude to S is specified as g S( ) eS instead of g S( ) S, could have been used to solve the certain case obtained by setting the standard deviation σ to zero: we have consequently compared the results of simulations to the solution obtained analytically by the Pontryagin procedure.
Frame 1. Parameters and functions used for the simulations
Number of years between 2 renewals: T=20. Initial quality of service: S(0)=3,3. Limit values of current maintenance u(t): 0; 0,2. Yearly traffic normalized to: q=100. Discount rate: j=0,04. Functions for: ( ) ( , , )[ ( ) ( , , , )] dS t h K Q t u t f K Q q t dtdz: h(t)=7; f(q,t)=[(0,25+0,16(q/400)²)*(1+0,04(q/400)t)]/[7e-0,02].
Standard deviation of Wiener random variable: σ=0; then σ=0,1; then σ=0,2.
[the measured standard deviation of the observed quality of service is approximately 0,08]. Parameters of the function expressing the value of the quality of service S
e
: α=10; λ=10.
Note that technical parameter values denoted by K earlier are taken into account in the values selected.
The solution values, shown in Figure 3, are drawn from a large number of simulations providing similar results. Those are based on sensible values of the parameters corresponding
12 to the average track segment of the French network and on simple specifications of the functions intervening in the model, as documented in Appendix 2.
Let us note first that the simulation procedure brings out, not the real, but a target trajectory: as soon as the random variable provides a gap between actual and goal trajectories, the optimal policy consists in eliminating the gap as quickly as possible.
In the certainty case σ=0, the target trajectory provided by the HJB simulation is the same, due account taken of computing accuracy, as the cruising trajectory which can be analytically found in the certainty situation by Pontryagin maximum principle procedures. When the standard deviation of the random Brownian motion differs from zero, the target trajectory is slightly below the « certainty » target trajectory and the moment when the optimal maintenance is set at zero happens sooner. But for sensible values of the parameters, the difference with the certainty situation is small.
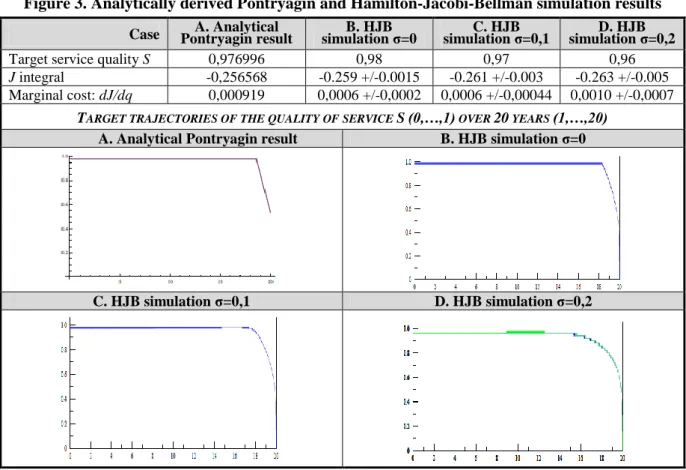
Figure 3. Analytically derived Pontryagin and Hamilton-Jacobi-Bellman simulation results
Case Pontryagin result A. Analytical simulation σ=0 B. HJB simulation σ=0,1 C. HJB simulation σ=0,2 D. HJB
Target service quality S 0,976996 0,98 0,97 0,96
J integral -0,256568 -0.259 +/-0.0015 -0.261 +/-0.003 -0.263 +/-0.005
Marginal cost: dJ/dq 0,000919 0,0006 +/-0,0002 0,0006 +/-0,00044 0,0010 +/-0,0007
TARGET TRAJECTORIES OF THE QUALITY OF SERVICE S(0,…,1) OVER 20 YEARS (1,…,20)
A. Analytical Pontryagin result B. HJB simulation σ=0
13
5. Econometric and calibration tests
Our model, taking regeneration and service level provision into account, implies the existence of the three Service performance and current Maintenance phases shown in Figure 2. But we have found no evidence of the existence of such phases in the rare literature on track performance provision7 by rail firms (e.g. Martland, 1992; Robert et al., 1997) or in the literature on infrastructure maintenance cost models estimated from track section data8. Since the first track segment-level analyses by Idström (2002), Johansson & Nilsson (2002, 2004) and Gaudry & Quinet (2003), such models, all based on short-run maintenance cost minimization assumptions, are nested into (9) by the removal of three key variables: elapsed time t as well as cumulative traffic W since the last regeneration, and Target Service Sc.
These simplifications lead explicitly for each segment of a given sample to the specification: (23-A) ut f K h e( ( ,0 0), ( , ), ( ))q n w S h t,
where the index t refers to a few consecutive years, typically 1 to 3. This brevity of large track segment panels makes it possible, if not necessary, for the above early and for later authors to abstract from input prices which are assumed constant in space (and during the very short time periods available) for the given national infrastructure provider studied, for instance Swedish in Andersson (2006), Swiss in Marti & Neuenschwander (2006) and Austrian in Link (2009) ―all three of which use CES (Log-Log) specifications for f( ) . Note that classical formulation (23-A), based on short run cost minimization, fleshes out variables only summarily defined above and earlier. First, technical characteristics K are split between planned reference quality or “standing” h (such as maximum allowed design speed 0 v and UIC group status gk used below), current deterioration performance indicators S(h)
(such as age of rails and of sleepers (ties); proportion of wood sleepers; current speed restrictions; etc.) and state characteristics e (such as length; circuitousness; number of 0
tracks, switches and tunnels; electrification; centralized automated traffic control, etc.) of the segment. Second, traffic q or Q is explicitly defined by measures of the number of circulating trains (n or N) and of their weight (w or W).
Nor could we find reference to three phases in the unique example of a road maintenance cost model (Ben-Akiva & Gopinath, 1995) where explanatory variables do include cumulative traffic W, time elapsed since the last regeneration t, and a current degradation performance9 indicator S(h)t ≡ St. That “extended classical” specification nests into:
(23-B) ut f K h e( ( ,0 0), ( , ), ( ,q n w Q N W t S h), , ( ))t,
where the “new” Target Service and Trajectory Correction terms, key features of the joint optimization approach included in forthcoming equation (23-C) of Section 5.3, are missing.
7 There of course exists a literature on the supply of vehicle capacity or seat-km services, notably in urban transit systems where Mohring’s (1972) “frequency effect” due to fixed-capacity vehicles arises, as well as a literature on the recursive nature of transit seat Demand-Supply equation systems estimated from monthly or yearly data (e.g. Gaudry, 1980), but such study streams never deal with the supply of infrastructure quality or with its degradation performance. And literature dealing with railroad and road infrastructure provision itself tends to explain only aggregate quantity measures (e.g. Ingram & Liu, 1997) and avoids the issue of quality supply.
8 These European models of rail maintenance cost estimated solely from data by track segment should not be confused with models of total rail cost estimated from aggregate firm-wide time-series data, frequently estimated with CES and Trans-Log specifications during the previous two decades, or even with models of maintenance cost estimated from similarly aggregate firm-wide time-series data (e.g. Bereskin, 2000), where the assumption of constant input prices obviously cannot be made due to the length of the time-series used. 9 In their paper, h
0 is the structural pavement number and S(h) is a latent variable linearly estimated [viz. their Equation (29)] from a set of condition indicators of current degradation. There are no phases or target levels.
14
5.1. Data and estimation strategy
Specifics of a multi-phase model. The potential existence of phases and of a Target Service
level have empirical implications. In this respect, finding out how much the addition of a Target Service level variable Sc contributes to the explanation of current Maintenance costs
will require only the addition of a couple of new terms pertaining to Sc, a minor modification
of maintenance cost equation specifications (23-A) or (23-B); but testing the existence of three phases does require unprecedented reformulations of rail firm behavioral equations. In particular, phases imply that Maintenance expenditures may follow an asymmetric ∩-shaped time path, different even from a quadratic path if Figure 2.B is adequate, a functional form issue addressed presently as the first fundamental implication of the theory. This implication matters because the calculation of representative marginal costs should exclude from the sample observations pertaining to the short phases at the extremities of interval Ti and retain only those associated with the long central monotonic cruising phase B.
Data base use strategy. Starting then with Maintenance phases, can ∩-shaped forms be detected in our two pruned databases for the years 1999 and 2007? Moving on afterwards to the analysis of Service levels, the absence of information on this variable in 1999 restricts our estimation possibilities to 2007 data. We adopt the estimation steps indicated in Table 2. In an analysis of pruned databases for 1999 and 2007, we first show that high standing track segments belonging to UIC10 groups 2 to 6 in fact still contain three Maintenance cost phases, as demonstrated by the asymmetric ∩-shaped nature of expenditure profiles over time: this is established by a two-step (a, b) process whereby removal of observations from Phases A and C leaves only monotonic central Phase B subsamples. Second, with such doubly censored cruising phase subsamples, we estimate Maintenance cost (ut) and realized
Service provision (St) equations for the year 2007 (in each case Step c in Table 2) after a
preliminary analysis of embedded Target Service (Sc) to be explicated in Section 5.3.
Table 2. Estimation sequence for Maintenance and Service equations
Current maintenance cost Service provision
1999 Base 2007 Base 2007 Base
a. Test existence of 3 phases on full sample (978 obs.). Find Phase A & C segments.
a. Test existence of 3 phases on full sample (700 obs.). Find Phase A & C segments.
a. Test existence of 3 phases on full sample (700 obs.). Find Phase A & C segments.
▼▼
► ►
b. Retain cruising Phase B
censored subsample
b. Retain cruising Phase B censored subsample (675 obs.)
b. Retain cruising Phase B censored subsample (675 obs.).
▼▼
◄ ◄
Estimate embedded Target Service Sc (580 obs./year) c. Estimate cruising Phase B
Maintenance Cost u equation making use of variables based on Target Service Sc estimates
(580 observations)
▼▼
► ►
c. Estimate cruising Phase B Service Supply ΔS equation using Sc and u estimates
Available information. The available variables listed in Table 3 originate from the full
French network of about 30 000 km but sample sizes differ by year due to pruning of the raw
10 The 13 UIC (Union Internationale des Chemins de Fer, 1989) groups used by SNCF are measures of standing. Our retained subsets of observations exclude Group 1 segments found at the entrance of the largest stations, include Groups 2-6 segments for which track is periodically regenerated and remaining Groups 7-9 segments that are in principle never regenerated (except on an ad hoc basis). The latter are further split as between those “with passenger trains”, labeled 7-9 here, and others classified as “without passenger trains”, labeled 10-12, a SNCF assignment that does not mean that passenger traffic is always necessarily nil.
15 data and because the 1999 base consists in operational “traffic” segments and the 2007 base in 49% longer administrative “cost” segments covering more than one traffic segment.
Table 3. Mean values of principal variables available by track segment
Variables 1999 (sample size 985) 2007 (sample size 700)
ut Current maintenance expenses
total cost per km (current Euros) 68 899 52 432
surveillance -- 14 821
maintenance -- 37 611
e0 Technical state variables K
length of segment (meters) 18 991 28 219
length of all tracks (meters) by number of tracks 46 186 electrified or not; tension (1,5 or 25 kV)1 yes yes
number of switches per segment 21,41 25,48
h0 Initial standing
maximum allowed speed (km/h) 127,77 114,69
UIC group classification (reconstructed) observed
high speed rail line yes yes
suburban line yes yes
ht Current condition
average age of rails (years) 26,59 30,56
average age of sleepers (years) 26,87 28,07
St Service quality of the track
NL index of longitudinal track rectitude (mm) -- 1,4512 qt Traffic per day: trains and gross tons trains weight (per train) trains
3
weight3 (per train)
GL : long distance passenger trains (VFE) 6,04 3 151 (522) 17,99 10 255 (570)
TGV: high speed trains ---- ---- ---- 9,25 5 612 (601)
Classic intercity trains (Corail) ---- ---- ---- 8,74 4 643 (531)
TER : regional passenger trains 5,09 1 115 (219) 24,44 5 559 (228)
IdF : Île-de-France passenger trains 5,99 2 378 (397) 16,21 6 215 (384)
Fret : freight trains 6,10 6 403 (1049) 13,70 15 484 (1131)
HLP : locomotives 1,40 138 (99) 2,84 275 (97)
Total for the six categories of trains 24,76 13 185 (533) 75,16 37 788 (503)
1
Out of a total network of about 30 000 km, 11 582 km (including 1 884 km of TGV lines) have alternating tension of 25 kV and 5 863 km have continuous tension of 1,5 kV; 126 km are electrified otherwise (third rail, etc.). 2Available over the period 2000-2010 for a subset of 608 observations. 3Available over the period 1995-2007 for all 700 observations.
This difference in segment length shows up clearly in Figure 4 where maximum allowed
speed (vma) v, the main initial infrastructure quality indicator h0 in (23-B), is plotted by track
segment classified by UIC group membership. Actual maximum speeds are always a multiple of 10 km/h on physical “traffic” segments (whence, 1999 dots stand for many segments) but its average value calculated over longer administrative “cost” segments blurs this structure and gives the impression that speed maxima for train drivers are more varied and continuously defined than they in fact are on the shorter physical traffic segments.
Figure 4. Maximum allowed speed (km/h) on track segments classified by UIC group
A. 1999 (985 observations) B. 2007 (700 observations) 0.0 2.0 4.0 6.0 8.0 10.0 12.0 50 100 150 200 250 300 350 U IC 2 9 vma 0 2 4 6 8 10 12 50 100 150 200 250 300 350 U IC vma
16
Econometric strategy.The general econometric specification adopted, readily applicable to our cross-sectional data sets on segments (1, …, t, …, T), is the Box-Cox model with a non-spherical distribution of residuals:
(24-A) ( ) 0 ( ) y k t k k kt t y
X u , (24-B)
1/2 ( ) exp m t m m mt t u
Z v , (24-C) 2
,
1 1 n T t n tn n t v
r v w.where, in the first two equations, the Box-Cox transformations (BCT) applicable to any strictly positive11 variable Varv is commonly defined without Tukey’s shift parameter as:
(24-D) ( ) [( ) 1] , 0, ln ( ) , 0, v v v v v v v v Var Var Var
and where, in the third equation, r,tn denotes the typical element of matrix R , a row or column-normalized square (T by T) Boolean matrix R expressing hypothesis concerning the presence of correlation among designated residuals, which may then behave as substitutes ( 0) or complements ( 0) to the residual of segment t. And rewriting (24-C) in matrix notation eases the explicitation of matrix R , namely
(24-E) v
12 R vw, with R I (1 )R 1R , (0 1) ,where the new proximity parameter measures the relative influence of “near” and “distant” neighbors of R , as soon discussed below.
BCT forms. Note that (24-A) contains the necessary intercept (Schlesselman, 1971) and that
the X denote any non-dummy term, including a product of variables; in addition, a special k
case used in Phase tests below consists in using the cumulative traffic variable W twice:
(24-F) 1 2
1 2
( ) Q Q
t Q t Q t
Q W W W ,
in which case the BCT are distinct [1 2], the model is identified in terms of transformed variables and the usual alternating signs conditions on 1 and 2, deciding if and whether a maximum or a minimum occurs with a quadratic specification, generalize to those listed in Table 4, from Gaudry et al. (2000), where a given sequence of signs yields a maximum or a minimum depending on the sign of the difference [12]. Phase tests below will not focus on the most general asymmetric turning case [ 1 2] but on a particular one [1 1;2 2] and on the proper symmetric quadratic [11;2 2] special case, both nested in (24-F).
Table 4. Sign conditions for a maximum or a minimum with two BCT on the same Xk
CASE 1 2 1 2 1(12) or 2(2 1) ∩ Maximum 1 ∪ Minimum 1 ∩ Maximum 2 ∪ Minimum 2
11 The dummy variable and 0-replacement methods available to transform variables that contain some 0 are discussed and used in Gaudry & Quinet (2010). Here 0 traffic values are replaced by 0,00001, unless stated otherwise, as for instance in the detection of Phase C segments where the dummy variable method is used.
17
Heteroskedasticity. To obtain both homoskedastic errors vt or wt and correct BCT forms,
particularly for the dependent variable yt, it is necessary to specify a second instrument for
the former of these targets. It is provided by (24-B) where, following Gaudry & Dagenais (1979), the Z variables may also be m X variables and the formulation, which necessarily k
yields positive variances, is flexible enough to include classical heteroskedasticity as a special case if all m but one are set at 0 and that remaining one equals 2 (with the matching
0
m
). In our forthcoming tests on Maintenance cost (ut), where the optimal BCT on the
dependent variable is in the vicinity of 0,25, heteroskedasticity in various garbs, classical and more general, was never found: the presentation of results henceforth ignores the issue.
Directed autocorrelation. Matrix R in (24-E) results from three steps. In the first, a square
matrix R is defined with typical element r,tn=1, to express an hypothesized correlation
between any two residuals vt and vn (and r,tn=0 otherwise). It is often called a contiguity matrix because spatial hypotheses were first used to define it; but clearly any criterion, spatial, temporal or socio-economic, may specify a pattern of interdependence among residuals: the researcher’s directed choice12 is not limited by the natural order of the data. In the second step, it has long been the practice (Ord, 1975) to row or column normalize this matrix and Bolduc (1987) has shown that the resulting normalized matrix R guarantees a convex likelihood function over the stable unit interval of . This formulation is « idiot-proof » in the sense that, based only on zeroes and ones, it avoids the complications of lack of invariance of estimates to changes in units of measurement that arise when the elements of
Rl are functions of continuous variables, such as distance or income (Bolduc et al., 1989, p. 369). But something might then be needed to compensate for the discreteness of R , as many distributed phenomena are likely to be smooth and their representation by a few « all-or-nothing » slices insufficient: the solution resides in taking due account of the whole set of near and distant “neighbor” slices, as long done with distributed lags in time-series analysis.
Distributed “spatial” lags. Following the Blum et al. (1995/1996) approach, powers of Rl
generate a sequence of contiguity matrices (R , ... ,2 R , ...) which define degrees of c
neighborliness or proximity, with 2
R denoting neighbors of neighbors, and c
R higher powers. Under the assumption that the impact of these close and distant neighbors decreases geometrically with «distance» c, as in Koyck (1954) distributed lags of time-series (whence the name Autoregressive Contiguous Distributed (AR-C-D) for this analogue process), one obtains R I (1 )R 1R , where the new proximity parameter allows for endogenization of the relative importance of near and distant effects. If =1, R~l=Rl, in which case only the adjacent neighbors have an impact on the correlations among the residuals selected by the “residue impact criterion” R , exactly as in the classical (Ord, 1975; Cliff & Ord, 1981) case. By contrast, as →0, the near effect is reduced to a minimum in favor of the distant effect. In this R-Koyck formulation, the parameter therefore generally weighs the relative importance of near and distant effects, i.e. the sharpness or slope of the decline. Using the L-2.1 algorithm (Tran & Gaudry, 2008), we will test below, in our analysis of Maintenance cost (ut) by segment, three specifications of the R matrix and,
singly and jointly, two distributed processes as well.
12 For an example of directed choice involving correlation of residuals across socio-economic groups, see Gaudry & Blum (1988). For distributed processes with transport and trade flow models, see Gaudry (2004).
18
Log likelihood function and measure of fit. As discussed at length in Dagenais et al.
(1987), the proper statistical model to use for problems like ours, where yt can be said to have
both a lower limit (e.g. maintenance cost cannot be negative but can be close 0, implying the possibility of a mass point at - 1/ when > 0, or in practice at a very small number ) and an upper limit (maintenance cost cannot exceed the periodic reconstruction cost, called “renewal cost”), is the Rosett & Nelson (1975) two-limit Tobit model where the likelihood of observing the vector y ≡ (y1, … , yt, … , yT) reduces, in the absence of limit observations in
the sample, to the maximand actually proposed by Box and Cox (1964) themselves: (24-G) 2 T t t 2 2 t 1 w w t w w 1 exp 2 y 2
,where, under the assumptions of normality and constancy of the variance w2 of the independent error term wt of zero mean, the Jacobian of the transformation from wt to the
observed yt is w / yt t yty 1
. With multiple BCT in (24-A), finding the global maximum of ln( is required because its concavity need not hold (Kouider & Chen, 1995).
But, even in the absence of limit observations in our final doubly censored samples, any observation yt in (24-A) is still assumed to be censored both downwards and upwards, within
a range ≤ yt ≤ , where and are respectively the strictly positive lower and upper
censoring points common to all observations. In such and forthcoming generalizations of the Tobit model13 to a doubly censored dependent variable, the expected value of yt, given that
(w) is the normal density function of w with 0 mean and variance 2w, is given by:
(24-H) ( ) ( ) ( ) ( ) ( ) t ( ) t ( ) ( ) , ( 0) t t w w t w t w E y u du y w dw w dw and
.Elasticities and t-statistics of the k. In all forthcoming tables of results, we report on
elasticities of the dependent variable and for brevity neglect the regression coefficients14 which have lost their intuitive interpretation in BCT models, but we present their t-statistics computed conditionally upon the value of BCT estimates (Spitzer, 1984). Although the L-1.4 and L-2.1 algorithms used both compute the elasticity of E(y) defined in (24-H) with respect to all explanatory variables (including the Zm if heteroskedasticity is present), we prefer
instead, for comparability with published results, to list here the so-called “sample” measure, defined in Dagenais et al. (1987, pp. 464-467) for standard and Boolean dummy variables Xk
and Xd, as: (24-I) k k y kt t k k t k X k X ,y X X y ( y , X ) X y y
, (24-J) d y t d t d X y X ( y , X ) y
,where the vertical line means that the expression (for our homoskedastic cases) is « evaluated at t » (at sample means, in all of our tables) and Xd denotes the sample mean calculated over non-zero observations. Expression (24-J) provides an acceptable estimate of the percentage change in the dependent variable resulting from the presence of the dummy variable, i.e. an “elasticity” measure of the response resulting from the addition of the dummy variable.
13 The original Tobin (1958) paper had limits that varied by observation. Here it is assumed that current Maintenance expenditures ut include at least minimum surveillance and cannot be larger than the Regeneration cost, and that technically defined Service measure St is limited between a minimum contractually defined threshold level which triggers immediate corrective action and a maximum provided after regeneration.
14


![Table 5. Main variables used to establish the existence of three maintenance cost phases u = f [ K(e 0 ; h 0 ), Q(W 2-6 ; W 7-9 ), q(w or w c ), t ] 1999 cost per km track & segment](https://thumb-eu.123doks.com/thumbv2/123doknet/12950030.375813/21.892.106.782.457.551/table-main-variables-establish-existence-maintenance-phases-segment.webp)