HAL Id: halshs-02658753
https://halshs.archives-ouvertes.fr/halshs-02658753
Preprint submitted on 30 May 2020HAL is a multi-disciplinary open access archive for the deposit and dissemination of sci-entific research documents, whether they are pub-lished or not. The documents may come from teaching and research institutions in France or abroad, or from public or private research centers.
L’archive ouverte pluridisciplinaire HAL, est destinée au dépôt et à la diffusion de documents scientifiques de niveau recherche, publiés ou non, émanant des établissements d’enseignement et de recherche français ou étrangers, des laboratoires publics ou privés.
Global Inequality Dynamics: New Findings from
WID.world
Facundo Alvaredo, Lucas Chancel, Thomas Piketty, Emmanuel Saez, Gabriel
Zucman
To cite this version:
Facundo Alvaredo, Lucas Chancel, Thomas Piketty, Emmanuel Saez, Gabriel Zucman. Global In-equality Dynamics: New Findings from WID.world. 2017. �halshs-02658753�
World Inequality Lab Working papers n°2017/1
"Global Inequality Dynamics: New Findings from WID.world"
Facundo Alvaredo, Lucas Chancel, Thomas Piketty, Emmanuel Saez, Gabriel
Zucman
Keywords : Inequality; inequality dynamics; top income; wealth share; DINA;
Distributional National Accounts; United States; China; France; United Kingdom
Global Inequality Dynamics: New Findings from WID.world
Facundo Alvaredo, Lucas Chancel, Thomas Piketty, Emmanuel Saez, and Gabriel Zucman NBER Working Paper No. 23119
February 2017
JEL No. E01,H2,H5,J3
ABSTRACT
This paper presents new findings on global inequality dynamics from the World Wealth and Income Database (WID.world), with particular emphasis on the contrast between the trends observed in the United States, China, France, and the United Kingdom. We observe rising top income and wealth shares in nearly all countries in recent decades. But the magnitude of the increase varies substantially, thereby suggesting that different country-specific policies and institutions matter considerably. Long-run wealth inequality dynamics appear to be highly unstable. We stress the need for more democratic transparency on income and wealth dynamics and better access to administrative and financial data.
Facundo Alvaredo
Paris School of Economics 48 Boulevard Jourdan 75014 Paris, France
and Oxford University and CONICET [email protected]
Lucas Chancel
Paris School of Economics 48 Boulevard Jourdan 75014 Paris, France [email protected] Thomas Piketty
Paris School of Economics 48 Boulevard Jourdan 75014 Paris, France [email protected]
Emmanuel Saez
Department of Economics
University of California, Berkeley 530 Evans Hall #3880 Berkeley, CA 94720 and NBER [email protected] Gabriel Zucman Department of Economics
University of California, Berkeley 530 Evans Hall, #3880
Berkeley, CA 94720 and NBER
Rising inequality has attracted considerable interest among academics, policy-makers and the general public in recent years, as shown by the attention received by an academic book recently published by one of us (Piketty, 2014). Yet despite this endeavor we still face important limitations in our ability to measure the changing distribution of income and wealth, both within and between countries, and at the world level. In this paper, we present new findings about global inequality dynamics from the World Wealth and Income Database (WID.world), which aims at measuring income and wealth inequality on a consistent basis over time and across countries. We start with a brief history of the WID.world project. We then present selected findings on income inequality, private vs. public wealth to income ratios, and wealth inequality, with particular emphasis on the contrast between the trends observed in the United States (US), China, France, and the United Kingdom (UK).
History of WID.world
The WID.world project started with the construction of historical top income share series for France, the US, and the UK, and then extended to a growing number of countries (Piketty 2001, 2003; Piketty and Saez 2003; Atkinson and Piketty 2007, 2010; Atkinson et al. 2011; Alvaredo et al. 2013). These projects generated a large volume of data, intended as a research resource for further analysis, as well as a source to inform the public debate on inequality. The World Top Incomes Database-WTID (Alvaredo et al. 2011-2015) was created in January 2011 with the aim of providing convenient and free access to all the existing series. Thanks to the contribution of over a hundred researchers, the WTID expanded to include series on income concentration for more than thirty countries, spanning over most of the 20th, early 21st centuries, and, in some cases, going back to the 19th century.
Following the pioneering work of Kuznets (1953), the WTID combined tax and national accounts data in a systematic manner to estimate longer and more reliable top income shares series than previous inequality databases (which generally rely on self-reported survey data, with under-reporting problems at the top, and limited time span). These series had a large impact on the discussion on global inequality. In particular, by making it possible to compare over long periods of time and across countries the income shares captured by top income groups (e.g. the top 1%), they contributed to reveal new facts and refocus the discussion on rising inequality.
In December 2015, the WTID was subsumed into the WID, The World Wealth and Income Database. In addition to the WTID top income shares series, this first version of WID included an extended version of the historical database on the long-run evolution of aggregate wealth-income ratios first developed by Piketty and Zucman (2014). We changed the name of the database from the WTID to the WID in order to reflect the increasing scope and ambition of the database. In January 2017 we launched a new database and website, WID.world (www.wid.world), with better data visualization tools and more extensive data coverage.
The database is currently being extended into three main directions. Firstly, we aim to cover more developing countries (and not only developed countries, which were the main focus of the earlier studies, largely due to data access). In recent years, fiscal information has been released in a number of emerging economies, including China, Brazil, India, and South Africa. In this paper we present some of the findings obtained for China. In the near future WID.world will include new and updated series for other countries. Secondly, we plan to provide more series on
wealth-income ratios and the distribution of wealth, and not only on wealth-income. Thirdly, we aim to offer series on the entire distribution of income and wealth, from the bottom to the top, and not only on top shares. The overall long-run objective is to produce Distributional National Accounts (DINA), that is, to provide annual estimates of the distribution of income and wealth using concepts of income and wealth that are consistent with the macroeconomic national accounts. In this way, the analysis of growth and inequality can be carried over in a fully coherent frame.1
Income Inequality Dynamics: US, China, France
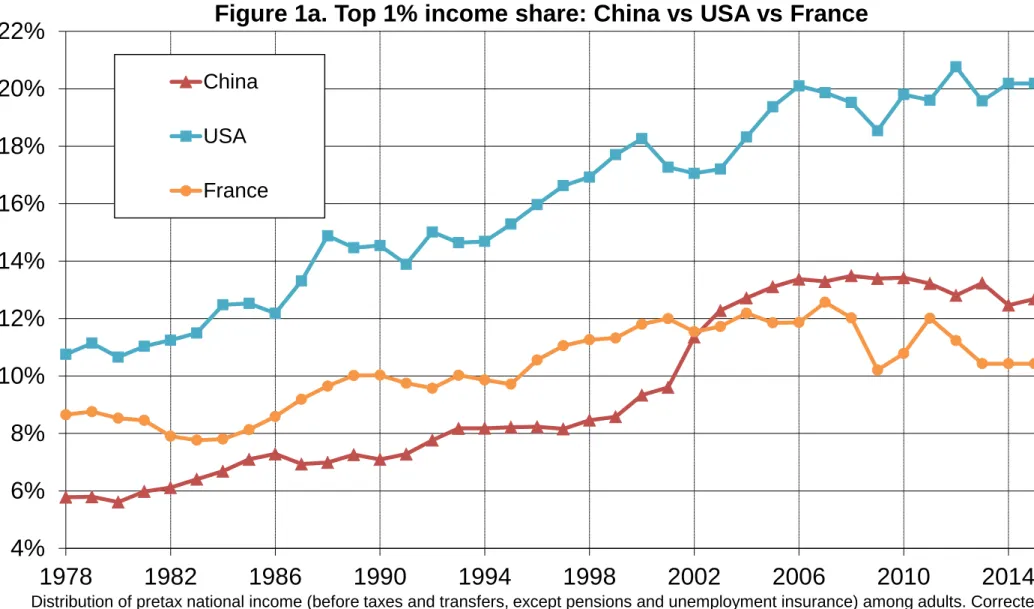
We first present some selected results on income inequality dynamics for the US, China, and France (a country that is broadly representative of the West European pattern) in Figure 1. All series follow the same general DINA Guidelines (Alvaredo et al. 2016). We combine national accounts, survey, and fiscal data in a systematic manner in order to estimate the full distribution of pre-tax national income (including tax exempt capital income and undistributed profits).2
The combination of tax and survey data leads to markedly revise upwards the official inequality estimates of China. We find a corrected top 1% income share of around 13% of total income in 2015, vs. 6.5% in survey data. We stress that our estimates should likely be viewed as lower bounds, due to tax evasion and other limitations of tax data and national accounts in China. But they are already more realistic and plausible than survey-based estimates, and illustrate the need for more systematic use of administrative records, even from countries where the tax
1 WID.world already includes comprehensive series on national income and net foreign income series for nearly all
countries in the world (see Blanchet and Chancel, 2016).
2 Regarding DINA, we refer to the country-specific papers for a detailed discussion of findings and methodological
issues (Piketty, Saez and Zucman, 2016; Piketty, Yang, and Zucman, 2016; and Garbinti, Goupille and Piketty 2016). In particular, the series for China make use of the data recently released by the tax administration on high-income taxpayers and include a conservative adjustment for the undistributed profit of privately owned corporations.
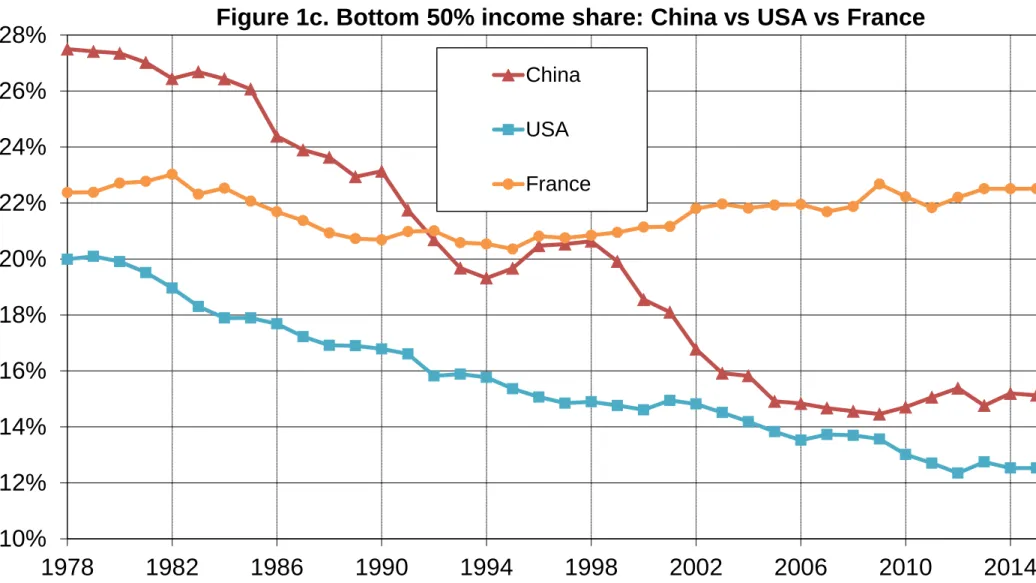
administration is far less than perfect. Figure 1 shows that China had very low inequality levels in the late 1970s, but it is now approaching the US, where income concentration remains the highest among the countries shown. In particular, we observe a complete collapse of the bottom 50% income share in the US between 1978 and 2015, from 20% to 12% of total income, while the top 1% income share rose from 11% to 20%. In contrast, and in spite of a similar qualitative trend, the bottom 50% share remains higher than the top 1% share in 2015 in China, and even more so in France.3
In light of the massive fall of the bottom 50% pre-tax incomes in the US, our findings also suggest that policy discussions about rising global inequality should focus on how to equalize the distribution of primary assets, including human capital, financial capital, and bargaining power, rather than merely discussing the ex-post redistribution through taxes and transfers. Policies that could raise the bottom 50% pre-tax incomes include improved education and access to skills, which may require major changes in the system of education finance and admission; reforms of labor market institutions, including minimum wage, corporate governance, and workers’ bargaining power through unions and representation in the board of directors; and steeply progressive taxation, which can affect pay determination and pre-tax distribution, particularly at the top end (see, e.g., Piketty, Saez and Stantcheva 2014, and Piketty 2014).
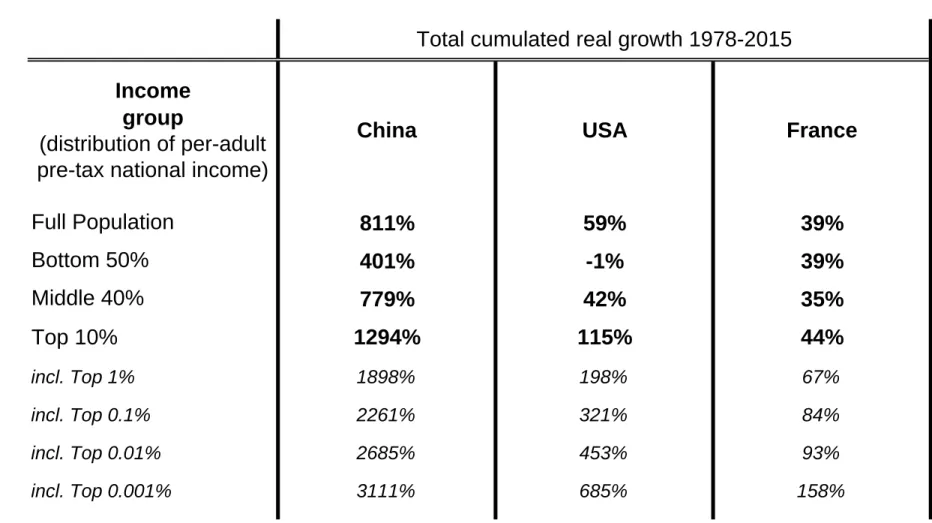
The comparison between the US, China and France illustrates how the Distributional National Accounts (DINA) can be used to analyze the distribution of growth across income classes. According to national accounts, per adult national income has increased in the three countries
3
It should be noted that these series refer to pre-tax, pre-transfer inequality. Post-tax, post-transfer series (in progress) are likely to reinforce these conclusions, at least regarding the US-France comparison.
between 1978 and 2015: +811% in China, +59% in the US, and +39% in France. Nevertheless, the performance has been very different across the distribution (see Table 1). We observe a clear pattern of rising inequality: top income groups enjoyed relatively more growth, while the situation has been very different for the bottom. In China, top groups have enjoyed very high growth, but aggregate growth was also so large that even the bottom 50% average income grew markedly by +401% between 1978 and 2015. This is likely to make rising inequality much more acceptable. In contrast, in the US, there was no growth left at all for the bottom 50% (-1%). France illustrates another type of situation. Very top incomes have grown more than average, but this pattern of rising inequality happened only for very high and numerically relatively negligible groups, so that it had limited consequences for the majority of the population. In effect, the bottom 50% income group enjoyed the same growth as average growth (+39%).
Private vs. Public Wealth-Income Ratios: US, China, France, UK, Japan, Germany
Next, we present findings on the evolution of aggregate wealth on Figure 2. We observe a general rise of the ratio between net private wealth and national income in nearly all countries in recent decades. It is striking to see that this long-run finding was largely unaffected by the 2008 financial crisis. It is also worth stressing the unusually large rise of the ratio for China. According to our estimates, net private wealth was a little above 100% of national income in 1978, while it is above 450% in 2015. The private wealth-income ratio in China is now approaching the levels observed in the US (500%) and in the UK and France (550-600%).
The structural rise of private wealth-income ratios in recent decades is due to a combination of factors, which can decomposed into volume factors (high saving rates, which can themselves be
due to ageing and/or rising inequality, with differing relative importance across countries, combined with growth slowdown), and relative asset prices and institutional factors, including the increase of real estate prices (which can be due to housing portfolio bias, the gradual lift of rent controls, and the lower technical progress in construction and transportation technologies as compared to other sectors) and stock prices (which can reflect higher power of shareholders leading to the observed rising Tobin’s Q ratios between market and book value of corporations).
Another key institutional factor to understand the rise of private wealth-income ratios is the gradual transfer from public wealth to private wealth. This is particularly spectacular in the case of China, where the share of public wealth in national wealth dropped from about 70% in 1978 to 35% by 2015. The corresponding rise of private property has important consequences for the levels and dynamics of inequality of income and wealth. In rich countries, net public wealth (public assets minus public debts) has become negative in the US, Japan and the UK, and is only slightly positive in Germany and France. This arguably limits government ability to redistribute income and mitigate rising inequality. The only exceptions to the general decline in public property are oil-rich countries with large public sovereign funds, such as Norway.
Wealth Inequality Dynamics: US, China, France, UK
Finally, we present findings on wealth inequality on Figure 3. We stress that currently available statistical information on the distribution of wealth and cross-border assets are highly imperfect in today’s global economy. More transparency and better access to administrative and banking data sources are sorely needed if we want to gain knowledge of the underlying evolutions. In WID.world, we combine different sources and methods in a very transparent way in order to
reach robust conclusions: the income capitalization method (using income tax returns), the estate multiplier method (using inheritance and estate tax returns), wealth surveys, national accounts, rich lists and generalized Pareto curves. Nevertheless, our series should still be viewed as imperfect, provisional, and subject to revision. We provide full access to our data files and computer codes so that everybody can use them and contribute to improve the data collection.4
We observe a large rise of top wealth shares in the US and China in recent decades, and a more moderate rise in France and the UK. A combination of factors explains these different dynamics. First, higher income inequality and severe bottom income stagnation can naturally explain higher wealth inequality in the US. Next, the very unequal process of privatization and access by Chinese households to quoted and unquoted equity probably played an important role in the very fast rise of wealth concentration in China, particularly at the very top end. The potentially large mitigating impact of high real estate prices should also be taken into account. This middle class effect is likely to have been particularly strong in France and the UK, where housing prices have increased significantly relative to stock prices.
Given all these factors, it is not an easy task to predict whether the observed trend of rising concentration of wealth will continue. In the long run, steady-state wealth inequality depends on the inequality of saving rates across income and wealth groups, the inequality of labor incomes and rates of returns to wealth, and the progressivity of income and wealth taxes. Numerical simulations show that the response of steady-state wealth inequality to relatively small changes in these structural parameters can be rather large (see Saez and Zucman, 2016, and Garbinti,
4
We refer to the country-specific paper for detailed discussions; see Saez and Zucman, 2016; Alvaredo, Atkinson and Morelli, 2016 a,b; Garbinti, Goupille and Piketty 2016; Piketty, Yang and Zucman, 2016.
Goupille and Piketty, 2016). In our view, this instability reinforces the need for increased democratic transparency about the dynamics of income and wealth.
Final Remarks
To conclude, we stress that global inequality dynamics involve strong and contradictory forces. We observe rising top income and wealth shares in nearly all countries in recent decades. But the magnitude of rising inequality varies substantially across countries, thereby suggesting that different country-specific policies and institutions matter considerably. High growth rates in emerging countries reduce between-country inequality, but this in itself does not guarantee acceptable within-country inequality levels and ensure the social sustainability of globalization. Access to more and better data (administrative records, surveys, more detailed and explicit national accounts, etc.) is critical to monitor global inequality dynamics, as this is a key building brick both to properly understand the present as well as the forces which will dominate in the future, and to design potential policy responses.
References
Alvaredo, Facundo, Anthony B. Atkinson, Thomas Piketty, and Emmanuel Saez. 2011-2015. The World Top Incomes Database. Online between January 2011 and December 2011-2015.
Alvaredo, Facundo, - , - , and -. 2013. “The Top 1% in International and Historical Perspective,” Journal of Economic Perspectives, 27(3), 3-20.
Alvaredo, Facundo, Anthony B. Atkinson, Lucas Chancel, Thomas Piketty, Emmanuel Saez, and Gabriel Zucman. 2016. “Distributional National Accounts (DINA) Guidelines: Concepts and Methods used in the World Wealth and Income Database.” WID.world WP.
Alvaredo, Facundo, Anthony B. Atkinson, and Salvatore Morelli. 2016. “Top Wealth Shares in the UK over more than a century.” Mimeo.
Alvaredo, Facundo, Anthony B. Atkinson, and Salvatore Morelli. 2016. “The Challenge of Measuring UK Wealth Inequality in the 2000s.” Fiscal Studies, 37(1), 13-33.
Atkinson, Anthony B., and Alan Harrison. 1978. Distribution of Personal Wealth in Britain. Cambridge, UK: Cambridge University Press.
Atkinson, Anthony B., and Thomas Piketty. 2007. Top Incomes over the Twentieth Century. A Contrast Between European and English Speaking Countries. Oxford: Oxford University Press.
Atkinson, Anthony B., and Thomas Piketty. 2010. Top Incomes. A Global Perspective. Oxford: Oxford University Press.
Atkinson, Anthony B., Thomas Piketty, and Emmanuel Saez. 2011. “Top Incomes in the Long-Run of History”, Journal of Economic Literature, 49(1), 3-71.
Blanchet, Thomas, and Lucas Chancel. 2016. “National Accounts Series Methodology”, WID.world Methodological Note.
Blanchet, Thomas, Juliette Fournier, and Thomas Piketty. 2016. “Generalized Pareto Curves: Theory and Applications”, WID.world Working Paper.
Garbinti, Bertrand, Jonathan Goupille, and Thomas Piketty. 2016. “Inequality Dynamics in France, 1900-2014: Evidence from Distributional National Accounts (DINA)”, WID.world WP.
Kuznets, Simon. 1953. Shares of Upper Income Groups in Income and Savings. NBER
redistributions 1901–1998. Paris: Grasset.
Piketty, Thomas. 2003. “Income Inequality in France, 1901–1998.” Journal of Political Economy, 111(5): 1004–1042.
Piketty, Thomas. 2014. Capital in the 21st Century. Cambridge: Harvard University Press.
Piketty, Thomas, and Emmanuel Saez. 2003. “Income Inequality in the United States, 1913-1998,” Quarterly Journal of Economics, 118(1), 1-39.
Piketty, Thomas, Emmanuel Saez, and Stefanie Stantcheva. 2014. “Optimal Taxation of Top Labor Incomes,” American Economic Journal: Economic Policy, 6(1), 230–271.
Piketty, Thomas, Emmanuel Saez, and Gabriel Zucman. 2016. “Distributional National Accounts: Methods and Estimates for the United States”, NBER Working Paper No. 22945.
Piketty, Thomas, Li Yang, and Gabriel Zucman. 2016. “Capital Accumulation, Private Property and Rising Inequality in China 1978-2015”. WID.world Working Paper.
Piketty, Thomas, and Gabriel Zucman. 2014. “Capital is Back: Wealth-Income Ratios in Rich Countries, 1700-2010,” Quarterly Journal of Economics 129(3), 1255-1310.
Saez, Emmanuel and Gabriel Zucman. 2016.“Wealth Inequality in the United States: Evidence from Capitalized Income Tax Data,” Quarterly Journal of Economics 131(2), 519-578.
Zucman, Gabriel. 2014. "Taxing Across Borders: Tracking Personal Wealth and Corporate Profits", Journal of Economic Perspectives, 28(4), 121-148.
4%
6%
8%
10%
12%
14%
16%
18%
20%
22%
1978
1982
1986
1990
1994
1998
2002
2006
2010
2014
Figure 1a. Top 1% income share: China vs USA vs France
China
USA
France
Distribution of pretax national income (before taxes and transfers, except pensions and unemployment insurance) among adults. Corrected estimates combining survey, fiscal, wealth and national accounts data. Equal-split-adults series (income of married couples divided by two). USA: Piketty, Saez and Zucman (2016). France: Garbinti, Goupille and Piketty (2016). China: Piketty, Yang,
25%
30%
35%
40%
45%
50%
1978
1982
1986
1990
1994
1998
2002
2006
2010
2014
Figure 1b. Top 10% income share: China vs rich countries
China
USA
France
Distribution of pretax national income (before taxes and transfers, except pensions and UI) among adults. Corrected estimates combining survey, fiscal, wealth and national accounts data. Equal-split-adults series (income of married couples divided by two). USA: Piketty, Saez and Zucman (2016). France: Garbinti, Goupille and Piketty (2016). China: Piketty, Yang and Zucman (2016).
10%
12%
14%
16%
18%
20%
22%
24%
26%
28%
1978
1982
1986
1990
1994
1998
2002
2006
2010
2014
Figure 1c. Bottom 50% income share: China vs USA vs France
China
USA
France
Distribution of pretax national income (before taxes and transfers, except pensions and UI) among adults. Corrected estimates combining survey, fiscal, wealth and national accounts data. Equal-split-adults series (income of married couples divided by two). USA: Piketty, Saez and Zucman (2016). France: Garbinti, Goupille and Piketty (2016). China: Piketty, Yang and Zucman (2016).
100%
150%
200%
250%
300%
350%
400%
450%
500%
550%
600%
1978
1982
1986
1990
1994
1998
2002
2006
2010
2014
Figure 2a: The rise of wealth-income ratios
(net private wealth in % national income)
China
USA
France
Britain
Net private wealth (personal + non-profit) as a fraction of net national income.
-10%
0%
10%
20%
30%
40%
50%
60%
70%
80%
1978
1982
1986
1990
1994
1998
2002
2006
2010
2014
Figure 2b. The decline of public property
(share of public wealth in national wealth)
China
USA
Japan
France
Britain
Germany
Share of net public wealth (public assets minus public debt) in net national wealth (private + public).
-10%
0%
10%
20%
30%
40%
50%
60%
70%
80%
1978
1982
1986
1990
1994
1998
2002
2006
2010
2014
Figure 2c. The decline of public property vs. the rise of sovereign funds
(share of public wealth in national wealth)
China
USA
Japan
France
Britain
Germany
Norway
Share of net public wealth (public assets minus public debt) in net national wealth (private + public).
10%
20%
30%
40%
50%
60%
70%
80%
1890
1900
1910
1920
1930
1940
1950
1960
1970
1980
1990
2000
2010
Figure 3a. Top 1% wealth share: China vs USA vs France vs Britain
USA
Britain
France
China
Distribution of net personal wealth among adults. Corrected estimates (combining survey, fiscal, wealth and national accounts data). Equal-split-adults series (wealth of married couples divided by two). USA: Saez and Zucman (2016). Britain: Alvaredo, Atkinson and Morelli (2017). France: Garbinti, Goupille and Piketty (2016). China: Piketty, Yang and Zucman (2016).
30%
40%
50%
60%
70%
80%
90%
100%
1890
1900
1910
1920
1930
1940
1950
1960
1970
1980
1990
2000
2010
Figure 3b. Top 10% wealth share: China vs USA vs France vs Britain
USA
Britain
France
China
Distribution of net personal wealth among adults. Corrected estimates (combining survey, fiscal, wealth and national accounts data). Equal-split-adults series (wealth of married couples divided by two). USA: Saez-Zucman (2016). Britain: Alvaredo, Atkinson and Morelli (2017). France: Garbinti, Goupille and Piketty (2016). China: Piketty, Yang and Zucman (2016).
Income
group
(distribution of per-adult
pre-tax national income)
China
USA
France
Full Population
811%
59%
39%
Bottom 50%
401%
-1%
39%
Middle 40%
779%
42%
35%
Top 10%
1294%
115%
44%
incl. Top 1% 1898% 198% 67% incl. Top 0.1% 2261% 321% 84% incl. Top 0.01% 2685% 453% 93% incl. Top 0.001% 3111% 685% 158%Table 1 : Income growth and inequality 1978-2015
Distribution of pre-tax national income (before taxes and transfers, except pensions and UI) among adults. Corrected estimates combining survey, fiscal, wealth and national accounts data. Equal-split-adults series (income of married couples divided by two). USA: Piketty-Saez-Zucman (2016). France: Garbinti-Goupille-Piketty (2016). China: Piketty-Yang-Zucman (2016).