HAL Id: hal-01500475
https://hal-univ-rennes1.archives-ouvertes.fr/hal-01500475
Submitted on 2 Jun 2017
HAL is a multi-disciplinary open access
archive for the deposit and dissemination of
sci-entific research documents, whether they are
pub-lished or not. The documents may come from
teaching and research institutions in France or
abroad, or from public or private research centers.
L’archive ouverte pluridisciplinaire HAL, est
destinée au dépôt et à la diffusion de documents
scientifiques de niveau recherche, publiés ou non,
émanant des établissements d’enseignement et de
recherche français ou étrangers, des laboratoires
publics ou privés.
Distributed under a Creative Commons Attribution - ShareAlike| 4.0 International
License
diverse plant species
Thomas C. Mathers, Yazhou Chen, Gemy Kaithakottil, Fabrice Legeai, Sam
T. Mugford, Patrice Baa-Puyoulet, Anthony Bretaudeau, Bernardo Clavijo,
Stefano Colella, Olivier Collin, et al.
To cite this version:
Thomas C. Mathers, Yazhou Chen, Gemy Kaithakottil, Fabrice Legeai, Sam T. Mugford, et al.. Rapid
transcriptional plasticity of duplicated gene clusters enables a clonally reproducing aphid to colonise
diverse plant species. Genome Biology, BioMed Central, 2017, 18 (1), pp.27.
�10.1186/s13059-016-1145-3�. �hal-01500475�
R E S E A R C H
Open Access
Rapid transcriptional plasticity of
duplicated gene clusters enables a clonally
reproducing aphid to colonise diverse plant
species
Thomas C. Mathers
1,3†, Yazhou Chen
2,3†, Gemy Kaithakottil
1, Fabrice Legeai
3,4,5, Sam T. Mugford
2,3,
Patrice Baa-Puyoulet
3,6, Anthony Bretaudeau
3,4,5, Bernardo Clavijo
1, Stefano Colella
3,6,17, Olivier Collin
5,
Tamas Dalmay
7, Thomas Derrien
8, Honglin Feng
3,9, Toni Gabaldón
3,10,11,12, Anna Jordan
2, Irene Julca
3,10,11,
Graeme J. Kettles
2,18, Krissana Kowitwanich
2,19, Dominique Lavenier
5, Paolo Lenzi
2,20, Sara Lopez-Gomollon
7,21,
Damian Loska
3,10,11, Daniel Mapleson
1, Florian Maumus
3,13, Simon Moxon
1, Daniel R. G. Price
3,9,22, Akiko Sugio
2,4,
Manuella van Munster
3,14, Marilyne Uzest
3,14, Darren Waite
1, Georg Jander
3,15, Denis Tagu
3,4, Alex C. C. Wilson
3,9,
Cock van Oosterhout
3,16, David Swarbreck
1,3,16*and Saskia A. Hogenhout
2,3,16*Abstract
Background: The prevailing paradigm of host-parasite evolution is that arms races lead to increasing specialisation via genetic adaptation. Insect herbivores are no exception and the majority have evolved to colonise a small number of closely related host species. Remarkably, the green peach aphid, Myzus persicae, colonises plant species across 40 families and single M. persicae clonal lineages can colonise distantly related plants. This remarkable ability makes M. persicae a highly destructive pest of many important crop species.
Results: To investigate the exceptional phenotypic plasticity of M. persicae, we sequenced the M. persicae genome and assessed how one clonal lineage responds to host plant species of different families. We show that genetically identical individuals are able to colonise distantly related host species through the differential regulation of genes belonging to aphid-expanded gene families. Multigene clusters collectively upregulate in single aphids within two days upon host switch. Furthermore, we demonstrate the functional significance of this rapid transcriptional change using RNA interference (RNAi)-mediated knock-down of genes belonging to the cathepsin B gene family. Knock-down of cathepsin B genes reduced aphid fitness, but only on the host that induced upregulation of these genes. Conclusions: Previous research has focused on the role of genetic adaptation of parasites to their hosts. Here we show that the generalist aphid pest M. persicae is able to colonise diverse host plant species in the absence of genetic specialisation. This is achieved through rapid transcriptional plasticity of genes that have duplicated during aphid evolution.
Keywords: Plasticity, Genome sequence, Myzus persicae, Transcriptome, Gene duplication, RNA interference (RNAi), Hemiptera, Parasite, Sap-feeding insects
* Correspondence:saskia.hogenhout@jic.ac.uk;
david.swarbreck@earlham.ac.uk
†Equal contributors
1Earlham Institute, Norwich Research Park, Norwich NR4 7UZ, UK 2John Innes Centre, Norwich Research Park, Norwich NR4 7UH, UK
Full list of author information is available at the end of the article
© The Author(s). 2017 Open Access This article is distributed under the terms of the Creative Commons Attribution 4.0 International License (http://creativecommons.org/licenses/by/4.0/), which permits unrestricted use, distribution, and reproduction in any medium, provided you give appropriate credit to the original author(s) and the source, provide a link to the Creative Commons license, and indicate if changes were made. The Creative Commons Public Domain Dedication waiver (http://creativecommons.org/publicdomain/zero/1.0/) applies to the data made available in this article, unless otherwise stated.
Background
Parasites often exhibit a high degree of specialisation to a single or reduced range of host species [1, 2]. This is especially true for insect herbivores, of which there are around 450,000 described species living on around 300,000 species of vascular plants, the majority of which are monophagous or oligophagous, being able to colon-ise only one or a few closely related plant species [3]. Acute specialisation of parasites is likely due to the complex relationships that occur between the parasites and their hosts, with increasing specialisation being driven by co-evolutionary arms races [4, 5]. In the case of herbivorous insects, the plant–insect interface repre-sents a dynamic battleground between host and parasite, in which insect effector genes evolve to subvert plant defences and plant resistance genes evolve to detect infec-tion and guide plant immunity [6, 7].
Despite the tendency for parasites to evolve highly specialised relationships with their hosts, occasionally, genuine generalist species with broad host ranges have evolved. For example, clonally produced individuals of the parasitic trematode Maritrema novaezealandensis are able to colonise a broad range of crustacean species [8] and the giant round worm Ascaris lumbricoides, which causes Ascariasis and infects an estimated 0.8 billion people worldwide, is able to infect both humans and pigs [9]. Often, however, generalist parasite species have turned out to be cryptic specialists, made up of host adapted biotypes / races or cryptic species com-plexes [10–12]. For example, the pea aphid Acyrthosi-phon pisum is considered polyphagous, being found on most plants of the Fabaceae, but actually consists of different biotypes on a continuum of differentiation that colonise specific species of this plant family [13]. In another example, phylogenetic analysis of Aphidiinae parasitoid wasps showed that nearly all species previ-ously categorised as generalists were in fact cryptic, host specialised, species complexes [14]. Even when the oc-currence of true generalist species has been demon-strated, a degree of host specialisation may be inevitable. In the generalist oomycete plant pathogen Albugo can-dida, host adapted races suppress plant immunity which facilitates colonisation by non-specialist lineages provid-ing opportunities for gene flow (or genetic introgression) between host races, enabling host range expansion [15]. As such, genuine generalists remain rare and how such parasites manage to keep up in multilateral co-evolutionary arms races remains an evolutionary enigma.
The green peach aphid Myzus persicae is an extreme example of a genuine generalist, being able to colonise more than 100 different plant species from 40 plant families [16]. As in many other aphid species, M. persicae has a complex life cycle that consists of both sexual and parthenogenetic (clonal) stages. Sexual reproduction
occurs in autumn on Prunus spp. and produces overwin-tering eggs from which parthenogenetically reproducing nymphs emerge in the spring [17, 18]. These clonally re-producing individuals soon migrate to an extraordinarily diverse range of secondary host species, including many agriculturally important crop species [19]. In areas where Prunusspp. are mostly absent, such as in the UK, M. per-sicae becomes facultatively asexual, remaining on its secondary hosts all year round [19]. In both cases, clonal populations of M. persicae are found on diverse plant species. For example, M. persicae clone O populations are found on multiple crop species in the UK and France, including Brassica species, potato and tobacco ([20], J.C. Simon, personal communication).
To investigate the genetic basis of generalism in M. persicae, we sequenced the genomes of two M. persicae clones, G006 from the USA and O from the UK and the transcriptomes of clone O colonies reared on either Brassica rapa or Nicotiana benthamiana. These two plant species produce different defence compounds shown to be toxic to insect herbivores [21, 22] present-ing distinct challenges to aphid colonisation. Here we provide evidence that the transcriptional adjustments of co-regulated and aphid-expanded multiple member gene families underpin the phenotypic plasticity that enables rapid colonisation of distinct plants by M. per-sicaeclone O.
Results
M. persicae genome sequencing and annotation
To generate a high-quality M. persicae genome assembly we sequenced a holocyclic line of the US clone G006 [23] using a combination of Illumina paired-end and mate-pair libraries (Additional file 1: Table S1). The size of the assembled M. persicae genome was 347 Mb including ambiguous bases, representing over 82% of the total genome size as estimated from a kmer analysis of the raw reads (421.6 Mb). The assembly consists of 4018 scaffolds > 1 kb with an N50 scaffold length of 435 Kb (contig N50 71.4 kb) and an average coverage of 51× (Table 1). A total of 18,529 protein-coding genes (30,127 isoforms) were predicted using an annotation workflow incorporating RNA sequencing (RNA-seq) and protein alignments. We also generated a draft assembly of M. persicae clone O, the predominate genotype in the UK [24]. The clone O genome was independently assembled to a size of 355 Mb with 18,433 protein-coding genes (30,247 isoforms) annotated, validating the genome size and number genes identified in the G006 assembly (Table 1). Contiguity of the clone O assembly was lower than that of G006, with the assembled genome contain-ing 13,407 scaffolds > 1 Kb and havcontain-ing an N50 scaffold length of 164 Kb (contig N50 59 kb). In addition to protein-coding genes, we also identified 125 microRNA
(miRNA), 273 tRNA and 69 rRNA genes in the M. persi-caegenome. Completeness of the M. persicae assembled genome was assessed through analysis of 248 core eukaryotic genes (CEGMA) [25] and 1349 genes con-served in arthropods; greater than 94% of the test genes were identified as complete in the clone O and G006 as-semblies. Additionally, we assembled the M. persicae transcriptome de novo (i.e. without using the genomic reference) generating 79,898 M. persicae transcripts (greater than 1 kb), over 90% could be aligned to the genomic reference with high stringency (minimum 70% coverage and 95% identity).
Together these results indicate that a high percentage of the gene space is represented in the two M. persicae assemblies. We found 97% of the G006 gene models to be present in a single contig rather than divided across multiple contigs. Higher level scaffolding will therefore have little effect on improving transcript completeness. Of the predicted genes, more than 70% were categorised as complete via alignment to UniProt proteins. Full details of the assembly, annotation and validation of both genomes are given in Additional file 2.
Metabolic pathways are similar inM. persicae and A. pisum
A global analysis of the metabolism enzymes of M. persicae was generated based on the annotated gene models (Additional file 3) and is available in the ArthropodaCyc metabolic database collection (http://
arthropodacyc.cycadsys.org/) [26]. Metabolic recon-struction in A. pisum has highlighted the metabolic complementarity between the aphid and its obligate bacterial symbiont, Buchnera aphidicola, with the symbiont generating essential amino acids for the aphid [26]. We compared the amino acid metabolism pathways identified in the two clones of M. persicae with those previously identified in A. pisum [27, 28]. A. pisum and the two M. persicae gene sets share 170 enzymes belonging to known amino acid metabolism pathways. A. pisum has 22 enzymes that were not found in either of the two M. persicae gene sets and M. persicae has 13 enzymes that were not found in A. pisum. As previously shown in A. pisum, the M. persicae amino acid metabolism pathways appear complementary with that of B. aphidicola. Also, similar to A. pisum and Diuraphis noxia [26, 29], M. persicae lacks the tyrosine (Tyr) degradation pathway that is present in all insects included in Arthropoda-Cyc at the time of writing, indicating that the lack of this pathway may be common feature of aphids. As such, the ability of M. persicae to colonise mul-tiple plant species is unlikely to involve specific metabolic pathways that are absent in more specia-lised aphids.
Dynamic gene family evolution in aphids
To investigate gene family evolution in aphids and to understand if specific gene repertoires may contribute to M. persicae ability to have a broad plant host range, we conducted a comparative analysis of M. persicae genes with those of the specialist aphid A. pisum and 19 other arthropod species. Genes were clustered into families based on their protein sequence similarity using the Markov Cluster Algorithm (MCL) [30] (Additional file 4: Table S2). Herein, unless otherwise stated, we use the term ‘gene family’ to represent clusters generated by MCL. Phylogenetic relationships and relative divergence times among the included taxa were inferred based on 66 strict, single-copy orthologs found in all species [31, 32] (Fig. 1; Additional file 5: Figure S1). With the excep-tion of the placement of Pediculus humanus, all phylo-genetic relationships received maximum support and are in agreement with a recently published large-scale phy-logenomic study of insects [33]. Annotation of the M. persicaegenome reveals a gene count approximately half that of the specialist aphid A. pisum and similar to that of other insect species (Fig. 1), implying that the massive increase in gene content observed in A. pisum [28] may not be a general feature of aphid species. Using our comparative dataset, we find that the larger gene count of A. pisum compared to M. persicae is explained by two features, an increase in lineage-specific genes and wide-spread duplication of genes from conserved families
Table 1 Genome assembly and annotation summary
M. persicae A. pisum Statistic Clone O Clone
G006 Release 2.1b Genome No. sequences (> = 1 kb) 13,407 4018 12,969 Largest scaffold 1,018,155 2,199,663 3,073,041 Total length 354,698,803 347,304,760 541,675,471 Total length (> = 1 kb) 354,698,803 347,300,841 532,843,107 Scaffold N50 164,460 435,781 570,863 Contig N50 59,051 71,400 28,209 GC% 30.19 30.03 29.69 # Ns 11,562,637 1,836,185 36,934,320 Median kmer coverage 44× 51× NA CEGMA (% complete/partial) 94.76/98.39 94.35/98.39 93.15/97.98 Annotation
Gene count (Coding) 18,433 18,529 36,939 Total transcripts 30,247 30,127 36,939 Transcripts per gene 1.64 1.63 1.00 Transcript mean size
complementary DNA (bp)
(Fig. 1). A. pisum has approximately four times the number of lineage-specific genes than M. persicae (8876 versus 2275) and a greater number of genes in families with patchy orthology relationships across insects (5628 versus 7042, respectively). The higher number of broadly conserved genes in A. pisum is due to widespread gene duplication rather than differential loss of whole gene families in M. persicae with 75% (3336 / 4406) of A. pisum gene families that have patchy orthology in arthropods also found in M. persicae. Furthermore, the mean size of these families has increased by 82% in A. pisum(3.55 versus 1.95, Mann–Whitney U p < 0.00005). This is underlined by the pattern across all genes, with A. pisum having a significantly higher proportion of multi-copy genes than M. persicae (23,577 / 36,193 in A. pisum versus 9331 / 18,529 in M. persicae, Chi-square test:χ2= 1220.61, d.f. = 1, p = 2.02 × 10−267).
In addition to the differences observed between the two aphid species, there also appears to have been considerable change in gene content during aphid evolu-tion relative to other insect orders. After accounting for evolutionary divergence, the rate of accumulation of aphid-specific genes is higher than the accumulation of lineage-specific content in any other insect order (Fig. 1).
These genes are enriched for biological processes including detection and response to chemical stimuli, metabolic regulation and regulation of transcription, processes likely important in aphid evolution and diversification (Additional file 6: Figure S2 and Additional file 7: Table S3).
Modelling of gene gain and loss in widespread gene families across the arthropod phylogeny also highlights the dynamic pattern of gene family evolution in aphids (Additional file 8: Figure S3). After correcting for evolutionary distance between species, A. pisum has the highest rate of gene family expansion of any arthropod species (Additional file 8: Figure S3). M. persicae has also undergone a relatively high number of gene family expansions over a short period of time compared to other arthropod species, but has significantly fewer expanded gene families than A. pisum (114 / 4983 versus 538 / 4983; Chi-square test: χ2= 295.03, d.f. = 1, p = 3.984 × 10−66), and overall it has undergone a net decrease in gene family size. As such, gene gain in M. persicae appears to be restricted to a smaller subset of gene families than in A. pisum. This was also confirmed using a more inclusive set of gene families (6148 families found in both aphids as well as at least one other
Fig. 1 High rate of lineage-specific gene accumulation in aphids relative to all other insect orders. Figures show arthropod phylogenetic relation-ships, per genome proportions of single copy (blue) and duplicated (red) genes and orthology relationships among arthropod genes based on gene family clustering with MCL [30]. Phylogenetic relationships among arthropod species included for gene family clustering were estimated using RAxML [31] based on a protein alignment of 66 single-copy orthologs found in all taxa. This topology and protein alignment was then used to infer relative divergence times with RelTime [32] under an LG substitution model. Inset shows relative rate of lineage-specific gene accumula-tion for all included insect orders and comparison with aphids. Error bars show standard deviaaccumula-tion of species within a given grouping. Relative rates of lineage-specific gene accumulation were calculated for each species by dividing the number of group specific genes (either order-specific or aphid-order-specific) by the crown plus stem age for the given group (in relative divergence time)
species) with a binomial test to identify significant ex-pansion (173 / 6148 versus 391 / 6148; Chi-square test: χ2
= 88.31, d.f. = 1, p = 5.59 × 10⁻²¹). Interestingly, 85% of gene family expansions in M. persicae were shared with A. pisum. This suggests that a subset of M. persicae gene families may have been selected to retain high ancestral copy number or have experienced parallel, lineage-specific duplication against a background of reduced expansion genome wide. Full details of all expanded families are given in Additional file 9: Table S4.
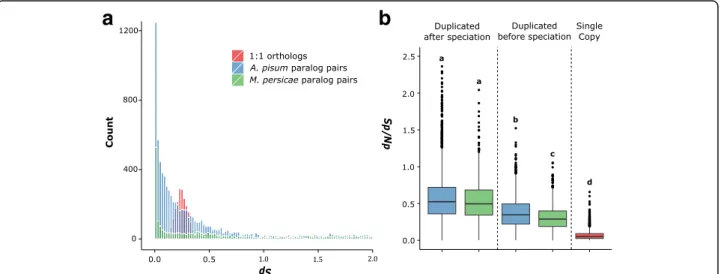
Genome streamlining in a generalist aphid
Differences in overall gene count and patterns of gene family evolution between M. persicae and A. pisum may be the result of a shift in gene duplication rate, altered selective regimes acting on duplicate retention (i.e. genome streamlining) or a combination of the two. To test this, we conducted a synonymous (dS) and
non-synonymous (dN) substitution rate analysis and
found evidence of increased genome streamlining in the generalist aphid M. persicae (Fig. 2a and Additional file 10: Figure S4). The age distribution of paralogs in M. persicae and A. pisum shows that gene duplicates have accumulated steadily in both species with a continuing high rate of duplication (Fig. 2a). However, we observe marked differences in the retention rates of ancestrally duplicated genes between the two species.
Using average dSbetween M. persicae and A. pisum 1:1
orthologs (dS= 0.26) as a cutoff to identify ancestral
(pre-speciation) duplicates, we find a significantly greater loss rate in M. persicae than A. pisum. In A. pisum, we found 382 genes that duplicated before speciation and, of those, M. persicae has lost one or both paralogs in 224 families (59% loss). We detected 285 families that duplicated before speciation in M. persicae and, of those, 69 families lost one or both paralogs in A. pisum (24% loss) (Chi-square test: χ2= 78.55, d.f. = 1, p = 7.82 × 10⁻¹⁹). Consistent with gen-ome streamlining, we also observe stronger purifying selection in ancestral duplicates retained in M. persicae than in A. pisum (Fig. 2b and Additional file 10: Figure S4).
A phylome resource for aphids
A phylome resource (the complete collection of gene trees) for M. persicae and all taxa included in the comparative analysis was also generated and is available for download or to browse at PhylomeDB [34]. Gene trees were scanned to infer duplications and speciation events and to derive orthology and paralogy relation-ships among homologous genes [35]. Duplication events were assigned to phylogenetic levels based on a phylos-tratigraphic approach [36] and duplication densities calculated on the branches of the species tree leading to M. persicae. In agreement with the comparative analysis
Fig. 2 M. persicae experienced greater gene loss rates (a) and stronger purifying selection in retained ancestral duplicates (b) than A. pisum. a Age distribution of duplicated genes in M. persicae and A. pisum. The number of synonymous substitutions per synonymous site (dS) was calculated between paralog pairs for M. persicae (green) and A. pisum (blue) using the YN00 [91] model in PAML [82]. For each duplicated gene, only the most recent paralog was compared. Pairwise dSwas also calculated for 1:1 orthologs between M. persicae and A. pisum (red), the peak in which corresponds to the time of speciation between the two aphid species. After filtering, 1955 M. persicae paralog pairs, 7253 A. pisum paralog pairs and 2123 1:1 orthologs were included for comparison. Mean dSof 1:1 orthologs between A. pisum and M. persicae was 0.26. b Box plots showing median dN/dSfor A. pisum and M. persicae paralog pairs that duplicated before and after speciation of the two aphid species and for 1:1 orthologs between the two species. Older duplicate genes have lower dN/dSthan recently duplicated genes (since speciation) indicating stronger purifying selection in ancestral versus recent duplicates. Additionally, older duplicate genes in M. persicae have significantly lower dN/dSthan in A. pisum (Mann–Whitney U = 1816258, M. persicae: 1348 paralog pairs, A. pisum: 3286 paralog pairs, p = < 0.00001) indicating stronger genome streamlining in M. persicae than in A. pisum. Box plots are shaded by species as in (a)
above, a high rate of duplication was observed on the branch leading to M. persicae and A. pisum and rela-tively low rate of duplication observed in M. persicae (for full methods and results, see Additional file 11).
Host transition inM. persicae involves transcriptional plasticity of aphid-specific and aphid-expanded genes that constitute gene clusters in the aphid genome
In order to examine how genetically (near) identical M. persicae clones are able to colonise divergent host species, clone O colonies were started from single fe-males and reared on B. rapa (Chinese cabbage, Brassica-ceae) and subsequently transferred to N. benthamiana (Solanaceae). The two clonally reproducing populations were reared in parallel on these plants for one year and their transcriptomes sequenced. Comparison of these transcriptomes identified 171 differentially expressed (DE) genes putatively involved in host adjustment (DEseq,
> 1.5-fold change, 10% false discovery rate (FDR); Fig. 3; Additional file 12: Table S5).
The set of differentially expressed genes was signifi-cantly enriched for genes from multigene families com-pared to the genome as a whole (126 / 171 DE versus 9331 / 18,529 genome-wide (GW), Chi-square test:χ2= 36,88, d.f. = 1, p = 6.92 × 10⁻¹⁰; Fig. 3a, c). Furthermore, many of the differentially expressed genes are from aphid-expanded or aphid-specific gene families (105 / 171 DE versus 3585 / 18,529 GW, Chi-square test:χ2= 195.62, d.f. = 1, p = 1.89 × 10−44; Fig. 3c, for detailed an-notation of all DE genes see Additional file 12: Table S5), highlighting the important role of aphid genomic novelty in M. persicae colonisation of diverse plant species. In most cases, gene families were uni-directionally regulated with 64 families upregulated on B. rapaand 36 families upregulated on N. benthamiana (Additional file 12: Table S5). Genes from only six families
Fig. 3 The set of differentially expressed genes of M. persicae clone O reared on B. rapa and N. benthamiana is enriched for (a) genes belonging to gene families with known functions, (b) tandemly duplicated genes in the M. persicae genome, (c) genes belonging to gene families expanded in aphids or unique to aphids, (d) duplicated genes before M. persicae and A. pisum diverged and (e) genes with stronger purifying selection than the genome-wide average. a–c Volcano plots of differentially expressed genes of M. persicae reared on B. rapa and N. benthamiana. Negative log2fold changes indicate upregulation on B. rapa and positive values indicate upregulation on N. benthamiana. a Differentially expressed genes from four gene families that have the highest number of differentially expressed genes are highlighted. These are: RR-2 cuticular proteins (n = 22), cathepsin B (n = 10), UDP-glucosyltransferase (n = 8) and cytochrome P450 (n = 5). b The set of differentially expressed genes is enriched for tandemly duplicated genes. c The set of differentially expressed genes is enriched for genes from families that are either significantly expanded in aphids compared to other arthropods (binomial test, main text) or are unique to aphids. d Time since most recent duplication (measured as dS) for all paralogs in the M. persicae genome compared to those differentially expressed upon host transfer. Duplicated genes implicated in host adjustment (at least one of the pair differentially expressed) have a significantly different distribution to the genome wide average (p < 0.05, permutation test of equality) and are enriched for genes that duplicated before M. persicae and A. pisum diverged. e dN/dSdistribution for duplicated genes differentially expressed upon host transfer vs. the genome wide average. Duplicated genes involved in host adjustment are under significantly stronger purifying selection than the genome wide average (median dN/dS= 0.2618 vs. 0.3338, Mann–Whitney U = 105,470, p = 1.47 × 10⁻⁴, two-tailed)
were bi-directionally regulated on the plant hosts. Of these, multiple genes of the UDP-glycosyltransferases, maltase-like, P450 monooxygenases and facilitated trehalose transporter Tret1-like were upregulated on B. rapa and single genes in each of these families on N. benthamiana (Additional file 12: Table S5).
The cathepsin B cysteine protease and Rebers and Rid-diford subgroup 2 (RR-2) cuticular protein [37] families, which have the highest number genes differentially expressed upon host transfer (Fig. 3a), typify the way M. persicaegene families respond to host transfer. Members of these families are uni-directionally regulated, with Ca-thepsin B genes upregulated in aphids reared on B. rapa and RR-2 cuticular proteins upregulated in aphids reared on N. benthamiana. Further annotation of the cathepsin B and RR-2 cuticular protein genes and phylogenetic analyses including other hemipteran species reveals that differentially expressed genes from these families cluster together in aphid-expanded and, in the case of cathepsin B, M. persicae-expanded clades (Fig. 4a; Additional file 13: Figure S5A). We also found that cathepsin B and RR-2 cuticular proteins regulated in response to host change are clustered together in the M. persicae genome with differentially expressed members forming tandem ar-rays within scaffolds (Fig. 4b and Additional file 13: Figure S5B). Differentially expressed UDP-glycosyltransferase, P450 monooxygenases and lipase-like are also arranged as tandem repeats (Additional file 14: Figure S6, Additional file 15: Figure S7 and Additional file 16: Figure S8) and, more generally, tandemly duplicated genes were over-represented among the differentially expressed genes (65 / 171 DE versus 1111 / 18,529 GW, Chi-square test,χ2
= 314.66, d.f. = 1, p = 2.10 × 10−70; Fig. 3b) highlighting the tendency of genes regulated in response to host change to be clustered in the M. persicae genome.
In many parasites, recent, lineage-specific, gene family expansions have been implicated in host range expansion and transitions to generalism, for example in the nematode genus Strongyloides [38] and the ascomycete genus Metar-hizium [39]. We therefore tested for the presence of recently duplicated genes involved in M. persicae host col-onisation (differentially expressed on host transfer) by esti-mating the coalescence times of these genes and comparing them to the aphid phylogeny. Contrary to our expectations, the analysis of pairwise substitution patterns between dupli-cated differentially expressed genes and their closest paralog show that these genes are older than the genome-wide average, with the differentially expressed gene set enriched for gene duplicates that arose before the divergence of M. persicaeand A. pisum (paralog pairs dS0.26–2.00: DE
du-plicated = 75 / 97, whole genome = 1348 / 2414, Chi-square test: χ2= 15.87, d.f. = 1, p = 6.79 × 10⁻⁵) (Fig. 3d). In addition, we found that host-regulated genes appear to be under stronger purifying selection than the genome-wide
average with paralog pairs containing at least one differen-tially expressed gene having median dN/dS significantly
lower than for all paralog pairs in the genome (median dN/
dS= 0.2618 versus 0.3338, Mann–Whitney U = 105,470, p
= 1.47 × 10⁻⁴) (Fig. 3e, Additional file 17: Table S6). This suggests that most of the genetic variation utilised during host colonisation was present in the common ancestor of the two aphid species and, hence, Myzus-specific gene du-plication per se does not represent the evolutionary innovation that enables a generalist lifestyle.
Gene expression changes upon host transfer occur rapidly
To further investigate gene expression plasticity in M. per-sicaeupon transfer to diverged hosts, we investigated dif-ferential gene expression of aphids transferred from B. rapato N. benthamiana and allowed adjustment on their new hosts for seven weeks, this time also including a transfer from B. rapa to Arabidopsis thaliana. M. persicae clone O successfully colonised all three host species with no significant differences observed in survival and reproduction rates, weight, development time and longev-ity (Additional file 18: Figure S9A). This is in contrast to an A. pisum biotype collected from the legume Pisum sativumthat had significantly reduced reproduction rates and increased developmental time and overall lower fit-ness on two other legume species (Medicago truncatula, Vicia villosa) compared to the‘universal’ host (Vicia faba), which can be colonised by many pea biotypes [40]. We analysed the differential expression of M. persicae clone O cathepsin B and RR-2 cuticular protein genes by quantita-tive real-time polymerase chain reaction (qRT-PCR) to as-sess if the upregulation and downregulation of these genes upon a host switch can be confirmed by a method other than RNA-seq and to develop an assay that can be used for analyses of differential gene expression in single aphids (see next step). All differentially expressed cathepsin B and RR-2 cuticular protein genes in the RNA-seq experi-ments for which specific primers could be designed (the majority) were also differentially expressed in the qRT-PCR experiments. Furthermore, we find similar expression patterns for aphids reared on Brassicaceae species with ca-thepsin B copies upregulated on B. rapa and A. thaliana relative to N. benthamiana (Fig. 4c) and RR-2 cuticular proteins downregulated (Additional file 13: Figure S5C).
To investigate the speed of gene expression change upon host transfer, individual aphids (three-day-old nymphs) were transferred from A. thaliana to N. benthamiana and vice versa, or to the same host, and expression of cathepsin B and RR-2 cuticular protein genes measured after two days by qRT-PCR. Survival rates of the nymphs upon transfer to a different plant species was over 60% and the reproduction rates of these surviving aphids were similar to the aphids that did not experience a host change (Additional file 18: Figure
S9B). In contrast, the A. pisum P. sativum biotype had a remarkable reduction in reproduction rates upon host change to the three legume plants M. truncatula, Vicia villosa and M. sativa and this aphid did not establish stable colonies on the latter legume [40]. Cathepsin B
gene expression went up in M. persicae transferred from N. benthamiana to A. thaliana and down in aphids transferred from A. thaliana to N. benthamiana (Fig. 4d, e). Conversely, expression of RR-2 cuticular protein genes went down in aphids transferred from N.
Fig. 4 Cathepsin B genes that are differentially expressed upon M. persicae host change belong predominantly to a single aphid-expanded clade and form gene clusters in the M. persicae genome. a Maximum likelihood phylogenic tree of arthropod cathepsin B protein sequences. The sequences were aligned with Muscle [76] and the phylogeny estimated using FastTree [92] (JTT + CAT rate variation). Circles on branches indicate SH-like local support values >80%, scale bar below indicates 0.1 substitutions per site. Rings from outside to inside: ring 1, M. persicae cathepsin B (MpCathB) gene identities (IDs) with numbers in red indicating upregulation of these genes in M. persicae reared for one year on B. rapa relative to those reared for one year on N. benthamiana and bold font indicating location on the cathepsin B multigene clusters shown in (b); ring 2, red squares indicating MpCathB genes that are differentially expressed upon M. persicae host change; ring 3, cathB genes from different arthropods following the colour scheme of the legend in the upper left corner and matching the colours of the branches of the phylogenetic tree; ring 4, aphid-expanded (AE) clades with AE_Clade I labelled light green and AE_Clade II light blue. b MpCathB multigene clusters of the M. persicae genome. Lines indicate the genomic scaffolds on which the MpCathB genes are indicated with block arrows. Gene IDs above the genes match those of the phylogenetic tree in A, with block arrows and fonts highlighted in red being differentially expressed upon host change. Scale bar on right shows 1 kb. c Relative expression levels of MpCathB genes of M. persicae at seven weeks being reared on N. benthamiana (Nb), B. rapa (Br) and A. thaliana (At). Numbers under the graphs indicate MpCathB gene IDs with those in red font DE as in (a). Batches of five adult females were harvested for RNA extraction and quantitative real-time polymerase chain reaction assays. Bars represent expression values (mean ± standard deviation (SD)) of three independent biological replicates. *p < 0.05 (ANOVA with Fishers LSD to control for multiple tests). d As in (c), except that individual aphids reared on At were transferred to At (At to At) or Nb (At to Nb) and harvested at two days upon transfer. e As in (d), except that individual aphids reared on Nb were transferred to Nb (Nb to Nb) or At (Nb to At) and harvested at two days upon transfer
benthamianato A. thaliana and up in aphids transferred from A. thaliana to N. benthamiana (Additional file 13: Figure S5D, E). No significant change was observed when aphids were transferred to the same plant species (from A. thaliana to A. thaliana or N. benthamiana to N. benthamiana). Hence, expression levels of cathepsin B and RR-2 cuticular protein genes adjust quickly upon host change (within two days) and are regulated in a co-herent, host-dependent fashion.
Cathepsin B contributes toM. persicae fitness in a host-dependent manner
To test whether targets of transcriptional plasticity in M. persicae have direct fitness affects, we conducted plant-mediated RNAi knockdown [41, 42] of cathepsin B genes identified as differentially expressed upon host transfer. We focused on cathepsin B as the majority (11 out of 12) of gene copies differentially expressed upon host transfer are located in a single, M. persicae ex-panded clade (Cath_Clade I) of the cathepsin B phyl-ogeny (Fig. 4a) and have 69–99% nucleotide sequence identities to one another (Additional file 19). As such, a single dsRNA construct can be used to knock down multiple cathepsin B genes. In contrast, the clade con-taining the majority of differentially regulated RR-2 cu-ticular protein genes is larger and more diverse (Additional file 13: Figure S5), presenting a challenge for using the RNAi-mediated approach to examine how these genes act together to enable M. persicae colonisa-tion. Three independent stable transgenic A. thaliana lines producing dsRNAs targeting multiple cathepsin B genes (At_dsCathB 5–1, 17–5 and 18–2; Additional file 19) were generated. The expression levels of all Cath_-Clade I genes except MpCath12 were downregulated in M. persicae reared on these lines (Fig. 5a) in agreement with MpCath12 having the lowest identity to the dsRNA sequence (73% versus > 77% for other copies) (Additional file 19). Aphids on the three At_dsCathB lines produced about 25% fewer progeny (p < 0.05) compared to those reared on the At_dsGFP control plants (Fig. 5b) indicat-ing that the cathepsin B genes contribute to M. persicae ability to colonise A. thaliana.
To examine the impact of cathepsin B on the ability of M. persicae to adjust to host change, the cathB-RNAi aphids were transferred from At_dsCathB lines to non-transgenic A. thaliana and N. benthamiana plants and ex-amined for survival and fecundity. In agreement with pre-vious data [42], we found that the genes targeted by RNAi remain downregulated at two days upon transfer from At_dsCathB lines to non-transgenic plants (Additional file 20: Figure S10). Upon transfer to A. thaliana, the cathB-RNAi aphids had lower survival and reproduction rates than the dsGFP-exposed (control) aphids (Fig. 5c, e). In contrast, no decline in survival and reproduction was seen
of the cathB-RNAi aphids compared to the dsGFP-exposed aphids upon transfer to N. benthamiana (Fig. 5d, f ). Thus, cathB knock down impacts M. persicae fitness differentially depending on the host plant species. To-gether these data provide evidence that adjustment of the cathepsin B gene expression levels between A. thaliana and N. benthamiana contributes to the ability of M. persi-caeto colonise both plant species.
Discussion
So far, genomic studies of polyphagy and generalism have primarily focused on genetic adaptation and have led to the identification of specific genetic elements that are present in the genomes of one race (or biotype) ver-sus another and that enable these races to be host-specific [13, 15, 28]. In such cases, while the species as a whole may be considered polyphagous, individuals are not. Here we have investigated the genome and tran-scriptome of the genuine generalist M. persicae. We demonstrate the striking ability of M. persicae to colon-ise divergent host plant species by conducting host transfer experiments using individuals from a single, clonally reproducing line (Clone O) and allowing them to adjust to three distinct host plant species from two plant families. We show that generalism in M. persicae is associated with rapid transcriptional plasticity of often aphid-specific gene copies from multi-gene families that are uni-directionally regulated. Furthermore, we show that disrupting the transcriptional adjustment of a gene family with high levels of differential expression upon host transfer (cathepsin B), using plant-mediated RNAi, has host-dependent fitness costs for M. persicae, sug-gesting that host-associated transcriptional plasticity is adaptive in M. persicae. Differential gene expression upon host transfer has also been observed in the legume specialist A. pisum [40, 43]. However, host switching in A. pisum is restricted to Fabaceae and successful transi-tions are only possible between a common host (Vicia faba) shared among all A. pisum biotypes and a second host, specific to each genetic lineage. Our results go further than these previous studies, directly linking gene expression differences to host dependent fitness benefits, demonstrating the importance of transcriptional plasti-city in the generalist feeding habit of M. persicae.
Contrary to expectations, the majority of genes differen-tially regulated upon host transfer originate from ancestral aphid duplication events rather than more recent lineage-specific duplications. Additionally, comparative analysis of all M. persicae gene families with other arthropods showed that, while gene family evolution appears to have been highly dynamic during aphid diversification, M. per-sicaedoes not exhibit widespread gene duplication on the scale of the legume specialist A. pisum. This is surprising given that other studies have shown a key role for
lineage-specific gene duplication in parasite host range expansions [38, 39]. Although not extensive, recent gene duplication may still play a role in M. persicae host adaptation given that some gene families have undergone M. persicae-specific gene duplication against a background of reduced gene family expansion genome-wide. For example, the cathepsin B and UGT gene families have undergone M. persicae-specific gene duplication and are implicated in host adjustment. These observations are consistent with genome streamlining in M. persicae, with functionally important gene duplicates preferentially retained. It there-fore seems likely that functionally important lineage-specific gene duplication combined with rapid transcrip-tional plasticity of a broader, aphid-specific gene reper-toire, consisting of selectively retained gene duplicates, contributes to the generalist feeding habit in M. persicae.
Transcriptional plasticity has also been implicated in host adjustment in generalist spider mite and butterfly
species [44, 45]. This suggests a key role for transcrip-tional plasticity in plant-feeding arthropods that have evolved genuine generalism as opposed to cryptic sub-structuring of genetic variation by host species. The mechanisms by which this transcriptional plasticity is achieved are, as yet, unknown. However, given that in M. persicae differences in gene expression occur rap-idly upon host transfer, and in the absence of genetic variation between host-adjusted lineages (experiments were performed with single aphids in the two-day transfer experiments and with clonally reproducing individuals derived from a single parthenogenetic female in the seven-week and one-year aphid col-onies), epigenetic mechanisms of gene expression regulation are likely responsible. Full length copies of the DNA methyltransferase (DNMT) genes DNMT1a, DNMT1b, DNTM2, DNMT3a and DNMT3b and all components of the histone modification system are
Fig. 5 RNAi-mediated knock-down of the expression of multiple cathepsin B genes reduces M. persicae survival and fecundity on A. thaliana. a Relative cathepsin B (CathB) expression levels (compared to aphids on dsGFP (control) plants) of M. persicae on three independent transgenic lines (lines 5–1, 17–5 and 18–2) producing double-stranded (ds) RNA corresponding to multiple M. persicae cathepsin B genes (dsCathB) (Fig. 3a, Add-itional file 20: Figure S10). Aphids were reared on the transgenic lines for four generations. Batches of five adult females were harvested for RNA extraction and qRT-PCR assays. Bars represent expression values (mean ± standard deviation (SD)) of three independent biological replicates. b CathB-RNAi M. persicae produces less progeny compared to control (dsGFP-treated) aphids on A. thaliana. Five nymphs were transferred to single plants and produced nymphs on approximately day 5. Nymph counts were conducted on days 7, 9 and 11 and removed. Columns show the mean ± SD of the total nymph counts for these three days of three biological replicates, with each replicate consisting nymphs produced by 15 aphids at five aphids per plant (n = 3 plants). c, d Survival rates of CathB-RNAi and control (dsGFP-exposed) M persicae on non-transgenic A. thali-ana (At) and N. benthamithali-ana (Nb) plants. Ten third instar nymphs on dsCathB and dsGFP transgenic plants were transferred to non-transgenic plants; survival rates were recorded two days later. Bars represent mean ± SD of three biological replicates, with each replicate consisting of the survival rates of 30 aphids at 10 aphids per plants (n = 3 plants). e, f Fecundity rates of CathB-RNAi and control (dsGFP-exposed) M. persicae on non-transgenic A. thaliana (At) and N. benthamiana (Nb) plants. Nymph counts were conducted as in (b). Asterisks (*) and different letters (a, b) above the bars indicate significant difference at p < 0.05 (ANOVA with Fisher’s LSD to control for multiple tests)
present in M. persicae, as is the case for other aphid species [29, 46, 47], and epigenetic mechanisms have been shown to regulate plastic traits such as hymen-opteran caste-specific behaviour [48].
Genes belonging to aphid-expanded clades of the cathepsin B and RR-2 cuticular protein gene families contribute the largest percentages of differentially reg-ulated genes upon host transfer and are therefore likely to play a key role in the ability of M. persicae to colonise members of Brassicaceae and Solanaceae. Ca-thepsin B proteins may serve digestive functions [49, 50], but are also known virulence factors, as they play major roles in invasion and intracellular survival of a number of pathogenic parasites [50–53]. For example, RNAi-mediated knock down of Trypanosoma brucei cathepsin B leads to clearance of parasites from the bloodstream and prevents lethal infection in mice [54]. In the social aphid Tuberaphis styraci, cathepsin B has been detected as a major component of the venom produced by soldier aphids which is expelled through the stylets and injected into potential preda-tors [55]. In M. persicae, three of the differentially expressed cathepsin B genes encode proteins with sig-nal peptides, are expressed in the M. persicae salivary gland [23] and peptides corresponding to cathepsin B are found in proteome analyses of M. persicae saliva [56], suggesting they come into direct contact with plant components during feeding. Interestingly, ca-thepsin B genes involved in host adjustment have functionally diverged in M. persicae relative to other aphid species. Most of the differentially expressed ca-thepsin B genes belong to Cath_Clade_I, which has expanded in M. persicae relative to A. pisum and D. noxia (Fig. 4a). Functional analysis of genes in this clade shows that most M. persicae copies possess a complete cysteine peptidase domain consisting of a propeptide domain and both cysteine and histidine ac-tive sites. In contrast, most A. pisum and D. noxia copies have an incomplete cysteine peptidase domain (Additional file 21: Figure S11). This is in agreement with previous observations that cathepsin B genes are under selection in aphids [57]. Our finding that ca-thepsin B genes are differentially regulated in response to M. persicae host transfer and that knock down of functionally diverged differentially expressed cathepsin B copies directly impacts M. persicae fitness in a host-dependent manner highlights the key role of this gene family in aphid evolution.
Cuticular proteins bind chitin via extended version of the RR-1 and RR-2 consensus sequences and provide the cuticle with structural support, mechanical protec-tion and mobility [58]. Cuticular protein genes have different expression profiles depending on the insect body part, mechanical property needs, developmental
stage, temperature and seasonal photoperiodism [59– 62]. RR-1 proteins are associated mostly with soft and flexible cuticle and RR-2 proteins in hard and rigid cu-ticles [63, 64]. Members of the differentially regulated RR-2 cuticular proteins of M. persicae on different plant hosts have identical sequences as those shown to be associated with the acrostyle at the tip (last few mi-crons) of the maxillary stylets of the M. persicae mouthparts where the food canal and salivary canals are fused [65]. The acrostyle is in the part of the stylet that performs intracellular punctures during probing and phloem feeding [66] and has a high concentration of cuticular proteins. It also interacts with virus parti-cles that are transmitted by M. persicae [65]. Moreover, it is in direct contact with (effector) proteins of the aphid saliva and the plant cell contents, including the phloem sap [66]. Therefore, it is possible that the differ-ential regulation of RR-2 cuticular protein genes en-ables M. persicae to adjust to the different physical and chemical attributes of cell walls, their contents and de-fence responses of the diverged plant species.
Conclusions
We found that M. persicae adjustment to diverged plant species involves the unidirectional co-regulation of mul-tigene families that lie within distinct multi-gene clusters in the aphid genome. Differential expression of cathepsin B and RR-2 cuticular protein genes occurs rapidly, within two days, indicating strict regulatory control of these gene clusters. Furthermore, upregulation of aphid-specific cathepsin B gene copies enables M. persicae sur-vival and fecundity on the new host. Taken together, this study of the genome sequence of M. persicae, compara-tive genome analyses and experimental study of host change have identified specific genes that are involved in the ability of M. persicae to colonise members of the Brassicaceae and has provided evidence that the rapid transcriptional plasticity of M. persicae plays a role in this aphid’s ability to adjust to diverged plant species.
Methods
Preparation ofM. persicae clones G006 and O for genome
sequencing
Clone G006 was collected from pepper in Geneva, NY, USA in 2003 [23]. Since the time of collection, G006 has been maintained on Brassica oleracea var. Wisconsin golden acre seedlings in a growth chamber under long day conditions of 16 h light: 8 h of darkness at 20 °C constant temperature in the laboratory of Alexandra Wilson, University of Miami. Clone O is found on mul-tiple crop and weed species in the UK and France [20, J. C. Simon, personal communication]. A colony of M. persicae clone O starting from a single female was established on Chinese cabbage (B. rapa) in a growth
chamber (14 h light, 10 h dark at constant 20 °C, 75% humidity) in 2010. The clone was subsequently reared on B. rapa (Brassicaceae), A. thaliana (Brassicaceae) and N. benthamiana(Solanaceae) in the laboratory.
Genome sequencing
A single paired-end library and two mate-pair libraries were constructed for the G006 clone with insert sizes of approximately 200 (S6), 2000 (S8 MPB) and 5000 (S7 MPA) bp and sequenced with 100 bp paired-end run metrics using a version 3 Illumina Hi-Seq paired-end flow cell to give ~95 Gb of sequencing reads. Illumina library construction and sequencing for clone G006 was performed at the University of Miami’s Center for Genome Sequencing Core at the Hussman Institute for Human Genomics.
For the Clone O genome, three libraries were con-structed, two paired-end libraries with an average fragment size of 380 (LIB1672) and 180 (LIB1673) bp and for scaffolding a mate-pair library with an average 8000 bp insert size (LIB1472). Libraries were prepared at the Earlham Institute (Norwich, UK) using the Illumina TruSeq DNA Sample Preparation Kit. The resulting DNA libraries were sequenced with 100 bp paired-end run metrics on a single lane of an Illumina HiSeq2000 Sequencing System according to manufac-turer’s instructions.
Transcriptome sequencing
To aid gene annotation, total RNA was extracted from M. persicaeclone G006 whole female insects (WI), bac-teriocytes (dissected from 300 adults) and guts (dissected from 300 adults). All RNA was treated with DNaseI be-fore sending for sequencing at the University of Miami’s Center for Genome Sequencing Core at the Hussman Institute for Human Genomics. Each sample was pre-pared for messenger RNA (mRNA) sequencing using an Epicenter PolyA ScriptSeqV2 kit. All sequencing was performed as 2 × 100 reads on a HiSeq 2000. Addition-ally, a directional library was constructed with RNA iso-lated from a mixture of M. persicae clone O asexual females at various developmental stages. Libraries were generated following the strand-specific RNA-seq method published by The Broad Institute [67] and sequenced to 100 bp on a paired-end flow cell on the Illumina HiSeq2000 (Illumina, USA).
To identify genes involved in M. persicae host adjust-ment, we sequenced the transcriptomes of clone O col-onies reared on B. rapa and N. benthamiana. Colcol-onies were established from a single asexual female and reared under long-day conditions (14 h light, 10 h dark) and constant 20 °C and allowed to adapt for one year. Adult asexual females (one-week-old) were then har-vested in pools of approximately 50 individuals. Three
independent pools were harvested from each plant spe-cies and RNA extracted using Tri-reagent (Sigma) followed by DNAse digestion (Promega) and purifica-tion using the RNeasy kit (Qiagen). Samples were sent for sequencing at the Earlham Institute (Norwich, UK) where 1 ug of RNA was purified to extract mRNA with a poly-A pull down and six non-orientated libraries (LIB949-LIB954) constructed using the Illumina TruSeq RNA Library Preparation kit following manufacturer’s instructions. After complementary DNA (cDNA) syn-thesis, ten cycles of PCR were performed to amplify the fragments. Libraries were then pooled and sequenced on a single HiSeq 2000 lane generating 100 bp paired-end sequences. Details of all transcriptomic libraries generated for this study are given in Additional file 22: Table S7.
Construction of a small RNA library ofM. persicae
RNA was extracted from 450 M. persicae nymphs using Tri-Reagent (Sigma). A small RNA library was prepared following the Illumina Small RNA v1.5 Sample Prepar-ation protocol (Illumina Inc, San Diego, CA, USA). Ligation of the 5’ and 3’ RNA adapters were conducted with 1μg RNA according to the manufacturer’s instruc-tions (except that PCR was performed with 10 mM dNTP in a 25 μL reaction). Following ligation of the 5’ and 3’ RNA adapters, cDNA synthesis and PCR amplifi-cation, fragments corresponding to adapter-sRNA-adapter ligations (93–100 bp) were excised from poly-acrylamide gels and eluted using the manufacturer’s in-structions. Sequencing was performed at The Sainsbury Laboratory (TSL, Norwich, UK) for 36 nt single-end se-quencing on an Illumina Genome Analyzer.
Genome assembly and annotation
Full details of genome assembly, annotation and quality control are given in Additional file 2. Briefly, the ge-nomes of M. persicae clones G006 and clone O were independently assembled using a combination of short insert paired-end and mate-pair libraries (Additional file 1: Table S1). Clone G006 was assembled with ALLPATHS-LG [68] and Clone O with ABySS [69] followed by scaffolding with SPPACE [70] and gapclos-ing with SOAP GapCloser [71]. Repetitive elements were annotated in both genomes with the REPET pack-age (v2.0). We then predicted protein-coding genes for each genome using the AUGUSTUS [72] and Maker [73] gene annotation pipelines using protein, cDNA and RNA-seq alignments as evidence. A set of inte-grated gene models was derived from the AUGUSTUS and Maker gene predictions, along with the transcrip-tome and protein alignments, using EVidenceModeler [74]. Splice variants and UTR features were then added to the integrated EVidenceModeler predicted gene set
using PASA [75]. Following these automatic gene an-notation steps, manual anan-notation was performed for genes involved metabolism pathways and a subset of gene families implicated in host adjustment (Add-itional files 3, 23, 24, 25, 26, 27, 28, 29 and 30).
Gene family clustering
To investigate gene family evolution across arthro-pods, we compiled a comprehensive set of proteomes for 17 insect lineages plus the branchiopod outgroup Daphnia pulex and the spider mite Tetranychus urti-cae and combined them with the proteomes of the two newly sequenced M. persicae clones. In total, 22 arthropod proteomes were included with all major in-sect lineages with publicly available genome sequences represented (Additional file 31: Table S16). In cases where proteomes contained multiple transcripts per gene the transcript with the longest CDS was se-lected. Although both M. persicae clones were in-cluded for clustering, comparisons between species were made using the G006 reference only. Putative gene families within our set of proteomes were identi-fied based on Markov clustering of an all-against-all BLASTP search using the MCL v.12.068 [30]. Blast hits were retained for clustering if they had an E-value less than 1e−5 and if the pair of sequences aligned over at least 50% of the longest sequence in the pair. MCL was then run on the filtered blast hits with an inflation parameter of 2.1 and filtering scheme 6.
To estimate species phylogeny, protein sequences for 66 single-copy conserved orthologs were ex-tracted. For each gene, proteins were aligned using muscle v. 3.8.31 [76] followed by removal of poorly aligned regions with trimAl v. 1.2 [77]. The curated alignments were then concatenated into a superma-trix. Phylogenetic relationships were estimated using maximum likelihood (ML) in RAxML v.8.0.23 [31]. The supermatrix alignment was partitioned by gene and RAxML was run with automatic amino acid sub-stitution model selection and gamma distributed rate variation for each partition. One hundred rapid boot-strap replicates were carried out followed by a thor-ough ML tree search. As the focus of the present study is not on estimating absolute dates of diver-gence, we used RelTime [32] to estimate relative di-vergence times using the RAxML topology. RelTime has been shown to give relative dates of divergence that are well correlated with absolute divergence times derived from the most advanced Bayesian dating methods[32]. RelTime was run with an LG model of protein evolution and the few clocks option (clocks merged on 2 std. errors), treating the supermatrix as a single parition.
Analysis of gene family evolution
Gene family evolution across arthropods was investi-gated using CAFE v.3.0 [78]. CAFE models the evolu-tion of gene family size across a species phylogeny under a ML birth–death model of gene gain and loss and simultaneously reconstructs ML ancestral gene family sizes for all internal nodes, allowing the detec-tion of expanded gene families within lineages. We ran CAFE on our matrix of gene family sizes gener-ated by MCL under a birth–death model of gene family evolution and modelled their evolution along the RelTime species tree. CAFE assumes that gene families are present in the last common ancestor of all species included in the analysis. To avoid biases in estimates of the rate of gene gain and loss, we there-fore removed gene families not inferred to be present in the last common ancestor of all taxa in the ana-lysis based on maximum parsimony reconstruction of gene family presence/absence. Initial runs of CAFE produced infinite likelihood scores due to very large changes in family size for some gene families. We therefore excluded gene families where copy number varied between species by more than 200 genes. In total 4983 conserved gene families were included for analysis. To investigate variation in the rate of gene birth and death (λ) across the arthropod phylogeny we tested a series of nested, increasingly complex, models of gene family evolution using likelihood ratio tests [79]. Models tested ranged from one with a single λ parameter across the whole phylogeny to a model with separate λ parameters for each of the major arthropod groups and a separate rate for each aphid species (Additional file 32: Table S17). For a more complex model to be considered an improve-ment a significant increase in likelihood had to be observed (likelihood ratio test, p < 0.05). For the best fitting model of gene family evolution (‘clade-specific rates’, Additional file 33: Table S18), the average per gene family expansion and the number of expanded families were compared for each taxon included in the analysis. To correct for evolutionary divergence between taxa, average per gene family expansion and the number of expanded gene families were normalised for each taxon by dividing by the rela-tive divergence time from the MRCA of the taxon in question (RelTime tree, branch length from tip to first node).
Aphid gene duplication history and patterns of molecular evolution
To investigate the history of gene duplication in aphids, we reconstructed the complete set of duplicated genes (para-logs) in M. persicae and A. pisum and calculated the rates of synonymous substitution per synonymous site (dS) and
non-synonymous substitution per non-synonymous site (dN) between each duplicated gene and its most recent
paralog. We then created age distributions for duplicate genes in the two aphid genomes based on dS values
be-tween paralogs and compared rates of evolution based on dN/dSratios. Larger values of dSrepresent older duplication
events and the dN/dSratio reflects the strength and type of
selection acting on the sequences. Paralog pairs were identi-fied by conducting an all-against-all protein similarity search with BLASTP on the proteome of each species with an E-value cutoff of e−10. When multiple transcripts of a gene were present in the proteome the sequence with the longest CDS was used. Paralogous gene pairs were retained if they aligned over at least 150 amino acids with a mini-mum of 30% identity [80]. For each protein, only the near-est paralog was retained (highnear-est scoring BLASTP hit, excluding self-hits) and reciprocal hits were removed to create a non-redundant set of paralog pairs. For each para-log pair, a protein alignment was generated with muscle v. 3.8.31 [76]. These alignments were then used to guide codon alignments of the CDS of each paralog pair using PAL2NAL [81]. From these codon alignments, pairwise dN
and dS values were calculated with paml v4.4 using YN00
[82]. Paralog pairs with dS> 2 were excluded from our
ana-lysis as they likely suffer from saturation. For the generation of age distributions, we used all gene pairs that passed our alignment criteria. For comparisons of rates of evolution (dN/dS), we applied strict filtering criteria to avoid
inaccur-ate dN/dS estimates caused by insufficiently diverged
se-quences; pairs were removed if they had dNor dSless than
0.01 and fewer than 50 synonymous sites. We also calcu-lated pairwise dNand dSfor 1:1 orthologs between M.
persi-caeand A. pisum (extracted from the MCL gene families). This allowed us to separate duplicated genes into‘old’ (be-fore speciation) and‘young’ (after speciation) categories de-pending on whether dS between a paralog pair was larger
or smaller than the mean dS between 1:1 orthologs which
corresponds to the time of speciation between the two aphid species. Adding 1:1 orthologs also allowed us to compare rates of evolution (dN/dS) between single-copy
and duplicated genes. In addition to the pipeline above, we also identified tandemly duplicated genes in the M. persicae genome using MCSscanX [83].
RNA-seq analysis ofM. persicae clone O colonies on different plant species
To identify genes involved in M. persicae host adjustment, we compared the transcriptomes of clone O colonies reared on either B. rapa or N. benthamiana for one year (LIB949 – LIB954, Additional file 22: Table S7). Reads were quality filtered using sickle v1.2 [84] with reads trimmed if their quality fell to below 20 and removed if their length fell to less than 60 bp. The remaining reads were mapped to the G006 reference genome with Bowtie v1.0 [85] and per gene
expression levels estimated probabilistically with RSEM v1.2.8 [86]. We identified differentially expressed genes with DEseq [87] using per gene expected counts for each sample generated by RSEM. To increase statistical power to detect differentially expressed genes, lowly expressed genes falling into the lowest 40% quantile were removed from the ana-lysis. Genes were considered differentially expressed be-tween the two treatments if they had a significant p value after accounting for a 10% FDR according to the Benja-mini–Hochberg procedure and if a fold change in expres-sion of at least a 1.5 was observed. To assess the impact of genome assembly and annotation on our results we also re-peated the analysis mapping to clone O rather than G006. This resulted in a similar number of differentially expressed genes (171 versus 179) and the same top four gene families with the most members differentially expressed (Additional file 34: Table S19).
qRT-PCR analyses
Total RNA was isolated from adults using Trizol reagent (Invitrogen) and subsequent DNase treatment using an RNase-free DNase I (Fermentas). cDNA was synthesised from 1μg total RNA with RevertAid First Strand cDNA Synthesis Kit (Fermentas). The qRT-PCRs reactions were performed on CFX96 Touch™ Real-Time PCR Detection System using gene-specific primers (Additional file 35: Table S20). Each reaction was performed in a 20 μL re-action volume containing 10 μL SYBR Green (Fermen-tas), 0.4 μL Rox Reference Dye II, 1 μL of each primer (10 mM), 1 μL of sample cDNA and 7.6 μL UltraPure Distilled water (Invitrogen). The cycle programs were: 95 °C for 10 s, 40 cycles at 95 °C for 20 s and 60 °C for 30 s. Relative quantification was calculated using the comparative 2–△Ct method [88]. All data were normal-ised to the level of Tubulin from the same sample. De-sign of gene-specific primers were achieved by two steps. First, we used PrimerQuest Tool (Integrated DNA Technologies, IA, USA) to generate five to ten qPCR primer pairs for each gene. Then, primer pairs were aligned against cathepsin B and cuticular protein genes. Only primers aligned to unique sequences were used (Additional file 35: Table S20). Genes for which no unique primers could be designed were excluded from analyses.
Plant host switch experiments
The M. persicae clone O colony reared on B. rapa was reared from a single female and then transferred to A. thalianaand N. benthamiana and reared on these plants for at least 20 generations. Then, third instar nymphs were transferred from A. thaliana to N. benthamiana and vice versa for three days upon which the insects were harvested for RNA extractions and qRT-PCR analyses.
Cloning of dsRNA constructs and generation of transgenic plants
A fragment corresponding to the coding sequence of MpCathB4 (Additional file 19) was amplified from M. persicae cDNA by PCR with specific primers containing additional attb1 (ACAAGTTTGTACAAAAAAGCAG GCT) and attb2 linkers (ACCACTTTGTACAAGAAAG CTGGGT) (MpCathB4 attB1 and MpCathB7 attB2, Additional file 35: Table S20) for cloning with the Gateway system (Invitrogen). A 242-bp MpCathB4 fragment was introduced into pDONR207 (Invitrogen) plasmid using Gateway BP reaction and transformed into DH5α. Subse-quent clones were sequenced to verify correct size and sequence of inserts. Subsequently, the inserts were intro-duced into the pJawohl8-RNAi binary silencing vector (kindly provided by I.E. Somssich, Max Planck Institute for Plant Breeding Research, Germany) using Gateway LB reac-tion generating plasmids pJMpCathB4, which was intro-duced into A. tumefaciens strain GV3101 containing the pMP90RK helper plasmid for subsequent transformation of A. thalianausing the floral dip method [89]. Seeds obtained from the dipped plants were sown and seedlings were sprayed with phosphinothricin (BASTA) to a selection of transformants. F2 seeds were germinated on Murashige and Skoog (MS) medium supplemented with 20 mg mL BASTA for selection. F2 plants with 3:1 dead/alive segrega-tion of seedlings (evidence of single insersegrega-tion) were taken forward to the F3 stage. Seeds from F3 plants were sown on MS + BASTA and lines with 100% survival ratio (homozy-gous) were selected. The presence of pJMpCathB4 trans-genes was confirmed by PCR and sequencing. Three independent pJMpCathB4 transgenic lines were taken for-ward for experiments with aphids. These were At_dsCathB 5–1, 17–5 and 18–2.
To assess if the 242-bp MpCathB4 fragment targets se-quences beyond cathepsin B genes, 242-bp sequence was blastn-searched against the M. persicae clones G006 and O predicted transcripts at AphidBase and cutoff e-value of 0.01. The sequence aligned to nucleotide sequences of MpCathB1 to B13 and MpCathB17 with the best aligned for MpCathB4 (241/242, 99% identity) and lowest score for MpCathB17 (74/106, 69% identity) (Additional file 19). M. persicaefed on At_dsCathB 5–1, 17–5 and 18–2 transgenic lines had lower transcript levels of AtCathB1 to B11, whereas that of MpCathB12 was not reduced (Fig. 4.1a). Identity percentages of the 242-bp fragment to AtCathB1 to B11 range from 99% to 77%, whereas that of MpCathB12 is 73% (Additional file 19). Thus, identity scores higher than 73–77% are needed to obtain effective RNAi-mediated transcript reduction in M. persicae.
Plant-mediated RNAi of GPA cathepsin B genes
Seed of the pJMpCathB4 homozygous lines (expressing dsRNA corresponding to Cathepsin B, dsCathB, Additional
file 19) was sown and seedlings were transferred to single pots (10 cm diameter) and transferred to an environmental growth room at temperature 18 °C day/16 °C night under 8 h of light. The aphids were reared for four generations on A. thaliana transgenic plants producing dsGFP (controls) and dsCathB. Five M. persicae adults were confined to single four-week-old A. thaliana lines in sealed experimen-tal cages (15.5 cm diameter and 15.5 cm height) containing the entire plant. Two days later adults were removed and five nymphs remained on the plants. The number of offspring produced on the 10th, 14th and 16th days of the experiment were counted and removed. This experiment was repeated three times to create data from three independent biological replicates with four plants per line per replicate.
Additional files
Additional file 1: Table S1. Summary of libraries generated and datasets used for assembly of the genomes of Myzus persicae clones G006 and O. (XLSX 35 kb)
Additional file 2: Supplementary Text: Genome assembly, annotation and quality control. (DOCX 2215 kb)
Additional file 3: Supplementary Text: Annotation of metabolic processes and specific gene families. (DOCX 584 kb)
Additional file 4: Table S2. MCL gene family clustering results. A Assignment of genes to MCL gene families for 22 arthropod taxa listed in Additional file 31: Table S16. Sequences are named in the format < TAXON ID > | < GENE ID>. B Size matrix showing number of genes per MCL gene family for each included taxon. (XLSX 9923 kb)
Additional file 5: Figure S1. ML phylogeny of 21 arthropod species with fully sequenced genomes based on 66 strictly conserved single-copy orthologs. Sequences were aligned with MUSCLE [76] and trimmed to remove poorly aligned regions with TrimAl [77]. The phylogeny was estimated using RAxML [30] with each gene treated as a separate parti-tion. Automatic protein model selection was implemented in RAxML with gamma distributed rate variation. Values at nodes show bootstrap sup-port based on 100 rapid bootstrap replicates carried out with RAxML. (PNG 44 kb)
Additional file 6: Figure S2. Enriched GO terms relating to biological processes of aphid-specific M. persicae genes. GO term enrichment ana-lysis was carried out using Fishers’ exact test in BINGO [93] with correc-tion for multiple testing applied by the Benjamini–Hochberg procedure allowing for a 10% FDR. GO terms from aphid-specific genes were com-pared to GO terms from the complete set of M. persicae genes. Enriched GO terms were reduced and visualised with REVIGO [94]. GO terms are clustered by semantic similarity with the size of each circle relative to the size of the GO term in UniProt (larger circles = more general GO terms) and coloured by their p values according to Fisher’s exact test of enrich-ment. A complete list of enriched GO terms for aphid-specific genes are given in Additional file 7: Table S3. (PNG 76 kb)
Additional file 7: Table S3. Over-represented GO terms in aphid-specific genes compared to the genome as a whole. Over-represented GO terms identified with BINGO [89] using Fisher’s exact test accounting for a 10% FDR. (XLSX 50 kb)
Additional file 8: Figure S3. Model based analysis of gene gain and loss across arthropods. Gene gain and loss (λ) was modelled across the arthropod phylogeny under a birth–death process with CAFE [78] for 4983 widespread gene families inferred to be present in the most recent common ancestor (MRCA) of all included taxa. Nested models with increasing numbers of lambda parameters were compared using likelihood ratio test (Additional file 32 and 33: Tables S17 and S18).