HAL Id: pasteur-01414730
https://hal-pasteur.archives-ouvertes.fr/pasteur-01414730
Submitted on 12 Dec 2016
HAL is a multi-disciplinary open access
archive for the deposit and dissemination of
sci-entific research documents, whether they are
pub-lished or not. The documents may come from
teaching and research institutions in France or
abroad, or from public or private research centers.
L’archive ouverte pluridisciplinaire HAL, est
destinée au dépôt et à la diffusion de documents
scientifiques de niveau recherche, publiés ou non,
émanant des établissements d’enseignement et de
recherche français ou étrangers, des laboratoires
publics ou privés.
Distributed under a Creative Commons Attribution| 4.0 International License
Genotypic and Phenotypic Diversity in Escherichia coli
Extraintestinal Infections
Maxime Levert, Oana Zamfir, Olivier Clermont, Odile Bouvet, Sylvain
Lespinats, Marie Claire Hipeaux, Catherine Branger, Bertrand Picard, Claude
Saint-Ruf, Françoise Norel, et al.
To cite this version:
Maxime Levert, Oana Zamfir, Olivier Clermont, Odile Bouvet, Sylvain Lespinats, et al.. Molecular
and Evolutionary Bases of Within-Patient Genotypic and Phenotypic Diversity in Escherichia coli
Extraintestinal Infections. PLoS Pathogens, Public Library of Science, 2010, 6 (9), pp.e1001125.
�10.1371/journal.ppat.1001125�. �pasteur-01414730�
Molecular and Evolutionary Bases of Within-Patient
Genotypic and Phenotypic Diversity in
Escherichia coli
Extraintestinal Infections
Maxime Levert1, Oana Zamfir1, Olivier Clermont1, Odile Bouvet1, Sylvain Lespinats1, Marie Claire Hipeaux2, Catherine Branger1,2, Bertrand Picard1, Claude Saint-Ruf3, Franc¸oise Norel4, Thierry Balliau5, Michel Zivy5, Herve´ Le Nagard6, Ste´phane Cruvellier7, Be´atrice Chane-Woon-Ming7, Susanna Nilsson8, Ivana Gudelj8, Katherine Phan9, Thomas Ferenci9, Olivier Tenaillon1, Erick Denamur1*
1 INSERM U722 and Universite´ Paris 7 Denis Diderot, Faculte´ de Me´decine, Site Xavier Bichat, Paris, France, 2 Assistance Publique - Hoˆpitaux de Paris, Hoˆpital Louis Mourier, Laboratoire de Microbiologie, Colombes, France,3 INSERM U1001 and Universite´ Paris 5 Rene´ Descartes, Faculte´ de Me´decine, Paris, France, 4 Unite´ de Ge´ne´tique Mole´culaire and CNRS URA2172, Institut Pasteur, Paris, France,5 CNRS UMR 0320/UMR8120 Ge´ne´tique Ve´ge´tale, Plate-Forme de Prote´omique PAPPSO, Gif-sur-Yvette, France,6 INSERM U738 and Universite´ Paris 7 Denis Diderot, Faculte´ de Me´decine, Site Xavier Bichat, Paris, France, 7 Laboratoire de Ge´nomique Comparative, CNRS UMR8030, Institut de Ge´nomique, CEA, Genoscope, Evry, France,8 Department of Mathematics, Imperial College, London, United Kingdom, 9 School of Molecular Bioscience, University of Sydney, Sydney, New South Wales, Australia
Abstract
Although polymicrobial infections, caused by combinations of viruses, bacteria, fungi and parasites, are being recognised with increasing frequency, little is known about the occurrence of within-species diversity in bacterial infections and the molecular and evolutionary bases of this diversity. We used multiple approaches to study the genomic and phenotypic diversity among 226 Escherichia coli isolates from deep and closed visceral infections occurring in 19 patients. We observed genomic variability among isolates from the same site within 11 patients. This diversity was of two types, as patients were infected either by several distinct E. coli clones (4 patients) or by members of a single clone that exhibit micro-heterogeneity (11 patients); both types of diversity were present in 4 patients. A surprisingly wide continuum of antibiotic resistance, outer membrane permeability, growth rate, stress resistance, red dry and rough morphotype characteristics and virulence properties were present within the isolates of single clones in 8 of the 11 patients showing genomic micro-heterogeneity. Many of the observed phenotypic differences within clones affected the trade-off between self-preservation and nutritional competence (SPANC). We showed in 3 patients that this phenotypic variability was associated with distinct levels of RpoS in co-existing isolates. Genome mutational analysis and global proteomic comparisons in isolates from a patient revealed a star-like relationship of changes amongst clonally diverging isolates. A mathematical model demonstrated that multiple genotypes with distinct RpoS levels can co-exist as a result of the SPANC trade-off. In the cases involving infection by a single clone, we present several lines of evidence to suggest diversification during the infectious process rather than an infection by multiple isolates exhibiting a micro-heterogeneity. Our results suggest that bacteria are subject to trade-offs during an infectious process and that the observed diversity resembled results obtained in experimental evolution studies. Whatever the mechanisms leading to diversity, our results have strong medical implications in terms of the need for more extensive isolate testing before deciding on antibiotic therapies.
Citation: Levert M, Zamfir O, Clermont O, Bouvet O, Lespinats S, et al. (2010) Molecular and Evolutionary Bases of Within-Patient Genotypic and Phenotypic Diversity in Escherichia coli Extraintestinal Infections. PLoS Pathog 6(9): e1001125. doi:10.1371/journal.ppat.1001125
Editor: Franc¸ois Balloux, Imperial College, United Kingdom
Received March 9, 2010; Accepted August 31, 2010; Published September 30, 2010
Copyright: ß 2010 Levert et al. This is an open-access article distributed under the terms of the Creative Commons Attribution License, which permits unrestricted use, distribution, and reproduction in any medium, provided the original author and source are credited.
Funding: M.L. was supported by a grant from the ‘‘Region Ile de France’’, O.T. was funded by the ‘‘Agence Nationale de la Recherche’’ and E.D. was partially supported by the ‘‘Fondation pour la Recherche Me´dicale’’. K.P. and T.F. were supported by the Australian Research Council. The funders had no role in study design, data collection and analysis, decision to publish, or preparation of the manuscript.
Competing Interests: The authors have declared that no competing interests exist. * E-mail: erick.denamur@inserm.fr
Introduction
Polymicrobial infections, caused by combinations of viruses, bacteria, fungi and parasites, are being recognised with increasing frequency [1]. Polymicrobial infections due to bacteria of the same species have been less studied, as they are clearly more difficult to identify. However, recent molecular epidemiological tools allow their systematic detection, as well as the study of the relatedness between strains. Two kinds of within-species diversity have been reported: polyclonal diversity with infection caused by
phylogenet-ically divergent clones and monoclonal diversity with infection by members of a single clone that exhibit genetic micro-heterogeneity. Such within-species polymicrobial infection have been reported mainly in chronic and/or open infections (Pseudomonas aeruginosa infections of lung in cystic fibrosis patients [2,3] and of burn wounds [4], Helicobacter pylori gastric infection [5], Staphylococcus epidermidis joint prosthesis infection [6] and endocarditis [7], lung tuberculosis [8]) but also in septicemia [9,10].
Beside these clinical observations, in vitro experimental evolution has provided some clues on the diversification process in a single
clonal population. It has been shown that stable polymorphisms can emerge due to ecological interactions [11,12,13,14]. More detailed analysis of variation with larger numbers of sampled co-evolving bacteria showed that a very complex polymorphism with considerable phenotypic diversity could emerge in a matter of days [15], revealing a kind of adaptive radiation. In this case, selection under nutrient limitation altered the SPANC balance, or the trade-off between self-preservation and nutritional competence [16]. Polymorphisms affecting the SPANC balance often result in altered cellular levels of the sigma factor RpoS, which results in modification of several phenotypes, such as nutritional abilities, general stress resistance, starvation survival, cell morphology [17]. RpoS is a central regulator of stress resistance. Strains with higher RpoS level are more resistant to external stress but metabolised fewer substrates whereas strains with lower RpoS level have broader nutritional capabilities but lower resistance to external stress. Experimental evolution has also studied cooperation and competition among single species bacteria according to relatedness [18]. Overall, many different ecological sources of polymorphism have been identified in more than 60 years of bacterial experimental evolution. Yet, few studies have connected the molecular bases of such polymorphism to the one observed in the course of an infection. Currently, it is impossible to distinguish whether bacterial adaptation in the course of an infection is the action of the immune system [19] or the kind of process observed in in vitro experimental systems. Are the selective pressures identified as a source of diversification in in vitro experimental systems actually relevant during an infection?
Escherichia coli is a commensal of the intestinal tract of vertebrates, including humans [20], that can cause intestinal (diarrhoea) and extraintestinal [urinary tract infection (UTI), pneumonia, neonatal meningitis, septicaemia] infections [21]. Human extraintestinal infections have high incidence and associated morbidity, mortality (500,000 estimated deaths a year worldwide), and costs [22]. E. coli species can be considered as having mainly a clonal genetic structure [23,24] with four main phylogenetic groups (A, B1, B2 and D) [25,26]. Numerous epidemiological and animal model studies have documented the association of specific ‘‘virulence’’ determinants and/or phyloge-netic groups with the different clinical syndromes [21,27,28]. It is classically admitted that E. coli extraintestinal infections are caused by identical isolates originating from single clones. From this
assumption, the identification and antibiotic testing are mainly based on the characterisation of a single colony from the pathological specimen isolation. However, as for other bacterial species [2,3,4,5,6,7,8,9,10], this assumption is questionable.
In this context, we studied the level of genomic and phenotypic polymorphism of E. coli in human severe and closed extraintestinal infections. The aim of our work was (i) to get a better appreciation of the occurrence of within-species diversity in closed infections, (ii) to decipher the molecular and evolutionary bases of this diversity and (iii) to test, using a mathematical model, whether SPANC balancing can be a contributing factor to the observed pathogen diversification.
Results
Two kinds of intra-patient E. coli genetic diversity were observed: polyclonal and monoclonal with micro-heterogeneity
To have a global distribution of the genetic diversity of the 226 E. coli isolates from 19 patients (Table 1), we used a combination of phylogenetic grouping, multi locus sequence typing (MLST), Enterobacterial Repetitive Intergenic Consensus (ERIC)-PCR and pulsed field gel electrophoresis (PFGE) analyses to characterise the two kinds of diversity, i.e. polyclonal and monoclonal with micro-heterogeneity. Polyclonal infections were identified by distinct sequence type and/or phylogenetic group/subgroup and unrelat-ed ERIC-PCR and PFGE patterns whereas monoclonal infection with micro-heterogeneity were characterised by identical sequence type and phylogenetic group/subgroup and distinct but related patterns of ERIC-PCR and PFGE [29].
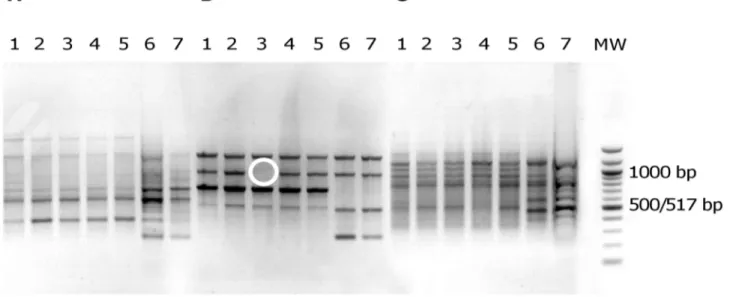
In 8 cases (42%) corresponding to 3 UTI, 1 meningitis, 1 pleural infection, 1 ascites, 1 placenta infection and 1 hepatic abscess (patients 1, 2, 4, 6, 7, 9, 10 and 18), no genetic diversity was observed (Table 1). In patients 5, 8, 15 and 16 (21%) (Table 1), corresponding to intra-abdominal infections, polyclonal infections were observed. In patient 16, three different clones corresponding to 3 distinct phylogenetic groups were observed among the isolates. In patients 8 and 15, the isolates belong to 2 different phylogenetic group/subgroups (Table 1). In patient 5 where the two isolates belong to the A1subgroup (Table 1), MLST analysis clearly showed two distinct sequence types corresponding to a large divergence time. Among these infections, isolates exhibited different ERIC-PCR patterns with each of the three primers (see Fig. 1 for an example). Moreover, these 4 patients with polyclonal infections have at least one of the clone exhibiting micro-heterogeneity (Table 1), characterised by closely related but different patterns observed by ERIC-PCR with only one or two primers and by PFGE (see Fig. 1 and 2 for an example). In the remaining 7 patients (3, 11, 12, 13, 14, 17 and 19), monoclonal infections with micro-heterogeneity were detected by ERIC-PCR and PFGE (Table 1). In these cases of micro-heterogeneity, the isolates belong to the same phylogenetic group/subgroup and sequence type using 7 essential genes as well as the sequence of the gnd gene, one of the most variable genes in E. coli [30]. Altogether, presence of at least a clone with micro-heterogeneity was observed in 11 patients (58%). A dendrogram constructed from the PFGE patterns of E. coli isolates from these patients is shown in Fig. 3A. Within a patient, the level of similarity between isolates is above 94% (Fig. 3A). In patients 3 and 19 from which blood and an additional sample were available, the micro-heterogeneity was observed in both samples. Lastly, all the 19 patients were infected by unrelated clones (Table 1 and Fig. 3A).
The presence of 20 virulence factors (VFs) known to be associated to extra intestinal virulence [31] and representative of the main classes of VFs (protectin, adhesin, toxin, iron uptake
Author Summary
We investigated whether an infection is a site of pathogen within-species diversity. Our results indicate that there is indeed extensive diversity during human extraintestinal infections by Escherichia coli. This diversity was of two types, not mutually exclusive, as we found that patients were infected either by several distinct E. coli clones or by members of a single clone that exhibit micro-heterogene-ity. The high degree of phenotypic diversity, including antibiotic resistance, suggests that there is no uniform selection pressure leading to a single fitter clone during an infection. We discuss a possible mechanism and a mathematical model that explains these unexpected results. Our data suggest that the evolution of diversity in the course of an infection and in in vitro experimental evolution in the absence of host immune selective pressure may have many parallels. Whatever the mecha-nisms leading to diversity, our results have strong medical implications in terms of the need for more extensive isolate testing before deciding on antibiotic therapies.
system) were studied. A wide range of VF patterns was observed from the absence of detected gene in A group strains to the presence of 12 studied genes in the B2 group strains, in agreement with the well known link between virulence and phylogeny [27] (data not shown). Among the 4 patients (5, 8, 15 and 16) infected by several distinct clones, the VF patterns of each clone within a patient were always different. In 3 patients infected by a clone exhibiting a micro-heterogeneity (14, 17 and 19), the iucC and iutA genes, associated to traT gene, were either present or absent, indicating the variable presence of a plasmid bearing the aerobactin operon (Tables 1 and S1).
In summary, a high level of genetic diversity was frequently observed in the isolates originating from a single patient. Two kinds of genetic diversity were observed: (i) polyclonal infection and (ii) monoclonal infection with micro-heterogeneity. These two kinds of genetic diversity can be combined in a single patient.
Isolates from a single clone with genetic micro-heterogeneity exhibit variable antibiotic susceptibility and growth patterns
We then wanted to know if the genetic micro-heterogeneity observed within isolates of a single clone was associated with
phenotypic variation. To this purpose, we studied in all the isolates two phenotypes having critical impact on strain fitness in an infection, i.e. antibiotic sensitivity and growth. Among the 226 E.coli isolates, 19 distinct antibiotypes were distinguished. We found 9 clones in 9 patients (3, 8, 11, 12, 13, 14, 16, 17 and 19) exhibiting heterogeneity in the antibiotic resistance pattern, all of which having a genetic micro heterogeneity (Tables 1 and S2, Fig. 3A and 4A). The antibiotics concerned were the b-lactams, tetracycline, streptomycin and kanamycin, the sulfonamides, trimethoprim and chloramphenicol. Within these single clones, 2 to 4 distinct antibiotypes were evidenced, the most sensitive phenotype being always observed in the minority of the isolates (Table S2). Several causes of variation in antibiotic susceptibility were likely. Firstly, loss of genetically mobile resistance genes was confirmed by a perfect correlation between the b-lactam resistance phenotype and the positive TEM (b-lactamase) PCR results in the isolates from 5 patients (3, 8, 12, 16 and 19). This mechanism is also likely involved in the loss of resistance to tetracycline, streptomycin, kanamycin, sulfonamides, trimethoprim and chloramphenicol, as the genes encoding for these resistances in clinical isolates are located on mobile elements such as transposons and integrons [32]. Patients 14 and 16 are particularly illustrative of this phenomenon as multiple combinations of antibiotic resistance losses were observed within a Table 1. Main characteristics of the E. coli studied.
Patient IDa Origin Number of isolates Phylogenetic group/ subgroupsb Genetic micro-heterogeneityc
Virulence factor pattern variabilityd Number of antibiotypes Growth defecte 1 urine+ blood 10+10 D1 2 1 2 urine+ blood 10+10 B23 2 1 3 hepatic abscess+ blood 10+10 B23 + 2 + 4 placenta+ blood 20+10 B23 2 1 5 perirectal abscess 7 A1 f (5) A1(2) + 2 1 1 + 6 hepatic abscess 8 A1 2 1 7 ascitic fluid 8 D1 2 1 8 bile 7 A0(2) A1(5) + + 1 2 9 pleural fluid 10 B22 2 1 10 cerebrospinal fluid 5 A1 2 1 11 cerebrospinal fluid 7 A0 + 2 + 12 urine 6 A1 + 2 13 urine 7 B23 + 2 +
14 pleural fluid 8 B1 + iucC, iutA, traT 4 + 15 hepatic abscess 14 B1(2) B23(12) 2 + 1 1 + 16 appendiceal abscess 9 A1(1) B1 (7) B23(1) 2 + 2 1 3 1
17 peritoneal fluid 9 A1 + iucC, iutA, traT 2 +
18 urine 15 B23 2 1
19 urine+ blood 5+11 D1 + iucC, iutA, traT 2 + a
Bold numbers correspond to patients infected by distinct clones (polyclonal infections).
b
Determined as in [63]. When several group/subgroups are present within a single patient, the number of isolates belonging to each group/subgroup is indicated in parentheses.
c
Determined by PFGE and/or ERIC-PCR.
d
Only variable virulence factors are indicated. All these variable genes are plasmid-located.
e
A plus sign indicates that some isolates within a single patient exhibit impaired growth as compared to other isolates of the same patient.
f
These two groups of A1strains were differentiated by MLST.
doi:10.1371/journal.ppat.1001125.t001
single patient (Table S2). Secondly, hyper-susceptibility to b-lactams was observed in 3 patients (11, 13 and 17). We have further studied the isolates of patient 17. Susceptibility to antibiotics (amoxicillin, piperacillin and ticarcillin) and detergents (SDS) was not constant and outer membrane permeability assays indicated heterogeneity in permeation rates due to variations in porin-mediated diffusion (Fig. 3B). Thirdly, the discrepancy between outer membrane permeability (Fig. 3C) and antibiotic/SDS susceptibility (Fig. 3B) points to yet other differences in envelope structure or efflux between isolates [32], suggesting an unexpectedly extensive range of surface variations inside a patient.
Even more strikingly, heritable variation in growth character-istics was found amongst clonal isolates from 8 patients, all infected by at least one clone with genetic micro-heterogeneity (Tables 1 and 2). Impaired growth was characterised by longer lag time and/or generation time and/or reduced biomass in stationary phase (Table 2). Within a patient, impaired growth was found in 6 to 22% of isolates (mean 13%), the remaining isolates having identical unimpaired growth kinetics (Fig. 4B and Tables 1 and 2).
Commensal clonal populations are phenotypically less diverse than pathogenic ones
A crucial question is whether micro-heterogeneity is due to multiple infections of micro-evolved genotypes of the same clone from a common route and/or source of infection or to evolution during the infectious process. We thus compared within-clone phenotypic diversity in the 19 populations isolated from infections and in 15 clonal populations isolated from the faeces of 15 healthy subjects matched for geographic origin and sex with the infected patients (10 colonies studied per sample). We found in healthy subjects one change of antibiotic profile within a subject, affecting the resistance to sulfonamides in 7 isolates, and one change in growth ability within another subject, affecting one isolate from 10. This is a significantly different pattern as compared to the infected patients (Wilcoxon two sided test, p = 0.015), consistent with increased genetic differentiation during infection.
Mutators are present within monoclonal isolates of a unique patient
A way to increase the genetic and phenotypic diversity is to increase the mutation rate. We thus measured the frequencies of mutations conferring resistance to rifampin in the isolates of 9 patients where a strain with genetic micro-heterogeneity was identified. In patient 14 the isolates were all resistant to rifampin. The median value of mutagenesis for the 91 isolates from the remaining 8 patients was 3.3361029, a value not different from the previously reported E. coli collections [33]. Considering a threshold of 10-fold the median value for defining mutators, 3 isolates were mutators: one in patient 3, one in patient 12 and one among the A1isolates in patient 17 (Table S3). Among these three isolates, one from patient 17 displayed a .50-fold increase in mutagenesis and was considered as a strong mutator. Such strong mutators have been shown to be essentially mismatch repair deficient in the wild [34].
Isolates exhibiting a micro-heterogeneity did not have a higher mutation rate than commonly found in the species E. coli. Hence, increased mutation rate should not be the primary cause of the observed phenotypic diversity, yet the presence of some mutator isolates at quite high frequency compared to their expected production by mutation, suggests that some strong adaptation might be under way in those populations [35].
The level of RpoS is variable within isolates of a single clone
In environments as in the host where stress and nutritional competition are both important, selection may well affect SPANC-related phenotypes [15,36,37].
We studied the variability of the SPANC-related phenotypes in the 8 patients showing differences in growth kinetics. Using an assay that tests the metabolic capacity of a strain to use a wide array of carbon sources (Phenotype MicroArrays) [38], we found that isolates from a single clone within a single patient have distinct patterns of substrate use (Fig. 4C and Tables 2 and S4).
Figure 1. Electrophoretic patterns in agarose gel of PCR products fromE. coliisolates. Primers ERIC1 (A), ERIC1R (B) and ERIC2 (C) were used for E. coli isolates of patient 5 (lanes 1 to 7). MW, DNA ladder (New England Biolabs, Saint Quentin en Yvelines, France). The banding patterns of isolates 1 to 5 are clearly different from the banding patterns of isolates 6 and 7, whatever the primer. This corresponds to two distinct E. coli clones. Of note, isolate 3 with primer ERIC1R (B) can be distinguished from other isolates of the same clone by one band (white circle). This corresponds to a genetic micro-heterogeneity.
Interestingly, 9 of these substrates differentially used within isolates from a single patient (Table S4) are among the 13 substrates whose metabolism is stimulated by an rpoS disruption [39]. Motility and sensitivity to H2O2 and acid were also highly variable among isolates from a single patient (Figs 4D and E and Table 2). Thus, heterogeneity in motility pattern was evidenced in 7 of the 8 patient isolates, with the majority of isolates within a patient being motile and the minority being non motile whereas polymorphism in the H2O2and acid sensitivity was observed in all and 5 patients, respectively. Furthermore, a significant relation was observed between growth, capacity to use the substrates, sensitivity to H2O2 and acid and motility. Strains showing impaired growth use fewer substrates, are more resistant to H2O2 and acid but less motile (Fig. S1), in accordance with the proposed SPANC trade-off [39]. We also studied the development of the red dry and rough (rdar) morphotype, which is depending of RpoS [40]. This morphotype is a multicellular behavior characterized by expression of the adhesive extracellular matrix components curli fimbriae and cellulose [41]. The morphotypes within isolates of single patients were highly variable (see Fig. 5A for an example). To confirm the role of RpoS in the observed polymorphism, we studied in more detail the 8 isolates of patient 3, the 7 isolates of the patient 13 and the 9 isolates of patient 17. The level of RpoS in the cell was assessed qualitatively by staining for presence of glycogen (RpoS
regulates positively glgA, the glycogen synthase gene) and quantitatively by RpoS immunoblotting using specific antibodies. Both assays were consistent and showed isolate-specific endoge-nous levels of RpoS (Figs 5 and S2 and data not shown). Although the variations were not drastic except for few isolates, the fact that they were highly correlated between both techniques as well as to the nutritional and stress phenotypes and the rdar morphotypes, and the differentially expressed proteins for the patient 3 (see below and Fig. 6), is an argument for their physiologic relevance. Hence a major determinant of the polymorphism observed appear to be linked to the SPANC balance as observed in some experimental evolution settings.
Twenty-seven proteins are differentially expressed within the isolates of a single clone in relation to the SPANC-related phenotypes
To decipher the molecular bases of the RpoS phenotype, we first sequenced the rpoS promoter and gene but surprisingly did not detect any mutations amongst the 8 representative isolates of patient 3. We then performed differential proteomics on these 8 isolates by bidimensional electrophoresis (2-DE) and mass spectrometry. Twenty-seven proteins were significantly differen-tially expressed between the isolates, with a 1.8 to 24 fold range
Figure 2. Pulsed-field gel electrophoresis resolvingXbaI restriction fragments fromE. coliisolates. Lines 3–7, 9, 10 and 11–13, 15–19 correspond to isolates of patients 5 and 14, respectively. Line 1, MW, DNA ladder (New England Biolabs, Saint Quentin en Yvelines, France), lines 2, 8 and 14, unrelated E. coli strain used as control. Differences between closely related strains are indicated by circles. Patient 5 was infected by two different E. coli clones (lines 3–7 and 9,10). Banding patterns of lines 3–7 are closely related, with differences affecting only one or two bands, but completely different from banding patterns of lines 9 and 10, which are identical. These data are in agreement with the ERIC-PCR data (Fig. 1). The isolates of patient 14 (lines 11–13, 15–19) are closely related with seven bands being variable among all isolates.
doi:10.1371/journal.ppat.1001125.g002
(Fig. S3 and Table 3). Among them, 16 were involved in central metabolism, 9 were membrane proteins and 2 were stress proteins. Furthermore, 14 out of the 27 differentially expressed proteins were known to be RpoS regulated (Table 3). Within the 8 isolates, the levels of the 27 proteins, except one putative outer membrane protein, were significantly related, as well as to the level of RpoS, the sensitivity to H2O2and acid, the capacity to use substrates, the motility and the growth, with one group of proteins closely linked to the level of RpoS and the other with growth (Fig. 6).
Few mutations are associated with the phenotypic changes observed within the isolates of a single clone
To identify the mutations responsible for these phenotypic changes, we performed whole-genome sequencing of 4 (42, 45, 50 and 58) of these 8 isolates of the patient 3 and searched by PCR
for the identified mutations in the 4 (47, 51, 52 and 54) remaining isolates. Six point mutations, one small deletion and one IS insertion were identified, generating a star like phylogeny with each of the four sequenced isolates having its own combination of mutations (Fig. 7 and Table 4). The point mutations in 42, 45 and 58 isolates were absent from the remaining isolates in Fig. 7. The IS insertion was only identified in two of four sequenced isolates, but was shown by PCR to be in 47, 52 and 54 isolates as well. The genes affected were encoding for metabolic functions, including the acid resistance system dependent upon glutamate, and for membrane proteins. Of note, ompA was the target of 2 different molecular defects in isolates 45 and 58 (Table 4), which is a very strong sign of selection. A mutation in the repressor of the rbs operon involved in the D-ribose catabolic function, was observed. This operon was also shown to be the target of
Figure 3. Antibioresistance phenotypes ofE. coliisolates. (A) Dendrogram constructed from the pulsed-field gel electrophoresis patterns of 104 isolates of E. coli showing genetic micro-heterogeneity in 12 clones infecting 11 patients with the antibiotypes. The antibiotypes are indicated with the corresponding isolates as in Table S2. Ward’s algorithm was used to cluster the isolates from a similarity matrix created by using the band-based Dice similarity coefficient. The stars indicate the isolates differentiated by ERIC-PCR. Patient 8 is infected by one A1clone and one A0clone. Abbreviation of the antibiotypes is as follow: A, susceptible to all antibiotics tested; B, susceptible to all antibiotics tested and hyper- susceptible to b-lactams; C, Penicillinase production; D, Penicillinase production and resistant to tetracycline (Te), minocycline (Mn), sulfonamides (Sul), streptomycin (St), kanamycin (Ka); E, resistant to Te, Mn, Ka; F, resistant to Te, Mn, Sul, St; G, Penicillinase production and resistant to Te, Mn, Ka; H, Penicillinase production and resistant to Te, Sul, trimethoprim (TMP), St, Ka, nalidixic acid (Na), chloramphenicol (Ch); I, resistant to Te, Sul, St, Na, Ch; J, Penicillinase production and resistant to Te, Mn, Sul, TMP, St; K, Penicillinase production and resistant to Te, Mn, Ch; L, Penicillinase production and resistant to Te, Mn, Sul, St, Ch; M, resistant to Sul, St; N, resistant to Te; O, resistant to Te, Sul, St. Various level of susceptibility to penicillin antibiotics were observed among isolates of patient 17. (B) Minimum inhibitory concentration (MIC) of three b-lactams [amoxicillin (AMX), Piperacillin (PIP), Ticarcillin (TIC)] and susceptibility to SDS of the nine isolates from patient 17. The antibiotype is as in (A). Note the heterogeneous patterns of MICs and SDS susceptibility of the hyper-susceptible isolates to b-lactams, indicating the implication of various mechanisms of increased outer membrane permeability. (C) Outer membrane permeability rates for the nine isolates from patient 17, compared to the rate for E. coli K-12 strain MC4100. The permeability rate for MC4100 was 3.96, in units of optical density change at 492 nm/min/1010bacteria.
inactivating mutations selected during experimental evolution in glucose minimal medium [42]. Most of the mutations were corroborated by the proteomic changes in the corresponding isolate (Table 4).
Multiple genotypes with distinct levels of RpoS can co-exist as a result of the trade-off
Can SPANC balancing provide an explanation for E. coli diversity observed in the clonal isolates of a single patient described above? To test this hypothesis we consider a mathematical model that is built on a series of simple assumptions regarding bacterial metabolism and the environment in which bacteria reside, but that allows us examine in isolation the role of SPANC balancing in the creation and maintenance of diversity.
In our model we assume that E. coli isolates differ in their RpoS expression, x, normalized to 0#x#1 so that an rpoS- mutant has x = 0 and the rpoS+with a maximal level of resistance has x = 1. Evolutionary changes in x are constrained by the SPANC balance trade-off in the following way: an increase in x leads to a decrease in the maximal resource uptake rate denoted by a decreasing function f(x); an increase in x also leads to an increase in the stress protection denoted by an increasing function c(x). Next we consider an E. coli population with n competing isolates each with a different value of the RpoS expression x, and define Nxito be the
density of an isolate with phenotype xi where i = 1…n and
0 = x1#x2#…#xn= 1. We assume that mutations altering x occur at a rate e taking into account both mutations in known regulators of RpoS levels as well as mutations that pleiotropically affect the levels of RpoS. A schematic representation of the model can be found in Fig. S4.
Solving numerically the system of equations (1) we find that starting with an isogenic rpoS+ population, the equilibrium population can support two or more partial rpoS- mutants depending on the shape of the SPANC balance trade-off namely on the shape of f(x) and c(x) (Fig. 8). For example, if mutations, that further decrease the levels of RpoS in a type that already has low levels of RpoS, do not lead to a marked decrease in stress protection (Fig. 8a), the long-term population structure supports two genotypes with distinct RpoS levels (Fig. 8d). On the other hand if mutations, that further decrease the levels of RpoS in a type that already has low levels of RpoS, lead to a clear decrease in stress protection (Fig. 8c), the long-term population structure supports three genotypes with distinct levels of RpoS (Fig. 8e).
Note that in our model the coexistence of multiple genotypes requires the assumption that changing RpoS levels from 1 to 0 induces three distinct levels of stress protection (Fig. 8a and c). While to our knowledge the shapes of the SPANC balance trade-off have not been determined in detail these forms are not unrealistic because stress responses to most environmental stresses
Figure 4. Illustration of the phenotypic diversity observed in theE. coliisolates of patient 3 infected by a unique clone [isolates from blood (ID 42–50) and liver abscess (ID 51–58)]. (A) Variability in the antibiotypes with a plasmid loss in isolate 51 responsible for the susceptible phenotype. AMX: amoxicillin, Sul: sulfonamide, St: streptomycin, Te: tetracycline. (B) Growth curves in Luria Bertani broth at 37uC of 8 isolates, showing impaired growth of isolates 45, 52 and 58. (C) Carbon source utilisation using Biolog GN2 plates that test 95 substrates. Only substrates differentially used by the isolates are indicated. The substrates are as follows. a: Dextrin, b: Bromosuccinic Acid, c: Glucuronamide, d: L-Alanine, e: L-Asparagine, f: L-Aspartic Acid, g: Glycyl-L-Aspartic Acid, h: L-Serine, i: D,L-a-Glycerol Phosphate. Substrates with a star correspond to substrates whose metabolism is stimulated by an rpoS disruption [39]. Black and white squares indicate the use or the absence of use of the substrate, respectively. (D) Non motile (52) and motile (54) isolates in 0.35% agar plates incubated for 48 hours at 37uC in humid atmosphere. (E) Sensitivity to H2O2measured by the survival in % at different times. The greatest differences were observed at 5 minutes. The colour code for the isolates is as in (B). (F) Kaplan-Meier curves estimating the survival function of mice subcutaneously inoculated by 26108colony forming units of the different isolates. Only one curve of each statistically significant category is presented. Isolates range from the more to the less virulent as follow: isolates 54 and 50 (group 4), isolates 42, 47 and 51 (group 3), isolates 52 and 58 (group 2) and isolate 45 (group 1).
doi:10.1371/journal.ppat.1001125.g004
involve not just RpoS, but also additional stress-specific responses (e.g. the heat shock or low pH responses) whose expression is directly or indirectly affected by the RpoS level. For example the acid stress resistance is influenced by numerous components including AR2 system whose expression can be initiated with either of two sigma factors RpoS and RpoD [43]. Similarly, DsrA, a small RNA, influences multiple acid resistance genes of E. coli as well as RpoS levels [44]. Therefore changing levels of DsrA, AR2 repressor H-NS and RpoS could give rise to non-linear relationships in the SPANC balance trade-offs as illustrated in Fig 8.
This simple model demonstrates that the SPANC balance is sufficient to create diversity in RpoS expressions within an E. coli population, and does not require any specific effect of the immune system.
The intrinsic virulence of isolates from a single clone is highly variable
Even if models predict that the mutants with variable levels of RpoS may emerge in the absence of immune selective pressure, we wanted to test the impact of RpoS phenotype on virulence. We
therefore investigated the intrinsic extraintestinal virulence of each of the 8 representative isolates of patient 3, in a mouse model of septicemia [27]. Statistically significant differences were obtained between isolates, defining 4 groups (1 to 4), with the most virulent killing 100% of the mice in less than 15 hours (group 4) and the least virulent killing only 40% of the mice (group 1), the 2 other groups being intermediate (Fig. 4F). These groups are significantly correlated to growth properties; better growth gives greater virulence (Fig. 6). In confirmation, competition experiments in mice inoculated with a 1/1 ratio of isolate 58 (having an impaired growth) and reduced mouse killing (group 2) and isolate 42 (having a normal growth) and relatively high mouse killing (group 3) (Fig. 4F), showed a survival curve identical to the one observed in mice infected with isolate 42. Bacterial counts in the spleens of the killed mice showed a culture consisting . 99% of the 42 isolate. Identical results between these two strains were obtained after 24 h of in vitro competition in Luria Bertani broth (data not shown).
Hence the RpoS-associated impaired growth is not beneficial in the systemic phase of infection mimicked by the mouse model of septicemia, and the polymorphism observed may be driven mostly by the SPANC balance.
Table 2. Phenotypic characteristics of E. coli isolates showing an impaired growth.
Isolate IDa Growthb
Biolog GN2c Motilityc H2O2sensitivityc Acid sensitivitye Lag
time (h)
Generation time (h)
Biomass in stationary phase (108 bacteria.ml21 ) 3-42 1.5 (0) 1.7 (0.03) 14.4 (0.2) 39 + + intermediate 3-45 1.5 (0) 2.4 (0.09) 13.9 (0.3) 39 + + intermediate 3-47 1.5 (0) 1.7 (0.06) 14.8 (0.3) 35 + 2 low 3-50 1.5 (0) 1.6 (0.05) 14.9 (0.4) 36 + 2 low 3-51 1.5 (0) 1.6 (0.07) 15 (0.4) 36 + 2 low 3-52 1.5 (0.2) 4.7 (0.36) 11.4 (1.4) 34 2 2 low 3-54 1.5 (0) 1.7 (0.09) 15.1 (0.5) 38 + + intermediate 3-58 2.0 (0.1) 4.3 (0.41) 12.2 (2.2) 32 2 2 low 5-4228 2.3 (0) 1.8 (0.04) 12.6 (0.1) 48 + + intermediate 5-4225 2.3 (0) 1.8 (0.04) 10.4 (0.4) 44 2 2 intermediate 11-4252 1.5 (0) 1.5 (0.01) 14.1 (0.1) NDd + 2 low 11-4250 1.8 (0) 2.0 (0.03) 13.3 (0.2) ND + + high 13-4432 2.2 (0) 1.8 (0.1) 13.7 (0) 40 + 2 intermediate 13-4433 2.6 (0) 2.3 (0.01) 12.9 (0.2) 35 2 + high 14-4231 1.9 (0) 1.6 (0.03) 13.9 (0.1) ND 2 + low 14-4245 2.6 (0) 2.0 (0.09) 11.5 (0.2) ND + 2 intermediate 15-P5-30 1.9 (0.1) 1.4 (0.07) 14.0 (0.2) 43 + + intermediate 15-P5-24 2.2 (0) 1.9 (0.11) 13.3 (0.2) 40 2 2 low 17-P5-40 1.9 (0) 1.7 (0.05) 13.7 (0) 37 ND + intermediate 17-P5-38 2.4 (0) 1.8 (0.04) 13.5 (0.1) 28 2 2 intermediate 17-P5-41 2.7 (0) 3.3 (0.56) 13.9 (0.1) 34 + 2 intermediate 19-486 2.3 (0.2) 1.3 (0.07) 14.4 (0.2) 45 + + low 19-474 2.4 (0) 1.6 (0.04) 13.2 (0.2) 43 2 2 low a
First number corresponds to the ID patient. The first isolate is the normal growth control.
b
The experiments were repeated 3 times. The data are presented as the mean+/2 standard deviation in brackets.
c
In all cases, comparisons are made between isolates of the same patient. For the Biolog GN2, the total number of used carbon sources is indicated. See Table S4 for the complete list of carbon sources. For motility and H2O2sensitivity, only two categories were considered:+ corresponds to increased motility and H2O2sensitivity as
compared to 2.
d
ND, not determined because of the absence of growth.
e
See material and methods for the categorization. doi:10.1371/journal.ppat.1001125.t002
Discussion
Infections of a single patient by several distinct isolates is common in extraintestinal E. coli infections and result from different phenomena
To our knowledge, this work is the first one to investigate thoroughly, using molecular tools, numerous isolates from single patients in a large series of deep and severe extraintestinal E. coli infections. E. coli responsible for extraintestinal infections can be considered as opportunistic pathogens with the commensal reservoir being the intestinal tract [20,21]. We observed an unexpectedly high level of within patient bacterial polymorphism as 11 of the 19 (58%) patients were infected by genotypically and/ or phenotypically diverse bacteria. This diversity, as previously reported in other species [2,3,4,5,6,7,8,9,10], is of two types. Patients are infected either by several distinct E. coli clones or by a single clone with micro-heterogeneity. Both types of diversity can be observed in some patients. Patients with distinct E. coli clones were clearly infected from the intestinal commensal niche by different clones. Of note, these multiple infections are physically closely related to the commensal reservoir (Table 1). For the patients infected by a single clone that presents some micro-heterogeneity, two scenarios, not mutually exclusive, can be
envisaged: the observed diversity could have pre-existed to the infection process in which a subset of the digestive tract diversity would have been sampled or the diversity could have emerged in the course of the infection that was initiated by a single isolate or few identical isolates. Several arguments favour the second hypothesis. First, in the cases with micro-heterogeneity, the infected organs were more diverse (kidney in 3 cases, digestive apparatus in 2 cases, pleural fluid and cerebrospinal fluid in one case each, associated in 2 cases to bacteremias) than in the patients infected by distinct clones, suggesting a less evident route for digestive tract bacteria to the infection zone. Second, we have studied the level of phenotypic polymorphism in E. coli isolates from stools of healthy subjects harbouring unique clones and found a significantly lower level of polymorphism in antibiotic resistance and growth patterns than in infections. Third, the tree reconstructed from the phenotypic and proteomic data (Fig. 7) of the 8 representative isolates of the patient 3 appears as a star like phylogeny and indicates a rapid diversification from a unique ancestor. Fourth, such scenario of diversification during the infectious process has been experimentally confirmed in a rat model of S. epidermidis foreign body-associated infection [7]. Similarly, genomic changes were observed in H. pylori during gastric experimental infection in rhesus monkey [45]. Lastly, it has
Figure 5. Level of RpoS in 8 representativeE. coliisolates of patient 3. The level of RpoS was assessed by rdar morphotypes (A), staining glycogen with iodine solution (B) and RpoS immunoblot (C). RpoS amount is expressed as the ratio of the RpoS band to a constant cross-reactive band. The negative control (E. coli MG1655 DrpoS strain) is on the right part of the figure. Experiments in B and C were repeated 2 times, given values are the mean of the two experiments.
doi:10.1371/journal.ppat.1001125.g005
been demonstrated in immunocompetent rodent models that bacteremias resulting from experimental colonisations are the products of very few bacteria [46,47,48], or even a single one [49].
The molecular bases of the within-clone phenotypic diversity
Some of the observed phenotypic diversity (antibiotic resistance, iron capture system) was easily explained by the loss of plasmid borne determinants. It has been shown that in stressful conditions, the induction of the SOS system mobilises transposons [50], integrons [51], as well as virulence genes [52]. The remaining phenotypic diversity was mainly RpoS related but we did not identified mutation in the rpoS gene or in the more than 20 diverse regulators that have been shown to influence RpoS levels [17]. Instead, we observed few mutations in metabolic and membrane related genes (Table 4). The convergence in ompA, the mutation in the rbs operon that has been shown to be under selection in experimental evolution system [42] and the presence of mutators (Table S3) are strong arguments for the fact that these mutations have been selected. Of note, ompA is among the 23 genes that show evidence of positive selection in E. coli [53]. The genomic mutations we identified suggest that SPANC balance can be affected by an even larger set of pleiotropic mutations, many of them yet unknown. For example, the overproduction of the EmrAB-TolC multi-drug efflux transport system in the mprA mutant, and the nutrient starvation in the ompA mutants could
explain the altered growth and the RpoS response in isolates 45 and 58 (Table 4). In these cases, the RpoS phenotype would be secondary to the phenotype generated by the mutations. A limitation of our approach is that, (i) we could have missed IS based chromosomal reorganisations and gene amplification(s) and (ii) unlike in experimental evolution experiments, we do not have the ancestor clone that could allow us to perform reconstruction experiments with the mutated alleles and competitions [54], confirming the direct implications of the mutations in the observed phenotypes.
The evolutionary forces that drive the single clone diversity
A wide continuum of growth rate, stress resistance, outer membrane permeability, rdar morphotype and virulence proper-ties were observed within isolates of single clones, directly linked to the SPANC trade-off and associated with distinct levels of the sigma factor RpoS in isolates (Figs 3, 4, 5, 6 and S1). rpoS mutations have been reported in E. coli laboratory and natural isolates as they are probably selected for in nutrient-limited environments [16]. Indeed, an important variation in the level of RpoS was observed in an E. coli clonal population grown in constant environment in a chemostat. This population radiated in more than five phenotypic clusters, two including rpoS mutant isolates [15]. In some other experimental evolution systems, duplications of rpoS have been reported [37], suggesting that
Figure 6. Statistically significant links between phenotypes and the 27 differentially expressed proteins of the 8 representativeE. coliisolates of patient 3. The links depicted by a line, in green when positive (phenotypes and/or amounts of protein increase together) or in red when negative (a phenotype or an amount of protein increases when the other increases). Lighter is the line, more significant is the link. Only one protein (putative outer membrane protein) is not linked. Note that the links presented here are coherent with those of the phenotypes from the data set corresponding to 23 isolates originating from 8 patients (Fig. S1).
higher or lower level could be achieved depending on the exact setting of the experiment. Our data in infected patients hence parallel these observations made in experimental evolution systems in the absence of immune selective pressure, and were explained by the simple mathematical model. This fully supports the idea that the SPANC balance is sufficient to promote a strong phenotypic diversification at intermediate stress levels (Fig. 8). Of course there are numerous other mechanisms [55] that could generate the diversity patterns observed in this study, such as environmental heterogeneities or immune system driven negative-frequency dependence. But the model provided here is a test of an alternative coexistence mechanism. The model assumptions have been deliberately kept simple in order to illustrate a minimal set of conditions under which the SPANC balance trade-off could lead to coexistence of E. coli genotypes with differing levels of RpoS. In
particular the SPANC balance trade-off is defined through a single evolving phenotype, namely the RpoS expression and we conclude that complex but nonetheless realistic shapes of the trade-off are required for the diversity to be maintained. However, increasing the number of traits through which the trade-off exists will reduce the complexity of the shapes required to observe diversity [56].
The lack of mutations in rpoS itself that we observed suggests RpoS loss is detrimental under host infection conditions. Indeed, the role of RpoS in vivo is not clear as rpoS mutants are selected within the gut in commensal E. coli [57] but are avirulent in a mouse model of septicemia with Salmonella [58]. To test further if RpoS polymorphism is a virulence-linked effect, we tested the various isolates of patient 3 in a mouse model of infection. Yet we could not identify a virulence-linked benefit of high level of RpoS, as lower virulence was associated to lower growth rate (Fig. 4F and 6).
Another source of variation supported by theoretical and experimental approach is the one concerning iron uptake. Iron is essential for the growth of bacteria and they produce and release iron-chelating small molecules known as siderophores to scavenge iron from their hosts. Siderophore production is considered as an altruistic trait that is costly for the individual but provides a group benefit because other individuals can take up the siderophore-iron complex [18]. P. aeruginosa mutants that do not produce side-rophore (cheaters) have been seen to evolve both in vitro [59] and in the lungs of cystic fibrosis patients [60]. Similarly, we observed within clone variability due to the coexistence in a same sample of isolates with different siderophore encoding gene content due to plasmid loss (Table S1). A frequent observed polymorphism in the monoclonal infection cases is also the presence or absence of penicillinase production (Fig. 3A and Table S2), due to a bla plasmid borne gene. As in the case of siderophore production, penicillinase production could be seen as an altruistic trait in the presence of antibiotics. The effect could also be reinforced by the fact that plasmids may carry other secreted (altruistic) proteins [61].
One emerging question related to the presence of some strong diversity in phenotypes as important as growth, resistance to stress or antibiotic resistance, is what are the consequences in term of the infection outcome. In other words, how such a polymorphism affects the virulence of the bacterial population. The emergence of cheaters lacking siderophore or eventually antibiotic resistance genes (and the other genes carried on the plasmid) clearly illustrates that selection may not always favour the most virulent genotypes, and that within-population selection may on the opposite select for genotypes that reduce the infectious power of the population as a whole [62]. Along the same line, our mathematical modelling suggests that the SPANC trade-off allows the emergence of some variable bacteria independently of the host immune system, and our animal model of infection revealed that the most stress resistant ones are not the more virulent. Yet, the existence of some strong variability along the SPANC balance may sometimes be beneficial as many different strategies are present within the population and some may be more efficient than other in the different stages of the infection.
Concluding remarks
Our results suggest that experimental evolution and the evolution of diversity in the course of an infection may have many parallels. Whether or not this diversity promotes increased virulence remains an open question, that will require further work to link the observed mutations to the various phenotypes and to some potential virulence linked effects.
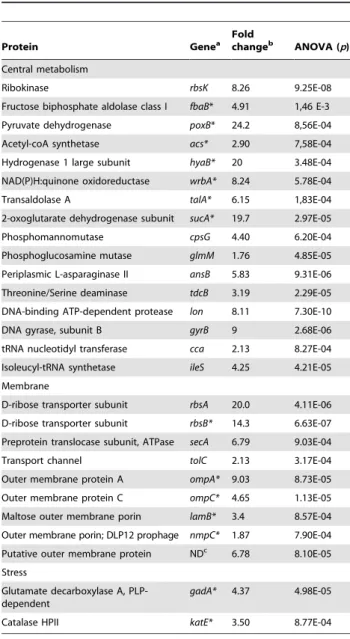
Table 3. List of the 27 proteins differentially expressed between the 8 representative E. coli isolates of patient 3.
Protein Genea Fold
changeb
ANOVA (p) Central metabolism
Ribokinase rbsK 8.26 9.25E-08 Fructose biphosphate aldolase class I fbaB* 4.91 1,46 E-3 Pyruvate dehydrogenase poxB* 24.2 8,56E-04 Acetyl-coA synthetase acs* 2.90 7,58E-04 Hydrogenase 1 large subunit hyaB* 20 3.48E-04 NAD(P)H:quinone oxidoreductase wrbA* 8.24 5.78E-04 Transaldolase A talA* 6.15 1,83E-04 2-oxoglutarate dehydrogenase subunit sucA* 19.7 2.97E-05 Phosphomannomutase cpsG 4.40 6.20E-04 Phosphoglucosamine mutase glmM 1.76 4.85E-05 Periplasmic L-asparaginase II ansB 5.83 9.31E-06 Threonine/Serine deaminase tdcB 3.19 2.29E-05 DNA-binding ATP-dependent protease lon 8.11 7.30E-10 DNA gyrase, subunit B gyrB 9 2.68E-06 tRNA nucleotidyl transferase cca 2.13 8.27E-04 Isoleucyl-tRNA synthetase ileS 4.25 4.21E-05 Membrane
D-ribose transporter subunit rbsA 20.0 4.11E-06 D-ribose transporter subunit rbsB* 14.3 6.63E-07 Preprotein translocase subunit, ATPase secA 6.79 9.03E-04 Transport channel tolC 2.13 3.17E-04 Outer membrane protein A ompA* 9.03 8.73E-05 Outer membrane protein C ompC* 4.65 1.13E-05 Maltose outer membrane porin lamB* 3.4 8.57E-04 Outer membrane porin; DLP12 prophage nmpC* 1.87 7.90E-04 Putative outer membrane protein NDc
6.78 8.10E-05 Stress
Glutamate decarboxylase A, PLP-dependent
gadA* 4.37 4.98E-05 Catalase HPII katE* 3.50 8.77E-04
a
Genes indicated by a star were shown to be regulated by RpoS [83,84,85,86,87].
b
Calculated between minimum and maximum normalized spot volumes of the 8 isolates.
c
ND, not determined.
doi:10.1371/journal.ppat.1001125.t003
Figure 7. Neighbour joining distance tree based on the phenotypic and proteomic data indicating the relationships between the 8 representative E. coli isolates of patient 3 with the identified mutations. Bootstrap values in percentages are calculated from 10,000 replicates. The boxed isolates correspond to the isolates fully sequenced. The isolate with a star (51) is a mutator isolate. The identified mutations (Table 4) as well as the plasmid loss are indicated in boxes at each isolate.
doi:10.1371/journal.ppat.1001125.g007
Table 4. Mutations identified by whole genome sequencing on 4 E. coli isolates of patient 3.
Isolate Localisation of the mutation Mutationa
Function Protein variationb 42 yagX ybdL tktA G 384,100 A (Phe 118 Phe) T 676,307 C (Met 240 Thr) T 3,376,675 C (Ile 21 Val)
Aromatic compound dioxygenase Methionine aminotransferase Transketolase 1, thiamin-binding 45 rbsR
Intrinsic transcription terminator of ompA
A 4,440,121 C (Thr 288 Pro) C 1,062,754 A
DNA-binding transcriptional repressor of ribose metabolism Outer membrane protein
RbsA, B, K+ OmpA 2 50 Between gadX and gadW Insertion of an IS1 element at 4,103,497 Transcription regulators of gadA GadA+ 58 Ribosome binding site of mprA
Between gadX and gadW ompA
T 3,091,307 C
Insertion of an IS1 element at 4,103,497 5 bp deletion between 1,063,473–1,063,479
DNA-binding transcriptional repressor of multidrug efflux pump EmrAB-TolC
Transcription regulators of gadA Outer membrane protein
TolC+ GadA+ OmpA 2
a
The numbers between nucleotides correspond to the localisation of the mutation in the CFT073 genome according to MaGe [79] whereas the number between the amino acids corresponds to the amino acid numbering of the protein, when relevant.
b
The variation is given for the protein itself or for proteins directly regulated by the encoded protein. Plus and minus signs indicate increased or decreased level of protein, respectively. Data are from the proteomic analysis (Table 3).
Whatever the mechanisms leading to diversity (infections by several distinct isolates or diversification during the infectious process), our results have strong medical implications in term of antibiotic therapies. Indeed, although an individual can harbour several independent commensal clones [63], the classical medical assumption about extraintestinal E. coli infections is
that they are strictly monoclonal. This is typified by the antimicrobial susceptibility testing performed on few (2 to 5) colonies obtained from the pathological sample to establish antibiotic treatment [64,65]. This may fail to detect the presence of other, more resistant isolates, and lead to therapeutic failure [66]. Our work showing an impressive level
Figure 8. Model of the distinct levels of RpoS. (d) Long-term population structure supporting two genotypes with distinct levels of RpoS, requires the benefit of stress protection and maximal rate of resource uptake to have the form illustrated in (a) and (b) respectively. (e) Long-term population structure supporting three genotypes with distinct levels of RpoS, requires the benefit of stress protection and maximal rate of resource uptake to have the form illustrated in (c) and (b) respectively. Here e = 0.32561028, S
0 = 1.16109picomoles of sugar, D = 0.0017 per minute, k = 46106picomoles of sugar and r = 237 cells per picomole of sugar. The maximal uptake rate f(x) is measured in picomoles of sugar per cell per minute.
doi:10.1371/journal.ppat.1001125.g008
of antibiotic resistance phenotype variability within the isolates of a single patient argues for the utilisation of a mix of numerous isolates to perform the antibiogram, or, alternatively for the realisation of simplified antibiograms with essential molecules on numerous isolates in addition to the classical antibiogram on a single isolate.
Materials and Methods Bacterial strains
A total of 226 E. coli isolates responsible for severe infections in 19 epidemiologically unrelated adult patients from 3 university hospitals in France [Brest, Paris suburbs (Colombes and Clichy)], were studied (Table 1). To avoid contamination, only deep and closed visceral infections were selected (pyelonephritis, meningi-tis, pleurisy, cholecystimeningi-tis, intra-abdominal deep abscess, ascitic fluid, peritoneal fluid and placental infections and bacteraemia). For 5 patients (1, 2, 3, 4 and 19), two samples were analysed (blood plus another site of infection), whereas only one sample was studied for the remaining patients. Except for urinary tract infection, samples were obtained during surgery or through sterile punctures. In all these infections, E. coli alone was recovered. For each sample, 5 to 20 colonies isolated on blood agar or CLED (cystine lactose electrolyte deficient) plates were randomly selected and stored with glycerol at 280uC before use. In addition, 150 commensal isolates belonging to 15 subjects (10 isolates per subject) matched for geographic origin (Brest, Paris suburbs) and sex with the patients [63] were studied as controls. Each subject exhibits identical isolates based on the phylogenetic group/subgroup and the virulence gene content, but the isolates of the different subjects belong to various phylogenetic group/ sub groups. Isolates were stored with glycerol at 280uC before use.
Human ethics statement
All the sampling procedures of the infected patients were performed in the course of the clinical diagnosis. No additional procedure was performed in the patients for the present study. The study was approved by the institutional ethics committee (Comite´ de Protection des Personnes, Hoˆpital Saint-Louis, Paris; #2004-06). For the healthy subjects, the study was approved by the ethics committee of INSERM (IRB0000388, FWA00005831), with the opinion #01-014. In both studies, the participants were informed of their role in the study and written informed consent was provided by study participants.
PCR phylotyping and virulence factor pattern
All pathogenic isolates were assigned to the 7 E. coli phylogenetic group and subgroups using triplex PCR based on the presence or absence of three DNA fragments (chuA, yjaA and TSPE4.C2) [63]. The presence of 20 extraintestinal virulence factors (VFs) (neuC, sfa, iroN, iucC, iutA, iha, papC, papG, hlyC, cnf1, hra, sat, ire, usp, ompT, ibeA, malX, fyuA, irp2 and traT) was tested by PCR on all isolates, as previously described [31].
Enterobacterial Repetitive Intergenic Consensus (ERIC)-PCR
ERIC-PCR was performed on all pathogenic isolates, as previously described [67] using separately three different primers to increase the discriminatory power of the technique: ERIC1 (59-GTGAATCCCCAGGAGCTTACAT-39), ERIC1R (59-ATG-TAAGCTCCTGGGGATTCAC-39) and ERIC2 (59-AAGTAA-GTGACTGGGGTGAGCG-39).
Pulsed Field Gel Electrophoresis (PFGE) and analysis of strain relatedness
One hundred and ten pathogenic isolates from 11 patients (3, 5, 8, 11, 12, 13, 14, 15, 16, 17 and 19) in whom strain heterogeneity was observed in the antibiotypes and/or phylogenetic group/ subgroups and/or virulence gene patterns and/or ERIC patterns, were further studied by PFGE. As previously described [68], PFGE was performed after digestion of chromosomal DNA with XbaI, which gave a convenient number of fragments. These fragments were separated in 0.5 X TBE buffer, pH 8.0, at 14uC and 6 V/cm with pulse times of 5–50 s for 21 h. DNA patterns obtained were analysed with Gel Compar software (Applied Maths, Kortrijk, Belgium). A similarity matrix was created by using the band-based Dice similarity coefficient, and Ward’s algorithm was used to cluster the strains.
Multi Locus Sequence Typing (MLST)
MLST analysis based on the concatenated sequences of 6 essential genes (trpA, trpB, pabB, putP, icd and polB) [26] was performed in some cases to determine the relatedness between the isolates. In addition, the sequence of gnd, one of the most variable gene in E. coli due to a high level of recombination [30], was occasionally performed to further discriminate isolates.
Antibiotic susceptibility
Antimicrobial susceptibilities were determined on all the pathogenic and commensal isolates by the method of disc diffusion, according to the guidelines of European Committee for Antimicrobial Susceptibility Testing (www.eucast.org). The tested resistance markers were as follow: amoxicillin (AMX), amoxicillin-clavulanate, ticarcillin (TIC), piperacillin (PIP), piper-acillin-tazobactam, imipenem, cefalotin (Cf), cefamandole, cefur-oxime, cefoxitin, cefotaxime, ceftazidime, cefepime, aztreonam, mecillinam, streptomycin (St), kanamycin (Ka), gentamicin, tobramycin, netilmicin, amikacin, tetracycline (Te), minocycline (Mn), nalidixic acid (Na), pefloxacin, ciprofloxacin, chloramphen-icol (Ch), fosfomycin, sulfonamides (Sul), trimethoprim (TMP). MICs were determined by the E-test method (AB Biodisk, Solna, Sweden) as recommended by the manufacturer. The production of penicillinase (Pase) was deduced from the resistance profile (resistance to amoxicillin, ticarcillin, piperacillin and intermediate susceptibility to amoxicillin-clavulanate, piperacillin-tazobactam and cefalotin) and confirmed by the detection of blaTEMby specific PCR amplification as previously described [69].
Outer membrane permeability
The isolates of patient 17 were electroporated with the plasmid pBR322 to introduce high levels of b-lactamase into all strains. Outer membrane permeability was measured by comparing b-lactamase activity in whole cells (with intact outer membrane) to that in disrupted cells with no barrier, using the permeable colorimetric substrate nitrocefin [70]. Bacterial strains were grown to exponential phase at 37uC in Luria-Bertani (LB) broth without salt containing either 100mg/ml ampicillin or 15mg/ml tetracycline. The optical density of the culture was measured and two 100ml samples were taken. One aliquot (whole cells) was washed once, resuspended in the same volume of 0.16 M9 and the second aliquot was centrifuged and resuspended in 30% sucrose, 33 mM Tris. 5ml 2 mg/ml lysozyme and 5ml 0.2M EDTA and the mixture placed on ice for 15 min. Lysed bacteria were centrifuged for 5 min at 4uC, the pellet discarded and 3ml 1M MgCl2added to the supernatant. The broken cells and whole cells were assayed in 96 well micro titre plates with each well
containing 160ml 0.16M9, 20ml 50mg/ml nitrocefin and 20ml of the sample. The 96 well plate reader was configured for kinetics at 492nm for 20 min with readings taken every 2 min. The activity of the broken cells was very similar and quadruple assays were used to generate the values plotted in Fig. 3C. The activity is presented as the rate of optical density change/min/cell in the assay.
Bacterial growth
Cells grown overnight in LB broth were washed and transferred into a fresh LB medium at a dilution of 1:250. The growth rates were then measured for all the pathogenic and commensal isolates at 37uC by monitoring the optical density at 600 nm (Tecan microplate reader) in LB medium. Experiments were repeated 3 times.
Carbon source utilisation
Biolog GN2 (Biolog, Inc., Hayward, CA) microplates were used to detect carbon utilization of 95 substrates in isolates of patients where a micro-heterogeneity was observed. Utilization of various C sources is coupled to reduction of a tetrazolium dye and production of purple colour [38]. Each strain was grown in LB medium, washed and resuspended to an optical density at 600 nm of 0.01 in mineral medium. Mineral medium was prepared as described elsewhere [38]. Plates were incubated at 37uC and colour changes were measured by optical density measurement (Tecan microplate reader) at a wavelength of 600 nm. The cut off point between negative results and positive results was an optical density of 0.2. Experiments were repeated 2 times. For the statistical analysis, the data considered were, for each isolate, the number of used substrates.
Hydrogen peroxide sensitivity
Bacterial isolates from patients showing differences in the growth kinetic were grown overnight in LB, washed, and resuspended in 0.9% NaCl to a concentration of about 1.108cells ml-1. H2O2 was added to a final concentration of 50 mM. Aliquots of bacteria were removed at timed intervals, and numbers of viable cells were determined on LB plates. For the statistical analysis, only two categories were considered (resistant or sensitive). To delimit in categories the 8 isolates of patient 3, area between curves was used as a distance in order to compare curves. A k-means approach (two seeds, i.e. two clusters) on such distance matrix allows an automatic separation of clusters. As a control for the choice of the number of clusters, we represented these curves (according to the described distances) as points in a two dimensional Euclidean space thanks to an effective non-linear multidimensional algorithm named Data Driven High Dimen-sional Scaling (DD-HDS) [71]. Two clusters (categories) can be considered as fair.
Acid sensitivity
To assess the acid sensitivity phenotype of the isolates from patients showing differences in the growth kinetic, we used a protocol previously described [72] with some minor modifications. An inoculum containing about 108 cells from an overnight LB culture was introduced into LB acidified with HCl (35%) to pH 2.5. After two hours of exposure to pH 2.5, surviving cells were counted and the percentage of survivor was calculated. Strains which exhibited greater than 10% survival were designed acid resistant (low sensitivity), strains with 0.1% to 10% were designed intermediate in acid sensitivity, and those with less than 0.1% survival were considered acid sensitive (high sensitivity).
Motility
Cells of isolates from patients showing differences in the growth kinetic were grown overnight in LB, washed, and resuspended in minimum media (PO4 acetate) to a concentration of 1.10
2 cells ml21. About 10 cells were grown in standard Petri dishes containing 20 ml minimum (PO4 acetate) media with 10mM glucose, solidified with 0.35% agar. Swim plates were incubated 48 hours at 37uC in humid atmosphere. Experiments were repeated 2 times. For the statistical analysis, only two categories were considered (motile or non motile).
Rdar morphotype
Cells of isolates from patients showing differences in the growth kinetic were grown on LB agar plates without NaCl (LB0) at 28uC. We determined colony morphology and colour using LB0 agar supplemented with Congo red (40mg.ml-1) and Coomassie brilliant blue (20mg.ml-1), as described previously [41].
Iodine staining
Level of RpoS was obtained in 8 selected isolates of patient 3 by staining colonies on LB agar plates. Plates were incubated for 24 hours at 37uC and then left at 4uC for 20 hours before being flooded with Lugol (I2 concentration = 10g.L21). Iodine staining is dependent on glycogen, whose synthesis is affected by RpoS [73]. Dark-brown colonies correspond to a high level of RpoS. A control corresponding to E. coli MG1655 DrpoS strain was used. Experiments were repeated 2 times. For the statistical analysis, a scale from 1 to 5 depending on the darkness was used.
RpoS immunoblot
Cells were harvested in stationary phase after 18 hours of culture in LB at 37uC, and proteins were extracted in SDS 1% at 100uC for 10 min. Protein concentration was measured by the method of Bradford (DC protein assay, Bio-Rad). SDS-PAGE was carried out in 10% polyacrylamide minigels (Mini Protean II; Bio-Rad). 10mg of total proteins was loaded into each lane. The proteins were transferred to Amersham Hybond-P mem-brane (GE Healthcare) with a Mini TransBlot cell (Bio-Rad) in transfer buffer (25 mM Tris [pH 8.2], 192 mM glycine, 20% [vol/vol] ethanol). Western blot analysis was performed by serially incubating the membrane with polyclonal rabbit antibodies against the sS protein [74] overnight (1:150000), and Amersham ECL anti-rabbit IgG (GE Healthcare), for one hour (1/20000). The RpoS protein was visualized using the Amersham ECL Plus Western Blotting Detection System (GE Healthcare). Quantifications were performed using a Phosphor-Imager (Molecular Dynamics). Data correspond to the ratio of the RpoS signal to a constant cross-reactive band. A control corresponding to E. coli MG1655 DrpoS strain was used. Experiments were repeated 2 times, values are the mean of the two experiments.
rpoS gene and promoter sequencing
DNA was prepared from 8 selected isolates of patient 3 using the Wizard Genomic DNA purification Kit (Promega). Two PCR products (product 1: primer forward ACAAGGGGAAATCCG-TAAACC; primer reverse AGGATTTCGCGCAAACG, length: 1059 bp, and product 2: primer forward CCGTACTAT-TCGTTTCGGCCGA; primer reverse GAGACTGGCCTT-TCTGACAG, length: 536 bp) were used to obtain the sequence of the rpoS gene and its promoter. Sequencing of PCR products was performed on both strands by classical Sanger technology.