DESALINATION
OF
WATER
BY
VAPOR TRANSPORT
THROUGH
"'HYDROPHOBIC
NANOPORES
MASSACHUSETS INS0lVTEOF TECHNOLOGY
BY
OCT 16 2014
JONGHO LEE
LIBRARIES
BACHELOR OF SCIENCE, MECHANICAL AND AEROSPACE ENGINEERING
SEOUL NATIONAL UNIVERSITY, 2003
MASTER OF SCIENCE, MECHANICAL AND AEROSPACE ENGINEERING SEOUL NATIONAL UNIVERSITY, 2007
SUBMITTED TO THE DEPARTMENT OF MECHANICAL ENGINEERING IN PARTIAL FULLFILMENT OF THE REQUIREMENTS FOR THE DEGREE OF
DOCTOR OF PHILOSOPHY IN MECHANICAL ENGINEERING
AT THE
MASSACHUSETTS ISTTITUTE OF TECHNOLOGY
SEPTEMBER 2014
C MASSACHUSETTS INSTITUTE OF TECHNOLOGY, 2014. ALL RIGHTS RESERVED.
Signature redacted
SIGNATURE OF AUTHOR... - -EJoNGHo LEE
DEPARTMENT OF MECHANICAL ENGINEERING
JULY
31,2014
Signature redacted
CERTIFIED BY...
ROHIT N. KARNIK ASSOCIATE PROFESSOR, MECHANICAL ENGINEERING THESIS SUPERVISOR
ACCEPTED BY...Signature
redacted
DAVID E.
HARDTPROFESSOR, MECHANICAL ENGINEERING CHAIRMAN, DEPARTMENT COMMITTEE ON GRADUATE STUDENTS
DESALINATION OF WATER BY VAPOR TRANSPORT THROUGH HYDROPHOBIC NANOPORES
BY
JONGHO LEE
Submitted to the Department of Mechanical Engineering
on July 31, 2014 in Partial Fulfillment of the
Requirements for the Degree of Doctor of Philosophy in Mechanical Engineering
Abstract
Although Reverse osmosis (RO) is the state-of-the-art desalination technology, it still suffers from persistent drawbacks including low permeate flux, low selectivity for non-ionic species, and lack of resistance to chlorine. This leaves ample rooms. for further improvement for RO technology by addressing these issues.
In this thesis, a new approach is proposed for desalination by vapor-phase transport through
hydrophobic nanopores in an isothermal condition. Hydrophobic nanopores flanked by
vapor-interfaces with a submicron gap provide a complete barrier for salt while behaving as highly permeable medium for water.
We first theoretically explore transport of water through a hydrophobic nanopore using a probabilistic model that incorporates rarefied gas dynamics, ballistic transport, and emission and reflection of water molecules at liquid-vapor interfaces. We then expand the model to transition regime where molecular diffusion coexists with the rarified gas transport. Effect of nanopore geometry, salinity, temperature, applied pressure, and interfacial reflection probability on the transport of water molecules through the nanopore are explored. We further realize membranes consisting of hydrophobic nanopores to experimentally study the transport with the various above-mentioned conditions.
We find the existence of two mass transport regimes, i.e., diffusion-governed and interface-governed transport, determined by interplay between transmission across the nanopores and condensation at the interfaces. The condensation resistance, represented by condensation coefficient, was experimentally measured. An accurate value of the condensation coefficient was estimated accordingly, which has been debated more than a century.
Based on this finding, the proposed approach is expected to produce up to -2x higher permeate flux at 50*C and with porosity of 40% than conventional RO. This approach further decouples transport properties from membrane material properties, thereby opening the possibility of engineering membranes with appropriate materials that may lead to reverse osmosis membranes with improved flux, better selectivity, and high chlorine resistance allowing for inexpensive and simple fouling control.
Thesis Supervisor: Rohit Karnik
Acknowledgement
I came to Cambridge on August 2008, both with curiosity and anxiety for a totally new experience in a foreign country. The first thing that I encountered was a huge language barrier, which was much more overwhelming than I expected. Nevertheless, the first impression I received from my advisor Professor Rohit Karnik gave me much comfort and confidence for my academic life in MIT. He was very kind, gentle, and talked with a bit shy voice. From the first meeting, I got a feeling that I might be able to do well in MIT working with him. He was always supportive and tried to teach me better, and gave guidance in research directions. Especially, I truly appreciate that he walked with me having a language barrier in initial years. Although I heard many people say that there are a number of smart people in the world, I have never seen with my eyes such an intelligent person along with a gentle and humble personality. I believe that
I was tremendously lucky to have him as my advisor. His curiosity in science along with his kind
and warm attitude toward students and people made me have him as my role model in academia. I thank all friends in the lab for their kindness and friendship. Suman, my best friend, sometimes looks like a ten years old kid inclined to do prank all the time, and also sometimes speaks like sixty years old man talking on career, life, and even love affair. I thank him for his friendship and fun moments we shared - including trips to Niagara fall, Martha's vineyard, Cape Cod, etc. I wish I had been to more conferences with him other than Gordon Research Conference. Marco
-I like and respect his weird and also philanthropistic philosophy. He is always ready to help people including me even by postponing and sacrificing his priority. I always liked his funny but very thoughtful comments on topics I brought up. Sean - I like his frankness. Even though he looks serious in the first glance, I found Sean has a very fun character. So I always enjoyed conversation with him on various topics. Especially, because Sean was a perfect representative of Americans to me, it was always amusing to discuss with him on cultural, political or structural differences between my country and US. Tarun - he is a very weird philosopher and physicist in
our lab. As I have been aiming for academia, I have always admired his adventurous spirit,
entrepreneurship, and courage for not worrying about near future. We would be short-term
roommates in San Diego and Netherlands and I really enjoyed our conversations on universe,
science, futures, etc. Mike - I admire his integrity, honesty, and diligence. But more than that, he
is a very fun and friendly guy to hang out, equipped with excellent cynical jokes and comments.
He and I made a good team for xylem project, finishing all necessary experiments in several days
only. That would be my shortest but most reliable co-working. Chia - always quiet and shy girl, I
remember that we had many discussions on similarity and difference between Taiwan and Korea.
I was also extremely happy to see she is married and has a happy life in Connecticut. Jason - I
don't think his love toward baseball will change ever as opposed to me who fell asleep in Fenway
stadium during the match of Red Sox and Yankees. Sunandini - who always smiles and also has a
fun and charming character, her group meeting presentation was always interesting to me.
Jongmin - who never hurries and is calmed, I always hear about Korean academia news from him.
As a father of two children, I have to learn more from him. Sungyoung is a solid and disciplined
researcher, and I believe that he is one of the best experimentalists. I really wish for his successful
career in academia, and I was happy to see he enjoys his research in Korea, having a happy
family life. I also miss Cameron, Chong, Ricardo, and Ben who used to work in our lab for 8
months as co-op students from Waterloo. They were the smartest and dedicated undergrad
students I have ever seen, and also fun young guys. I hope that they are going to use their young
energy and passion on their bright futures.
Outside the lab, I also thank many other friends. Especially, Amith who started from my
pingpong and tea mate in Mathematics department lounge, I am proud of him that he went
through and overcame all hardships in MIT and I believe that he will be a great PhD in the end. I
truly appreciate his friendship and sharing. Tom, as another membrane brother, and I shared a lot
the other of us also failed. I am proud that we both made the work happen, and received PhD together. I also thank my Korean friends, especially Hyunglae Lee, Won Kim, Kyoochul Park, and Jessie Jeon, who came to MIT with me on the year of 2008. I remember that we frequently shared our joys, excitements, worries, and frustration on our totally new circumstances, and we got help from each other a lot. Since I am the one who graduated latest, Hyunglae, Kyoochul, and Jessie as post-docs are now pursuing academic career and I give my best wish for their successful and happy lives and careers.
I cannot miss my family - my father, mother, and sister - who always pray for me and support me. I still remember the day I received admission from MIT, my father and mother were so happy and excited. Although my parents, especially my father, sometimes had a burdensome expectation on me, I appreciate that they now simply wish my happy family life. My sister, who always was proud of having a so-called smart brother, I honestly think that she is much smarter and wiser than me, and I admire her courage and persistence that I do not have. I want to say that
I really love my father, mother, and my sister.
Lastly, Cambridge is a very special place to me, not because it is the first place I live in a foreign country, but because I met my wife Jeehye here. She is always lovely, adorable, cheerful, and adventurous. She never hesitates to share her emotions, love, and sorrow. I believe that my shy and passive nature has been affected and changed by her presence and character. She made my life fun, dynamic, rich and lovely. I truly appreciate that God allowed me to come to Cambridge and marry her, and to walk with her through our academic and emotional hardships and share our daily adventures and joys, and finally to have my lovely daughter Sohahn. I want to show my love to her and my daughter in this page again.
I want to thank all other friends and people whom I couldn't mention here, who always supported and prayed for me to finish this journey. I again thank God for privileging me to meet these
wonderful people and for the exotic and astonishing life in Cambridge he prepared. I pray to Him
Contents
CHAPTER 1. INTRODUCTION ... 21
1.1. BACKGROUND AND MOTIVATION ... 21
CHAPTER 2. THEORETICAL INVESTIGATION OF VAPOR PHASE TRANSPORT OF WATER THROUGH HYDROPHOBIC NANOPORES ... 25
2.1. CONCEPT OF VAPOR TRAPPING MEMBRANE FOR DESALINATION ... 25
2.2. MICROSCOPIC PICTURE OF WATER TRANSPORT ACROSS LIQUID/VAPOR INTERFACE ... 28
2.3. PROBABILITY OF MOLECULAR TRANSPORT ACROSS A NANOPORE... 29
2.4. DERIVATION OF MASS FLUX ACROSS THE NANOPORES ... 33
2.4.1. Change in equilibrium vapor pressure ... 33
2.4.2. Derivation of mass flux based on probabilistic framework... 36
2.4.3. Heat transfer analogy for calculation of transport through the nanopore... 37
2.5. CHARACTERISTICS OF VAPOR-PHASE TRANSPORT THROUGH A NANOPORE ... 39
2.6. CRITERIA FOR WETTING OF A HYDROPHOBIC NANOPORE ... 44
2.7. MASS FLUX THROUGH A MEMBRANE INCORPORATING VAPOR-TRAPPING NANOPORES .47 CHAPTER 3. FABRICATION OF MEMBRANES... 51
3.1. CREATION OF SHORT HYDROPHOBIC NANOPORES... 51
3.1.1. F abrication approach... 51
3.1.2. Effect of annealing ... 55
3.1.3. Effect of ammonium hydroxide ... 56
3.2. VERIFICATION OF SHORT HYDROPHOBIC NANOPORES ... 57
3.3. M EASUREMENT OF DEFECT RATES ... 59
CHAPTER 4. CHARACTERIZATION OF VAPOR-PHASE TRANSPORT USING
FORWARD OSMOSIS EXPERIMENTS... 63
4.1. EXPERIM ENTAL SETUP... 64
4.1.1. Forward osm osis... 64
4.1.2. Estimation ofpressure inside nanopores... 65
4.2. VERIFICATION OF VAPOR-PHASE TRANSPORT ... 66
4.3. EFFECT OF PORE LENGTH ON WATER TRANSPORT ... 68
4.3.1. Behavior of mass flux for different pore aspect ratios... 68
4.3.2. Derivation of transmission probability for water molecules in a non-rarified condition (D usty-gas model)... 70
4.3.3. M ass flux for large AR ... 75
4.3.4. M ass flux for small AR ... 76
4.4. EFFECT OF INTERFACIAL RESISTANCE ON WATER TRANSPORT ... 77
4.5. REVISIT CONDENSATION COEFFICIENT OF WATER... 80
4.5.1. Literature on estimation of condensation coefficient... 80
4.5.2. Estimation of condensation coefficient based on transport through submicron length of hydrophobic nanopores ... 84
4.6. EFFECT OF CONCENTRATIONS AND TYPE OF SALT ON CONDENSATION COEFFICIENTS ... 87
4.7. EFFECT OF NON-CONDENSABLE GAS ON CONDENSATION OF WATER... 89
CHAPTER 5. CONCLUSION ... 91
5. 1. SU M M A R Y ... 9 1 5.2. LARGE SCALE MEMBRANE FABRICATION FOR RO APPLICATIONS ... 93
5.3. BORON REJECTION ... 95
A. EFFECT OF MENISCUS CURVATURE ON THE TRANSMISSION PROBABILITY ... 99
B. TEMPERATURE DIFFERENCE ACROSS A MEMBRANE INCORPORATING VAPOR-TRAPPING N AN OPO RES ... 10 1 C. ESTIMATION OF AVERAGE ASPECT RATIO ... 102
D. ESTIMATION OF THE CONDENSATION COEFFICIENT ... 104
E. ALTERNATIVE FABRICATION METHOD FOR SHORT HYDROPHOBIC NANOPORES... 109
F. ALTERNATIVE DEFECT CHARACTERIZATION METHOD ... 111
List of Figures
Figure 1. Schematic diagram of a hydrophobic nanopore with liquid-vapor interfaces on either side. Application of pressure greater than the osmotic pressure on the saline water side results in vapor-phase transport of water across the nanopore.
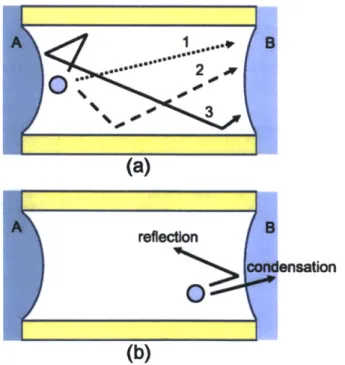
Figure 2. Schematic diagram showing some potential trajectories of molecules inside the nanopore. (a) trajectories the molecule takes from meniscus A to B. (1) meniscus A meniscus B (ballistic transport), (2) meniscus A -+ wall -+ meniscus B, (3) meniscus A -+
wall -- meniscus A -+ wall -+ meniscus B; (b) Upon reaching meniscus B, the molecule can either condense or undergo reflection.
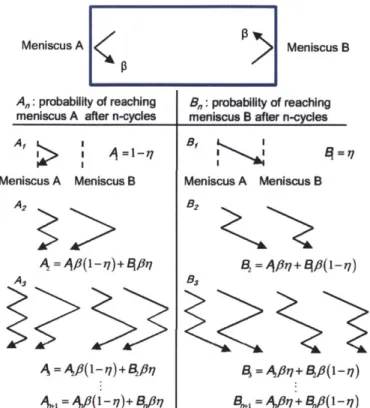
Figure 3. Possible paths and probabilities of molecules emitted from meniscus A until they condense at either meniscus A or B. In the arrow diagrams, the leftmost position indicates meniscus A, the center position indicates scattering from the pore walls, and the rightmost position indicates meniscus B. For example, in the diagram for A2, the molecule that leaves
meniscus A can arrive at meniscus A (after scattering from the pore walls), be reflected from the meniscus A, and arrive again at A by a similar process (left), or the molecule emitted from A can reach meniscus B, be reflected from meniscus B, and arrive at meniscus A
(right).
Figure 4. Probability of transmission of a molecule across a cylindrical nanopore with length I and radius a (from Berman5 1).
Figure 5. Configuration of mass transport resistances from analogy with radiation heat transfer Figure 6. (a) Specific ratio of theoretical maximum mass flux to driving pressure at different
temperatures. & = 1 is assumed to consider nanopore area only. (b) Net mass flux normalized by theoretical maximum mass flux through a nanopore. The theoretical maximum mass flux indicates the mass flux for a = 1 and I/a = 0 (7 = 1). (c) Variation of
(PA,B with q and a. The scale bar on the top of (c) represents the pore aspect ratio Il/a
corresponding to P7.
Figure 7. Effect of pore aspect ratio I/a and condensation coefficient a on the mass flux through the pore per unit driving pressure at different temperatures. 6 = 1 is assumed to consider
nanopore area only. (a) a = 0.5; (b) a = 1.0; (c) I/a = 5; (d) I/a = 100.
Figure 8. Detailed configuration of liquid-vapor interface at the feed side. 6,q denotes equilibrium
contact angle satisfying Young-Laplace equation (ysl-ys,+yivcos O,=O), and 6 denotes the angle between a line tangential to interface and pore axis, which satisfies mechanical force
equilibrium.
Figure 9. Minimum pore length that makes pore wetting energetically unfavorable at different values of the applied pressure and pore radius. Contact angle of 120*, NaCl concentration of
0.62M, and temperature of 20*C are assumed.
Figure 10. Predicted mass flux through membrane for different pore sizes and driving pressures at the minimum pore aspect ratio I/a which makes wetting thermodynamically unfavorable. Contact angle of 120*, NaCl concentration of 0.62 M, and 40% membrane porosity are assumed. (a) T= 20*C, a= 0.5; (b) T = 50*C, o= 0.5; (c) T = 20*C, o= 1.0; (d) T= 50*C, a =
1.0.
Figure 11. Fabrication of osmosis membranes with nanoscale vapor traps. a, Schematic illustration of membrane with short hydrophobic nanopores that trap vapor. b, Schematic of fabrication processes. i) porous alumina membrane soaked with photoresist AZ5214, ii) solvent evaporation on hot plate, iii) air plasma treatment for photoresist etching, iv) silanization on exposed alumina surface with perfluorodecyltrichlorosilane (FDTS), v) removal of residual photoresist. c, The fabricated membranes have a hydrophobic top surface (left) and hydrophilic bottom surface (right). d, SEM images of cross-section of
nanopores after no plasma treatment (left), 2 h (middle), 9 h (right) of treatment, illustrating control of pore length for hydrophobic modification. Scale bar is 300 nm. e, SEM image of membrane after 2 h plasma treatment. Scale bar is 500 nm. f, Photoresist etch depth for different plasma treatment periods. Error bars represent +S.D.
Figure 12. Aspect ratio (AR) distribution of nanopores after plasma treatment for different time periods.
Figure 13. a, b SEM images of bare (a) and annealed (b) alumina membrane surface after dipping
in boiling water for 2 h. Scale bar is 2 pm in (a) and 400 nm (b), respectively. c, d XRD
spectrum for bare (c) and annealed (d) alumina membranes. Bare alumina reveals amorphous form while annealed one shows y-alumina. Circles indicate peaks of Y-alumina. Figure 14. Photographs of hydrophilic side surface of membrane and water droplets on the
surface before (a, c) and after (b, d) UV exposure and rinsing with ammonium hydroxide solution. The droplet completely spreads on the hydrophilic side after the treatment (d). Figure 15. Verification of membrane integrity. a, SEM images of cross-section of nanopores after
2 h plasma treatment (left) and after immersion of the fabricated membrane in 3 mn gold nanoparticle solution (right) show co-localization of the nanoparticles with the extent of photoresist etching. Scale bar is 200 nm. b, Confocal microscopy of the membrane exposed to two different fluorescence dye solutions (Alexa 633 and Alexa 488 in deionized water) on either sides of membrane reveals a distinct interface with lack of mixing. Scale bar is 5
sm.
c, Environmental SEM image of fabricated membrane showing hydrophilic and hydrophobic
surfaces. Arrow indicates the non-wetted region appearing as a thin line corresponding to the
hydrophobic modification. Scale bar is 100 pm.
Figure 16. a, Schematic diagram of setup for impedance measurement. Electrical potential is given V = Vo sin (24ft) with Vo = 20 mV,f= 50 mHz. b, Example of current profile for bare
alumina membrane without any treatment, fabricated membrane with hydrophobic
nanopores made with 1 h and 18 h plasma etching, respectively.
Figure 17. a, Resistance change with time for a membrane with hydrophobic nanopores made by
12 h plasma etching. b, Variation of the defect rate (i.e. fraction of wetted pores) with time.
Figure 18. a, Schematic diagram of forward osmosis experiment setup. The deionized water in the
right diffusion cell is drawn to the other cell with draw solution (KCI). Magnetic stir bars
enhance mixing of solutions and minimize concentration polarization. b, Measured mass
flux through a membrane for different osmotic pressure differences using 0.2, 0.5, 1, 1.5,
and 2 M KCl as draw solutions, at a temperature of 25*C. Red dotted line is drawn as a
guide for the eyes. Error bars represent S.D. for three different measurements on one
membrane.
Figure 19. a, Forward osmosis experimental setup with diffusion cells containig IM KCl draw
solution (left) and 2mM Allura Red dy in DI water (right). b, UV-vis spectra show rejection
of Allura Red dye. Black, 1 M KCl solution; red, Allura Red solution in 1 M KCl assuming
zero rejection of dye mimicking how the draw solution would look if water were transported
without dye rejection; blue, actual draw solution. d, 2 mM Allura Red solution in deionized
water drawn across the membrane by the draw solution (left), Allura Red solution in 1 M
KCl assuming zero rejection of dye mimicking how the draw solution would look if water
were transported without dye rejection (middle), actual solution in draw solution cell after
experiment showing dye rejection (right).
Figure 20. Scaling behaviour of the measured water flux. a, Schematic of resistance models for
"short" and "long" nanopores. Ri, interfacial resistance; R,, transmission resistance; Rh,
hydrodynamic resistance. b, Variation of mass flux with AR for different KCl concentrations
deviates from the solid line 2.12/AR corresponding to an inverse scaling expected in the case of long pores, plotted for pressure inside nanopore, p, of 0.5 bar. The shaded area indicates the possible range corresponding to 0.2 sp < 0.8 bar (See Section 4.1.2).
Figure 21. Transmission probability t79O' 99 for Knudsen regime and modified transmission probability r/a for viscous regime. a = 40 nm, M = 1.8 x 10⁻² kg/mol, T = 300 K, D12 = 2.56
x 10-5 m2
/s and p = 1 bar are used for the calculation
Figure 22. a, Dependence of the measured mass flux on temperature for AR = 42.1+2. 1. b, Temperature dependence of total resistance for "long" pores with AR of 42.1 2.1 and for "short" pores with AR of 9.6+:0.7. Dotted lines are linear fits to data averages to guide the eyes. Vertical error bars in all panels represent S.D. corresponding to measurements on 3 to
5 different membranes for each data point. Horizontal error bars in all panels represent S.D.
for AR as described in Appendix D.
Figure 23. Regime of interface-governed transport. a, Mass flux normalized by the maximum mass flux corresponding to zero interfacial resistance (R, = 0) for different concentrations of
draw solution reveals a marked departure at smaller aspect ratios. Temperature is
39.0 0.3 *C. Green line indicates ideal normalized flux for o = 1 as a guide for the eyes. Black dotted line denotes the theoretically predicted normalized mass flux for a condensation coefficient of 0.23. b, Ratio of interface resistance to transmission resistance for different AR at a temperature of 39.0 0.3 'C, obtained from data shown in panel a. Vertical error bars in all panels represent uncertainty combining S.D. of data points and the effect of uncertainty in pressure inside the nanopores, p (See Appendix D). Each data point was obtained from measurements on 3 to 5 different membranes. Horizontal error bars in all panels represent +S.D. for AR as described in Appendix D.
Figure 24. Estimated condensation coefficients for different AR at a temperature of 39.0 0.3 *C, obtained from data shown in Figure 23 panel a (c) and for different temperatures, obtained
from flux measurements on membranes with AR of 9.6 0.7 (d). Vertical error bars in all panels represent uncertainty combining S.D. of data points and the effect of uncertainty in pressure inside the nanopores, p (See Appendix D). Each data point was obtained from measurements on 3 to 5 different membranes. Horizontal error bars in all panels represent
S.D. for AR as described in Appendix D.
Figure 25. Effect of salt concentration on condensation coefficients. Nanopores with average aspect ratio of 11.0 were used at 25*C. a, Mass flux for different KCl concentrations, normalized by membrane porosity and by difference of evaporation rate across the membrane; b, Estimated condensation coefficients from the measured mass flux. The error bars denote S.D. including the effect of uncertainty in pressure inside the nanopores, p (See
Appendix D).
Figure 26. Effect of interchanging of halogen ions on condensation coefficients. Nanopores with average aspect ratio of 8.5 were used with draw solutions of 0.5 M KCl and 0.5 M KI, respectively, at 30*C. a, Mass flux for different KCI concentrations, normalized by membrane porosity and by difference of evaporation rates across the membrane; b, Estimated condensation coefficients from the measured mass flux. The error bars denote
S.D. including the effect of uncertainty in pressure inside the nanopores, p (See Appendix D). The condensation coefficients from KC1 and KI are not significantly different based on
the Student t-test (p value > 0.05).
Figure 27. Resistance networks for estimating the effect of meniscus curvature on transmission probability using the radiation heat transfer analogy. A,, A,, A, and A, denote the area of cross section of pore, pore wall, menisci at feed and permeate sides, respectively. F, and F, indicate view factors between the two menisci, and a meniscus and the pore wall, respectively, for flat interfaces. F,, Ff, and F,, denote view factors between the menisci at
meniscus at permeate side and the pore wall, respectively, assuming that the meniscus on the feed side is curved (maximum possible curvature at a contact angle of 1200) and that on the permeate side is flat. F, and F, indicate view factors between the two menisci, and from a meniscus to the pore wall, respectively, for flat interfaces. Fk,, Ff, and F,, denote view factors from the meniscus on the feed side to that on the permeate side, from the meniscus on the feed side to the pore wall, and from the meniscus on the permeate side to the pore wall, respectively, assuming that the meniscus on the feed side is curved (maximum possible curvature at a contact angle of 1200) while that on the permeate side is flat.
Figure 28. Decrease in vapor pressure difference across a membrane with thermal conductivity of
0.27 W/m-K. Applied pressure of 50 bar, temperature of 50*C, NaCl concentration of 0.62
M, condensation probability of 1.0, and porosity of 40% are assumed. Dashed line indicates the vapor pressure difference variation at minimum aspect ratio (l/a)min.
Figure 29. Effect of air pressure inside the nanopores. a, b, c Mass flux normalized by that with zero interface resistance for (a) p = 0 0.0 bar; (b) p = 0.5 0.3 bar; (c) p = 1 0.0 bar. d, e, f
Ratio of Ri and R, for different aspect ratios with (d) p = 0 0.0 bar; (e) p = 0.5 0.3 bar; (f) p
= 1 0.0 bar. g, h, i Estimated condensation coefficients for different aspect ratios with (g) p = 0 0.0 bar; (h) p = 0.5 0.3 bar; (i) p = 1 0.0 bar.
j,
k, 1, Estimated condensationcoefficients for different temperatures with (j) p = 0 0.0 bar; (k) p = 0.5 0.3 bar; (1) p =
1 0.0 bar.
Figure 30. Fabrication method using alkanethiol self-assembled monolayers. a, E-beam evaporation of gold on rotating membrane with an angle 0. b, Schematic diagram of self-assembled monolayers formed based on thiol-gold bonding. c, Water droplet on the fabricated membrane
Figure 31. Defect characterization using Fluo-4. a, Schematic diagram of setup with a membrane.
placed under AC electric field. b, Snapshot of the experimental setup on fluorescence
microscope. c, Fluorescence image of 'leaky' membrane. d, Corresponding Fourier
transformed map for fluorescence light intensity. e, Fluorescence image of 'low defect'
membrane. f, Corresponding Fourier transformed map for fluorescence light intensity. g,
Time trace of fluorescence light intensity normalized by a maximum intensity at a specific
Chapter 1.
Introduction
1.1.
Background and motivation
The increasing demand and depleting resources of water have worsened the fresh water scarcity problem, and the number of people facing water shortage is expected to quadruple by 20251. The scarcity of fresh water is expected to become more serious in developing countries where many diseases and deaths are attributed to the poor quality of wat2, and also in Middle East and North
23
African countries that are suffering from lack of renewable fresh water'
In addition, the projected 40-50% growth in human population over the next 50 years, coupled with industrialization and urbanization, will result in an increasing demand on the available water resources4. While economic use and recycling of water for human and animal consumption can mitigate the problem to some extent5, alternative sources of clean water are required to address this growing need. The fact that more than 97% of water in the world exists as a form of seawater or brackish water naturally leads to desalination as a promising alternative source of water. Currently, the source of feed water for desalination stems from seawater (58.9%), brackish water (21.2%), surface water and saline wastewater for the rest6
. The capacity of desalination is growing with rate of about 55% per year and is expected to reach 100 million m3 / day in 20156. Membrane-based reverse osmosis (RO), thermal-based multi-stage flash (MSF), and multi-effect distillation (MED) are currently the major desalination technologies and constitute over 90% of the global production of desalinated water6''. As of 2012, membrane processes account for 63.7% of the total desalination capacity and thermal-based processes for 34.2%6. MSF is the primary thermal-based desalination technology and it accounts for about 26% of current global desalination capacity6. In this method, feed saline water is introduced and evaporated by latent heat supplied, typically under vacuum to reduce the boiling temperature. The generated vapor condenses to be harvested as fresh water product, while the latent heat released during the
condensation is reused to preheat the feed water. Since the thermal evaporation occurs in
relatively high temperature > 90*C, there is a high chance of scaling formation which reduces
heat transfer coefficient, although this scaling problem in MSF is alleviated than MED2. In
addition, although a significant portion of energy is reused by the preheating and as a result 10
-20 times less energy than latent heat (-2,-200 kJ/kg) is actually needed, the thermal-based
desalination technologies such as MSF or MED still require significantly large amount of energy
compared to the thermodynamic minimum energy of separation for typical seawater (3.5 U per
kg of fresh water for 50% recovery)5. However, since the required energy is almost constant regardless of feed water salinity, the thermal-based approaches are economical and widely used in
Middle East Asia where the salinity of seawater is relatively high and the cost of heat energy is
also low2,8
Reverse osmosis (RO) is being increasingly adopted worldwide as an energy efficient technology
for water purification8. As of 2012, RO accounts for 63.7 % of the global desalination capability6.
In RO process, saline feed water is pressured against a semi-permeable membrane which allows
only water to pass while rejecting salts. Since the permeability and therefore production rate are
determined by the thickness of active selective layers, development of asymmetric membranes9
and polyamide composite membranes prepared by interfacial polymerization0' " have realized
submicron thickness of active layers (< 500 nm) and enabled RO to be competitive with thermal
processes for large-scale desalination applications. RO is more economical in the aspect of energy
cost compared to thermal processes that require more energy due to the latent heat of wate2
Membrane-based RO has almost reached thermodynamic efficiencies for desalination2. The
state-of-the-art RO plants requires less than 5.7 kJ/kg with recovery ratio of 42%5 while the
theoretical minimum energy based on 50% recovery is 3.5 kJ/kg. This high-energy efficiency is
primarily attributed to improvement of energy recovery units which utilize the rejected brine
issues including fouling, scaling, and requirement of large membrane areas due to limited flux,. Although chlorine is one of the simplest and most economical ways of controlling biofouling, polyamide - the most widely used selective RO membrane material - suffers from low tolerance to chlorine and therefore degrades by exposure to chlorine51". Low rate of boron rejection of RO process is also another issue and conventional RO systems rarely satisfy the boron concentration level that World Health Organization (WHO) guideline recommends (I mg/L or less)8
'"9. In practical RO applications, therefore, the permeate has been diluted with other source with lower boron concentration'9 or multi-stage RO systems at different pH's are often required to remove boron20. A large portion of boron exists as non-ionic boric acid at pH7 which is harder to remove while it becomes ionized at higher pH20. Although boron rejection at pH 11 reaches 98
- 99%,
operation at pH larger than 10 is not recommended due to salt precipitation which increases risk of scaling on membranes21. The cost involved in the multi-stage RO obviously could be reduced
by development of novel RO membranes capable of rejecting boron at neutral pH. Furthermore,
there is a trade-off between membrane area and efficiency due to the limited flux per unit area, and between selectivity and permeability, which is limited by material properties22
. Further improvements in RO membranes that enable larger flux without compromising selectivity and have increased resistance to fouling are therefore needed.
Advances in nanofluidics promise membranes with improved control over their nanostructure, better selectivity, or decreased viscous losses2 3-2 7. For example, membranes incorporating carbon nanotubes that allow flow of water with low viscous loss are being developed for desalination of water23,2 .New nanofluidic transport mechanisms thus have the potential to make a significant
impact on energy conversion and clean water technologies through development of better membranes. In this thesis, we suggest a new type of RO membrane that uses vapor-phase transport through hydrophobic nanopores for desalination of water. We first theoretically explore transport of water through a hydrophobic nanopore using a probabilistic model that incorporates
rarefied gas dynamics, ballistic transport, and emission and reflection of water molecules at
liquid-vapor interfaces. We then expand the model to transition regime where molecular diffusion
coexists with the rarified gas transport. Effect of nanopore geometry, salinity, temperature,
applied pressure, and interfacial reflection probability on the transport of water molecules through
the nanopore are explored. We further realize membranes consisting of hydrophobic nanopores to
experimentally study the transport with the various above-mentioned conditions. We show that
transport of vapor involved in two-phase flow at the nanoscale is determined by interplay
between diffusion across nanopores and evaporation/condensation resistances at the two-phase
interface. Finally, the significant potential of this new approach for desalination is shown and
Chapter 2.
Theoretical investigation of vapor phase transport of
water through hydrophobic nanopores
2.1.
Concept of vapor trapping membrane for desalination
We propose a membrane that consists of hydrophobic nanopores that trap vapor by virtue of their hydrophobicity and small size, separating the saline feed water on one side and the desalinated permeate water on the other side (Figure 1). Two water menisci are formed on either side of the pore and mass transfer occurs only in the form of evaporation at one meniscus, transport of water vapor through the nanopore, and condensation at the other meniscus. The salt concentrations and pressures on either side of the nanopore as well as the temperature determine the equilibrium vapor pressure at each meniscus. If a pressure that exceeds the osmotic pressure is applied on the feed water (saline) side, a vapor pressure difference is generated across the nanopore, resulting in a net flux of water across the pore through evaporation at one interface and condensation at the other interface. Since transport occurs in the vapor phase, the process is selective and only allows
membrane
feed
permeate
side
Z
side
Figure 1. Schematic diagram of a hydrophobic nanopore with liquid-vapor interfaces on either side. Application of pressure greater than the osmotic pressure on the saline water side results in vapor-phase transport of water across the nanopore.
water molecules to cross the nanopore. Furthermore, the nanopore is isothermal due to the small length scale and conduction through the nanopore wall material; thus energy required for evaporation is immediately recovered by condensation.
Transport of water vapor across a vapor-trapping membrane with water on either side has been used for desalination in a technique known as direct contact membrane distillation3
03 2. However,
this method relies on a temperature difference to drive transport of water, and is subject to high thermal losses and the actual temperature difference across the membrane is smaller than the bulk temperature difference due to temperature polarization. The present approach replaces the temperature difference by a pressure difference, thereby eliminating thermal losses and temperature polarization issues.
Generally, gas transport in a pore occurs by four different mechanisms: Knudsen diffusion,
3
(a)
retecdOn
-- ensaio 0(b)
Figure 2. Schematic diagram showing some potential trajectories of molecules inside the nanopore. (a) trajectories the molecule takes from meniscus A to B. (1) meniscus A -+ meniscus B (ballistic transport), (2) meniscus A -+ wall -+ meniscus B, (3) meniscus A -+ wall -+ meniscus A -+ wall -+ meniscus B; (b)
molecular diffusion, viscous flow, and surface diffusion33'
m. The applied pressure that should be
larger than osmotic pressure, i.e., 30 bar for seawater, necessitates small pore diameters less than
-50 nm to prevent wetting. Since the mean free path for water vapor at 20-50*C is about 1-5pm,
we assume that vapor-phase transport through the pores occurs primarily by Knudsen diffusion. Studies of wetting properties of carbon nanotubes show sharp transitions between non-wetted and wetted states2 4
, . In addition, the water vapor adsorption on pure hydrophobic surfaces such as silicalite-1 and beta zeolites is negligibly small36, 37. Membrane distillation which incorporates intrinsically hydrophobic porous membranes does not have severe wetting issues from water adsorption in the hydrophobic pores. Furthermore, adsorption of water molecules on hydrophobic surfaces is confined to hydrophilic defects3 8
-40; adsorption on such a defect and subsequent emission of a molecule is equivalent to a scattering event from the wall. When hydrophobic and hydrophilic surfaces are patterned in close proximity, it has been shown that water vapor condenses on the hydrophilic patterned sites in preference to the hydrophobic ones39
. Due to the small length scale of the nanopore, water vapor may be expected to condense on the menisci rather than on the pore surface. In this study, we therefore assume that transport of water through the nanopore by surface flow is negligible as compared to Knudsen diffusion. While Knudsen diffusion theory is known to be valid for the pore diameters down to 2 nm, 41 the classical Knudsen diffusion coefficient is defined only in the limit of an infinite pore length. The predicted Knudsen flux diverges to infinity as the pore length approaches zero; thus, calculation of flux in pores of finite length requires a different approach. Similarly, a model for transport through a hydrophobic pore must also consider the effects of the menisci.
In this chapter, we develop a general model based on a transmission probability framework that accounts for finite nanopore length, rates of evaporation and condensation, as well as reflection and condensation probabilities at the liquid-vapor interfaces (Figure 2).
2.2.
Microscopic picture of water transport across liquid/vapor interface
42-44 The condensation process of vapor molecules into liquid-phase can be explained by two steps The impinging vapor molecules are first adsorbed onto the surface and thermally equilibrate with the mean energy of liquid molecules at the surface. The fraction of the impinging molecules that achieve thermal equilibrium is called thermal accommodation coefficient. The experimentally measured values ranges between 0.745 and 1.042,46,47 although the majority of literature indicates that the thermal accommodation coefficient of water is likely to be unity. The adsorbed molecules are then either desorbed back to vapor-phase or absorbed into the liquid-phase. The fraction of the impinging vapor molecules that are converted to liquid-phase is called condensation coefficient (also called mass accommodation coefficient). The measurement of condensation coefficient of water has been much more challenging than the thermal accommodation coefficient. Although numerous experimental studies have been conducted to measure the condensation coefficient, the reported values are scattered over three orders of magnitude (0.001 - 1)4' 49. Extensive reviews
by Marek and Straub48 and Eames et al.49 concluded that the water surface free from any contamination and surfactants should have a relatively large value of condensation coefficient, and the values such as lower than 0.1 that have been experimentally measured seemed unlikely. As a rule of thumb, we take condensation coefficient of water between 0.5 and 1. One illustration based on thermal accommodation of unity and condensation coefficient of 0.7 as an example would be that although all vapor molecules impinging on the liquid/vapor interface adsorb and reach thermal equilibrium with the liquid surface, 30% of them return to vapor-phase and 70% condense. From the heat transfer point of view, 70% of the vapor molecules carry the latent heat to the liquid phase, while 30% of them also transfer some amount of heat by dissipating their kinetic energy during the thermal equilibration process.
2.3.
Probability of molecular transport across a nanopore
Let 9PA,B be defined as the probability that a molecule emitted (by evaporation) from meniscus A
condenses at meniscus B. If the rates of evaporation at each meniscus are known, the net flux of
water through the nanopore can be calculated in terms of AAB (which equals PB,A by symmetry). gAB can be further expressed in terms of two distinct probabilities: (a) ;7, the probability with
which a molecule that leaves one meniscus arrives at the other meniscus also known as the transmission probability, and (b) a, the condensation coefficient.
To calculate 9AB, we consider all possible ways in which a molecule emitted from meniscus A
finally condenses at either meniscus A or B (Figure 3). A molecule which has evaporated from meniscus A is transported to the other meniscus B with transmission probability q. This transmission probability includes the cases where the molecule arrives at meniscus B after collision(s) with the wall and without any collision with the pore wall. However, this molecule also can return to meniscus A with probability 1 - q after scattering from the wall. When a
molecule leaves one meniscus and arrives at the other meniscus or back to the same meniscus (after scattering event(s) from pore walls), we call the transport event as one "cycle". Therefore the molecule will reach either meniscus A or B after each cycle. This molecule will then condense with a probability a on the meniscus it arrived at, or be reflected with a probability # (= 1 - a). If the molecule is reflected from the meniscus A or B, it will start its flight again from the
meniscus it was reflected on. We define A, as the probability that a molecule emitted from meniscus A arrives back at meniscus A after n cycles, and Bn as the probability that a molecule emitted from meniscus A arrives at meniscus B after n cycles. Therefore the probability that a molecule condenses on meniscus A after n cycles is (1 - n)A, and that on meniscus B is (1 - #)B,.
A molecule reflected from meniscus A with the probability #An will start its n+ 1 th cycle flight toward meniscus B, and vice versa.
Meniscus B
A,: probability of reaching meniscus A after n-cycles
'j =1-q Meniscus A Meniscus B A =P i/(- 0)+ E1,64 A =A/3(1 - q) +847 AP 4/(- q) + 8J.r1i B,: probability of reaching
meniscus B after n-cycles
Bt fl= 7 Meniscus A Meniscus B B2 B3
4
=467+ E16(1-77):
=1 A/ + V/(1 -)7)Figure 3. Possible paths and probabilities of molecules emitted from meniscus A until they condense at either meniscus A or B. In the arrow diagrams, the leftmost position indicates meniscus A, the center position indicates scattering from the pore walls, and the rightmost position indicates meniscus B. For example, in the diagram for A2, the molecule that leaves meniscus A can arrive at meniscus A (after
scattering from the pore walls), be reflected from the meniscus A, and arrive again at A by a similar process (left), or the molecule emitted from A can reach meniscus B, be reflected from meniscus B, and arrive at meniscus A (right).
As shown in Figure 3, if a molecule arrives at meniscus A at the n+ 1 th cycle, there are two paths
that it could have taken after the nth cycle. The first path is that the molecule arrived at meniscus
A and was reflected from it, and left meniscus A, but was scattered from the wall, and finally
reached meniscus A. The probability of this path is Af(1 - qi). The second path is that the
molecule reached meniscus B and was reflected, and transported back to meniscus A. The corresponding probability is B,#,i. Therefore, A,+, can be obtained as:
A,+1 = Anf(1-
)+B
r/7+ . (1) Meniscus A A2 A3 A, 1 >(2)
Then, the following relation can be obtained:
A,,+ B,, =#P(A,,,+B,,_I) =- --=#8"(A +BI) = "n-. (3)
The probability pAA and PAB that a molecule that has evaporated from meniscus A finally condenses on meniscus A and B, respectively, can now be expressed as follows:
n-i
PA,B = (1 -
1)jB
. (5)n=1
Then, it can be readily shown that (PAA + PA,B = 1. This simply means that molecules evaporated
from a meniscus must eventually condense either on meniscus A or B. When we solve for An, the following relation is obtained:
An.j =A,,#(I- 1) + B,,l=aA,, +$"rn/, (6)
where a = f8(1-2r?). Therefore, An can be expressed as follows:
A,,= a"-'A, +a "i+ a"3,82, +L +
afln"
2, +fn-17
- xi
M
,
'
7
4
_
Ifi
(7)
n- n-n-f
= "'Al +#"~ r7 .
17
Then we can calculate pAA and P :
A,A =(1-):A,, =1- 1 , (8)
,,, 2q1-/8+1
PAB 1AA =
1
(9)Using the fact that = 1 - a (by definition), we can write
PA (10)
For practically encountered contact angles up to 1200, we can neglect the effect of meniscus
curvature on I and assume the pore geometry to be cylindrical (see Appendix A). We further
assume that the whole system is isothermal, which is a reasonable approximation even in the case
of membrane materials with a relatively poor thermal conductivity (see Appendix B). With these
assumptions, we can take advantage of the fact that the transmission probability t in Equation (10)
is equivalent to the transmission probability across a pore of finite length. Transmission
probability was first introduced by Clausing50 to obtain pressure-driven flux of a rarefied gas
through a pore of finite length. Here, we use the transmission probability rI as calculated by
Berman" for a pore of finite length under the diffuse scattering assumption (Figure 4). r is a
function only of the pore aspect ratio I/a with a maximum value of 1 occurring at zero pore length,
corresponding to ballistic transport. q decreases with increasing I/a and converges to 8/3(1/a) for
1 0.5 17 0.1 0.05 0.02 0 20 40 60 80 100 1/a
Figure 4. Probability of transmission of a molecule across a cylindrical nanopore with length I and radius a (from Berman51).
As mentioned in Section 2.2, the value of a is difficult to predict and must be obtained empirically. Following the review of Eames et al.5
, condensation coefficient of water is assumed to be between 0.5 and 1 in this study. In addition, it is also assumed that a is independent of curvature of meniscus and salt concentration. The dependency of condensation coefficient on salt concentrations and also other parameters such as temperature and ion types will be discussed in Section 4.6.
2.4.
Derivation of mass flux across the nanopores
2.4.1. Change in equilibrium vapor pressure
While we obtained the transport probability for a molecule evaporated from one side to condense on the other side of the nanopore, the total net flux across the nanopore depends on the rate of evaporation from each meniscus. The rate of evaporation is related to the vapor pressure and probability of condensation a. The rate of absorption of water molecules at the liquid-vapor interface is equal to the product of the rate of incidence and the probability of condensation,
which, at equilibrium, must equal the rate of evaporation. For temperatures up to 50*C, the density of water vapor deviates from that predicted by kinetic theory of gases by less than 0.4%; we therefore use the kinetic gas theory to estimate the rate of incidence. This is known as the Hertz hypothesis52' 5, which gives the rate of gross evaporation per unit area at each meniscus, i.e., rhe (i = A or B) as:
hei=aSi=o P
(T,
(11)where SA(B) is the theoretical maximum rate of evaporation from side A (or B) assuming a condensation coefficient of unity, i.e., S, = M / 2rR,7P (T, P,C,) . Here, Pvap is the equilibrium vapor pressure of water at meniscus A (or B) as a function of temperature T, pressure Pi and salt concentration Ci. Rg is the universal gas constant (8.31 J/mol-K) and M is the molecular weight of water (1.8 x 10⁻² kg/mol).
The equilibrium vapor pressure P.p for different temperature, pressure and salt concentration can be derived by relating chemical potential of water in saline solution with that in vapor phase. The chemical potential of water p,2) in saline solution is given as"'
p? = p*;+ RT In a,= p*(' + RTlnywx, (12)
where ;") is the chemical potential of pure water at a reference state as a function of
temperature and pressure. Activity of the water aw can be decomposed into activity coefficient Yw
and mole fraction xw of water in the solution. For water vapor in gas-phase, the chemical potential is given as16
where p"4,(g) is a chemical potential of pure water vapor at a reference state as a function of temperature,
f,
is fugacity of water and P0 is a standard pressure which is typically taken as 1bar5 5. At moderate pressure, the water vapor behaves as ideal gas. In that case, the fugacity of the
water vapor can be taken as vapor pressure P, in the gas mixture.
If we imagine a gas mixture including water vapor above saline solution at equilibrium, the chemical potential of water in both phases must be equal. Therefore,
AW = *f+ RgT Ina,
P P , (14)
= W + RT In va = pwf)
PO
and for pure water in equilibrium with vapor,
P0
p =lp*' =";*+ RTn-p- = p), (15)
where P, is equilibrium vapor pressure of pure water as a function of temperature and pressure. Rearrangement of the two above equations lead to the water vapor pressure in equilibrium with saline solution as5 5
:
P,
W=a
P,
(16)where aw is activity of water in the solution. The osmotic pressure H is given as a function of water activity57,
gI=- Ina,, (17)
V,
Substitution of Equation (17) into (16) leads to:
P = P* exp(-U '"I. (18)
When a pressure drop P is applied across the meniscus, vapor pressure is elevated according to Kelvin's equation58:
P = Pa exp .jT (19)
Substitution of Equation (18) into (19) leads to:
pK =P (exp R T V . (20)
which is also known as Kohler equation59'. For convenience, we use Pvap for equilibrium vapor pressure instead of P from now on. Under isothermal condition as in the present study, the difference in equilibrium vapor pressure is then given as:
(AP - An)v, mV)
PA -PB2+nl -n2+
2(PAna-PHn
Rp,AT RT 2
R. , (21)
(AP-AH)Vm
OpRgT
where AP = PA - PB and An =A - nB. Discarding the second-order term on the right-hand side results in an error of at most -3.5% even for IAP - AnHI= 100 bar.
2.4.2. Derivation of mass flux based on probabilistic framework
At equilibrium, the pressure difference across the nanopore (AP) is equal to the osmotic pressure difference (AH). Increasing the pressure difference across the nanopore beyond the osmotic pressure difference results in PvaA > Pvap,B and net transport of water across the nanopore. Knowing the rate of evaporation (Equations (17) - (19)) and the probability 94B that a water
molecule emitted by evaporation condenses on the other meniscus (Equation (10)), the net mass flux through a membrane consisting of the nanopores with a porosity e is given by
m =e
~A~~,A
e B.) = ePA,(B* A rnB)____
A
AP - AH O . (22)2i1(1- -)+a 2rRg'T
(RT
mj) va(Seawater (or brackish water) is characterized in terms of total dissolved solids (TDS) ranging from 15,000 to 50,000 ppm (corresponding to 0.26 M to 0.90 M NaCl), with the TDS of standard seawater being 35,200 ppm (0.62 M NaCl solution). TDS for brackish water ranges from 1,500 to
15,000 (0.026 M to 0.26 M NaCl solution). The corresponding osmotic pressure is about 13 to 44
bar for sea water and 1.3 to 13 bar for brackish water, although seawater with the same TDS as that of NaCl solution has a lower osmotic pressure due to presence of higher mass solutes8
. RO plants for desalination of sea water typically operate at pressures ranging from around 55-80 bar8.
2.4.3. Heat transfer analogy for calculation of transport through the
nanopore
An alternative way to obtain the net mass flux is by using an analogy from radiation heat transfer1. As shown in Figure 5, the mass transport system in a nanopore can be modeled as three resistances in series due to reflection from the two menisci and scattering from the pore wall. While SA(B) is the theoretical maximum gross evaporation rate through meniscus A(B), the actual rate of gross evaporation is uSA(B). In addition, we define GA(B) as mass flux incident on meniscus A(B), and JA(B) as mass flux leaving meniscus A(B) by emission and reflection. Then the mass
SA JA JB SB
-
1
1-u
Figure 5. Configuration of mass transport resistances from analogy with radiation heat transfer
h ore = J A- G A =aSA -G ,
(23)
where JA(B) = aSA(B)+(l - u)GA(B) from the above definition. For meniscus B, the above equation is
applicable in the same way except that the sign of rn, reverses. t, can be obtained as follows:
?hpore = Cy SA -JA).
(24)
Therefore the mass transfer resistance through the meniscus between SA(B) and JA(B) is (1 - a)/. In
terms of incoming fluxes JA and JB at each meniscus, the net mass flux through the pore using
transmission probability q is given as:
pore = '(J - JB) (25)
Therefore the resistance from the pore wall can be simply 1/l. Then the total resistance of this system is given as:
2(1-a) 1
R = +-. (26)
S -S A P 2-
-m..=.A B ______
=a9A,B 2 R A B)
The mass flux across the membrane with porosity e is then
rh=er po. (28)
2.5.
Characteristics of vapor-phase transport through a nanopore
The theoretical maximum mass flux occurs when there is no resistance to transport across the
nanopore, i.e. q = a = 1. Under these conditions, the rate of condensation is equal to the rate of incidence of water molecules at the meniscus, and the rate of evaporation is also maximized (see
Equation (11)). Molecules that evaporate at one meniscus undergo ballistic transport to the other
meniscus, where they condense. The maximum flux per unit driving pressure (AP - An) depends
on the interface temperature and vapor pressure of water, and can be expressed as:
"_-""_
M
V-
PO (T) (29)AP -Al 2xRT RT
This maximum mass flux increases rapidly with temperature, closely following the increase in
equilibrium vapor pressure with temperature as shown in Figure 6a where u = 1 is used to take only nanopore area into account. As the vapor pressure increases with temperature, the
modulation of the equilibrium vapor pressure due to application of external pressure across the
nanopore also increases; in fact, Equation (21) shows that the modulation is directly proportional
10 20 30 T(OC) 0.54 0 10 0 -- 0 5 Il 0 40 1 07 10050 10 5 a . I 0.2 0.4 0.6 0.8
)q
Figure 6. (a) Specific ratio of theoretical maximum mass flux to driving pressure at different temperatures.
c =
1
is assumed to consider nanopore area only. (b) Net mass flux normalized by theoretical maximum mass flux through a nanopore. The theoretical maximum mass flux indicates the mass flux for a =1
and Il/a= 0 ('7 = 1). (c) Variation of PA,B with ?I and
a.
The scale bar on the top of (c) represents the pore aspect ratio10