HAL Id: cea-01792006
https://hal-cea.archives-ouvertes.fr/cea-01792006
Submitted on 12 Feb 2019HAL is a multi-disciplinary open access archive for the deposit and dissemination of sci-entific research documents, whether they are pub-lished or not. The documents may come from teaching and research institutions in France or abroad, or from public or private research centers.
L’archive ouverte pluridisciplinaire HAL, est destinée au dépôt et à la diffusion de documents scientifiques de niveau recherche, publiés ou non, émanant des établissements d’enseignement et de recherche français ou étrangers, des laboratoires publics ou privés.
Validation of efficiency transfer for Marinelli geometries
Laurent Ferreux, Sylvie Pierre, Tran Thien Thanh, Marie-Christine Lépy
To cite this version:
Laurent Ferreux, Sylvie Pierre, Tran Thien Thanh, Marie-Christine Lépy. Validation of efficiency transfer for Marinelli geometries. Applied Radiation and Isotopes, Elsevier, 2013, 81, pp.67 - 70. �10.1016/j.apradiso.2013.03.083�. �cea-01792006�
VALIDATION OF EFFICIENCY TRANSFER FOR MARINELLI GEOMETRIES
Laurent Ferreux, Sylvie Pierre, Tran Thien Thanh, Marie-Christine Lépy
CEA, LIST, Laboratoire National Henri Becquerel, Gif-sur-Yvette, F-91191, France
ABSTRACT :
In the framework of environmental measurements by gamma-ray spectrometry, some
laboratories need to characterize samples in geometries for which a calibration is not directly
available. A possibility is to use an efficiency transfer code, e.g. ETNA. However, validation
for large volume sources, such as Marinelli geometries, is needed. With this aim in mind,
ETNA is compared, initially to a Monte Carlo simulation (PENELOPE) and subsequently to
experimental data obtained with a high-purity germanium detector (HPGe).
1. INTRODUCTION
In the framework of low level activity measurements, detection limits as low as
possible are required. This is achieved using dedicated “low-level” spectrometers and also
using large volume samples. For low density materials, big volume sources like Marinelli
geometries can provide the best detection limits. Unfortunately, this type of geometry
increases problems of coincidence summing effect and matrix effects. Therefore, the
establishment of the efficiency calibration curve is particularly complex. A good compromise
for laboratories using volume sources, but without the possibility to establish an efficiency
curve, is to calculate efficiency transfer (ET) factors to derive calibration from a reference
geometry to another one, taking into account the sample matrix effect with the knowledge of
its mass attenuation coefficient.
The Laboratoire National Henri Becquerel (LNHB) developed a tool for the calculation of the
Efficiency Transfer for Nuclide Activity measurements (ETNA). The ETNA software offers a
practical and convenient solution to some problems encountered in measurement laboratories
the detector under measurement conditions different from those of calibration (ET factors).
Databases are included, making it possible to record characteristics of different measurement
geometries and update data on materials (attenuation coefficients). The goal of this work is
further validation of ETNA and its limits of use. ETNA has already been validated for some
specific cases, point sources or volume sources far from the detector window. Here, the work
is focused on measurement conditions appropriate for environmental samples, with samples
close to the detector, with large volume, including Marinelli geometries. Two approaches are
used in the present work:
i. calculation: based on the previous intercomparison exercise (Vidmar et al.,
2010) where four general Monte Carlo codes and five dedicated packages for
efficiency determination in gamma-ray spectrometry were compared using
simple case studies;
ii. experiment: measurements performed with an actual high-purity germanium
(HPGe) detector used at the LNHB and standard solutions in different
geometries.
With this aim in mind, and using the previous work testing efficiency transfer codes,
we compare the results of a Monte Carlo simulation, ETNA calculation and experimental
values on a real detector with Marinelli geometries. It must be noted that, in order to avoid the
coincidence summing effects, only mono-energetic radionuclides are used for the
experimental validation.
The Monte Carlo code chosen is PENELOPE2008 which simulates coupled electron and
photon transport in arbitrary materials. The version used includes several generic programs
that allow easy implementation. The PENMAIN routine is used to build a simulating model
based on the geometry subroutine package PENGEOM, which performs particle tracking in
output file (energy deposition spectrum) provides the distribution of absorbed energy in the
detector. This is obtained as a histogram representing the probability distribution function (per
eV and per initial particle). The full energy peak (FEP) efficiency is obtained by multiplying
the probability distribution function corresponding to the energy of interest (full-energy
deposition) by the bin energy width. In this work, to determine ET factors using the Monte
Carlo code, two simulations must be run, one for each geometrical condition. The ET factor is
the ratio of the FEP efficiency for the measurement geometry by the one for the reference
condition.
2. CALCULATION VALIDATION
2.1Cylindrical geometries
The first step of the study is part of the exercise led by Vidmar et al (2010) whose goal
was to compare ET calculations for some simple case studies, using two types of detector and
four different geometries. All parameters for the different samples were given to ensure that
all participants had exactly the same parameters in each case. Regarding the detectors, the
authors used the same approach and provided all parameters for two detectors, one n-type and
one p-type; as an example, geometrical parameters for the p-type detector are given in
Table 1. The task for each laboratory was to calculate ET factors in the 20-2000 keV energy
range. The codes featuring in this comparison fell into two categories: specialized codes
written specifically for efficiency calculations in gamma-ray spectrometry and general
Monte-Carlo simulation tools adapted to the task at hand. From the first group, the codes
GESPECOR (Sima and Arnold, 2002), ETNA (Piton et al, 2000), DETEFF (Cornejo Diaz
and Jurado Vargas, 2008), ANGLE (Jovanovic et al., 1997) and EFFTRAN (Vidmar, 2005)
were tested. The representatives of the second group were GEANT 3.21 (Brun et al., 1987),
2008) and EGS (Nelson et al., 1985). LNHB participated in this exercise using both
approaches: the ETNA code as dedicated software and PENELOPE for Monte Carlo
simulation. The required efficiency transfer factors were derived for the reference geometry (a
large polyethylene cylindrical container filled with aqueous solution, at 1 mm from the
detector window) and three measurement geometries:
(i) “Point”: point source at 2 cm from the detector window,
(ii) “Soil”: cylindrical container filled with quartz, at 1 mm from the detector
window,
(iii) “Filter”: thin cylindrical container filled with cellulose, at 1 mm from the
detector (i.e. a single air filter).
The form and dimensions were kept simple to ensure that the geometrical conditions would
not affect the comparison results.
Table 2 gives the relative deviation, R, between LNHB results calculated with PENELOPE
and the mean results of the intercomparison across the entire energy range, for both detectors
types (A= p-type, B=n-type), where:
= ( − )× 100
FP is the ET factor computed with PENELOPE, and FM is the mean value of the ET factor
calculated by the participants. For each case, a very good agreement is achieved with the
Monte Carlo approach, with relative differences similar to the standard deviation of the results
of the exercise.
Similarly, Table 3 gives the relative deviation between the values calculated with ETNA and
the mean results of the intercomparison. Good agreement is seen, even if the relative
relative deviation is still only 2.5% at low energy with detector B. Comparison of the results
between PENELOPE and ETNA are given in Table 4.
It can be assumed that both our PENELOPE simulation and ETNA calculations are validated
for these cylindrical geometries. These results form the basis on which to continue this study;
since PENELOPE led to slightly better values, in the following, it will be considered the
reference.
2.2Marinelli geometries
In order to pursue this work, a further case study was considered, with two Marinelli
geometries, “450D2” and “SG3000cut”, using detector A as described in the previous study.
The Marinelli sources are presented in Figure 1 with the material and thickness used. In all
cases, the geometries use a plastic container filled with water. The Marinelli containers are
positioned at 1 mm from the detector window. The particular aim of this part of the work is to
establish the ET factor between the reference sample of the exercise (cylinder with water) and
Marinelli geometries.
The ET factors obtained by Monte Carlo simulation for these new geometries are presented in
Table 5. The criterion for the PENELOPE simulation was to get a statistical uncertainty less
than 1 % in order to establish the reference values. These are compared with ET factors
calculated by ETNA. The relative deviations between PENELOPE and ETNA are also given
in the last two columns.
2.3Discussion
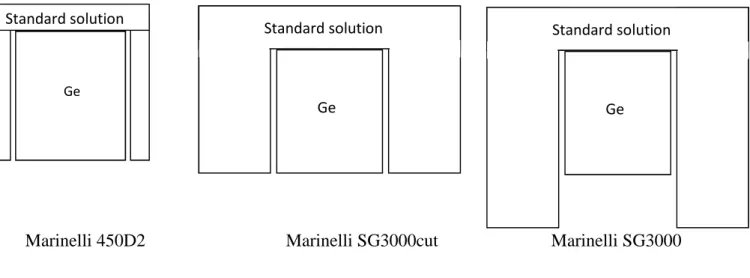
Table 5 shows the results for the two Marinelli geometries, 450D2 and SG3000cut.
only differences between them are the container dimensions, as seen in Figure 2. The
thickness of the 450D2 is only 1 cm along the side of the crystal, whereas the SG3000cut is
5 cm. Results obtained with ETNA are in good agreement with PENELOPE calculation. All
relative deviations are below 6% across the entire energy range. However, we also performed
comparison for a “SG3000” geometry, which is a standard container for 3000 cm3 volume
source, for which the container extends below the crystal bottom; in this case, we observed
higher relative deviations that cannot be only explained by the attenuation coefficients
difference between ETNA and PENELOPE. This highlighted problem is currently being
studied.
This first part of the study confirms that ETNA can calculate efficiency transfer factor
for volume geometries, including the case of Marinelli containers, provided that the container
bottom is at the level, or above, the base of the detecting crystal. This is established by
comparison with Monte Carlo simulation, and remains a validation of the calculation. Now,
experimental validation is required to validate the use of the code in practical cases. This was
performed using the 450D2 geometry.
3. EXPERMENTAL VALIDATION
As a next step, only the case of the 450D2 Marinelli geometry is considered, for which the
ETNA calculation is validated by the previous results. This step consists of an ETNA
calculation and PENELOPE simulation for a real detector in use at LNHB, allowing
comparison with experimental data.
The detector under study is a 100 cm3 n-type HPGe detector, which is an Ortec
GMX-15-70-S model. For the higher energy 60Co gamma line at 1.33 MeV, the detector has a
relative efficiency of 15 % and an energy resolution of 1.8 keV. All the detector parameters,
dimensions and materials, are given in Figure 3. The efficiency calibration of the detector is
obtained using standard solutions and is accurately established for point sources at 10 cm and
for the “SG500” cylindrical volume source of 500 cm3 at 8.33 cm from the detector window.
Moreover, two 450D2 Marinelli standards were prepared: the radionuclides chosen were
139Ce and 137Cs, emitting photons with 166 and 662 keV, respectively. These two
radionuclides allowed to check for possible problems at low energies.
3.2 Monte Carlo simulation for point source
As in the previous part of the study, the criterion for the PENELOPE simulation was to obtain
a statistical uncertainty less than 1 %. First of all, in order to be sure that the PENELOPE
simulation is correct, even if the dimensions were obtained with an X-ray analysis, a first
simulation was made for a point source at 10 cm from the top of the detector. The results
showed a relative deviation between PENELOPE simulation and the experimental calibration
of approximately +10%. This result suggests a problem with the dimensions of the crystal
used in the simulation because a constant relative deviation as a function of energy is
synonymous with a difference of solid angle. As the external crystal dimensions were checked
by X-ray analysis, the only solution is the dimensions of the dead layer of the crystal side, the
front dead layer being validated by comparison with the experimental calibration in the
low-energy range. Knowing a similar problem on another detector in LNHB, a further simulation
was made with a crystal diameter of 46.6 mm instead of 48.6 mm, i.e. with a dead layer
thickness of 1 mm. The simulation with this new diameter gave relative deviations below
1.5 % for both energies, which confirmed the dead layer problem. This diameter was adopted
3.3 Efficiency transfer for volume sources
With this optimized parameter for the crystal active diameter, the Monte Carlo simulation
was performed for volume geometries for which the experimental efficiency is established.
The SG500 was simulated by a cylinder with a diameter of 9.41 cm, lateral at the side of
1.6 mm and bottom thickness of 1 mm. The relative deviation with the experimental results
are -4 % for 139Ce and +3.3 % for 137Cs. This result confirms the simulation of the germanium
detector and allowed the determination of the efficiency transfer between this reference
geometry and the Marinelli 450D2 geometry to be carried out.
Table 6 shows the efficiency transfer between the SG500 at 8.33 cm (as reference) and the
Marinelli geometry 450D2 on top of the detector. There is a good agreement with
experimental values at 662 keV, the relative deviations being -3.9 % for PENELOPE and
+1.3 % for ETNA. At 166 keV, the relative deviations increase to +2.4 % and +5.1 %,
respectively.
4. CONCLUSION
The present validation work, including Monte Carlo simulations and comparisons with
experimental data, demonstrates that ETNA can be used for large geometries including
Marinelli containers and that the efficiency transfer can be obtained with 2-3% uncertainty for
energies higher than 100 keV. This is achieved for a large energy range in only one
calculation, so that using ETNA is much faster than Monte Carlo methods to obtain reliable
results for a large energy range. The main objective of this work is reached, and this result
different geometries. The next step of this study will be apply for Marinelli geometries whose
bottom extends below the crystal in order to validate that ETNA could be used in these cases.
References
Brun, R., Bruyant, F., Maire, M., McPherson, A.C., Zanarini, P., 1987. GEANT3. CERN Data Handling Division, Geneva
Cornejo Diaz, N., Jurado Vargas, M., 2008. DETEFF: an improved Monte Carlo computer program for evaluating the efficiency in coaxial gamma-ray detectors. Nuclear Instruments and Methods A 586, 204-210.
Jovanovic, S., Dlabac, S., Mihaljevic, N., Vukotic, P., 1997. ANGLE_a PC-code for semiconductor detector efficiency calculations. Journal of radioanalytical and Nuclear Chemistry 125, 3-10.
Nelson, W.R., Hirayama, H., Rogers, D.W.O., 1985. The EGS4 Code System. Report SLAC-265. Standford Linear accelerator Center, Stanford, CA.
Piton, F., Lépy, M.-C, Bé, Plagnard, J., 2000. Efficiency transfer and coincidence summing corrections for gamma—ray spectrometry. Applied Radiation and Isotopes 52, 791-795.
Salvat, F., Fernandez-Varea, J.M., Seampau, J., 2003 and 2008. PENELOPE 2003 and 2008: A Code System for Monte Carlo Simulation of Electron and Photon Transport. OECD Nuclear Energy Agency, Issy-les-moulineaux, France.
Sima, O., Arnold, D., 2002. Transfer of the efficiency calibration of germanium gamma-ray detectors using the GESPECOR software. Applied Radiation and Isotopes 56, 71-75.
Vidmar, T., Çelik, N., Cornejo Díaz, N., Dlabac, A., Ewa, I.O.B., Carrazana González, J.A., Hult, M., Jovanović, S., Lépy, M-C., Mihaljević, N., Sima, O., Tzika, F., Jurado Vargas, M., Vasilopoulou, T. and Vidmar, G. 2010. Testing efficiency transfer codes for equivalence. Applied Radiation and Isotopes 68, 355-359.
Vidmar, T., 2005. EFFTRAN - a Monte Carlo efficiency transfer code for gamma-ray spectrometry. Nuclear Instruments and Methods A 550, 603-608.
XCOM home page, http://physics.nist.gov/PhysRefData/Xcom/html/xcom1.html
X-5 Monte Carlo Team (2003). MCNP-A general Monte Carlo N-Particle transport code, Version 5. Los Alamos National Laboratory, Report LA-UR-03-1987.
Table 1
Detector parameters. All dimensions are given in millimeters (mm). The housing diameter is in all cases the same as the window diameter.
Parameter
Crystal type P
Crystal material Ge
Crystal diameter (including the side of the dead layer) 60 Crystal length (including the top dead layer) 60 Dead layer thickness (top and side) 1
Hole diameter 10 Hole depth 40 Window diameter 80 Window thickness 1 Window material Al Crystal-to-window distance 5 Housing length 80 Housing thickness 1 Housing material Al Table 2
Relative deviation (%) between ET calculated by PENELOPE and the mean results of the intercomparison.
Energy/keV Point A Soil A Filter A Point B Soil B Filter B
20 -1,6 -1,2 -1,0 45 -1,0 -0,1 -0,8 -1,7 0,3 -1,3 60 -0,7 0,5 -0,6 -0,9 0,9 -0,8 80 -1,2 0,3 -1,1 -0,9 0,4 -0,8 120 -0,2 0,3 -0,8 -0,8 0,4 -0,9 200 0,3 0,2 -0,7 0,7 0,5 -0,6 500 0,4 0,3 -0,3 -0,1 -0,3 -0,6 1000 -0,2 0,8 -1,0 0,4 0,8 -0,2 2000 0,5 -0,2 -0,6 -0,1 0,2 -0,6
Table 3
Relative deviation (%) between ET calculated by ETNA and the mean results of the intercomparison.
Energy/keV Point A Soil A Filter A Point B Soil B Filter B
20 1,5 2,5 2,4 45 -0,4 2,3 0,0 0,1 2,1 0,6 60 0,0 0,2 0,5 0,2 0,3 0,7 80 -0,1 0,1 0,5 0,0 0,1 0,6 120 -0,3 1,3 1,3 -0,2 1,1 1,0 200 -1,1 -0,1 1,0 -1,0 -0,6 1,4 500 -1,3 -0,5 1,0 -1,5 -0,7 1,3 1000 -1,0 -0,6 0,9 -1,5 -0,8 1,3 2000 -1,1 -0,8 0,9 -1,3 -0,8 1,2
Energy/keV Point A Soil A Filter A Point B Soil B Filter B
20 3,1 3,7 3,5 45 0,6 2,3 0,8 1,8 1,8 1,9 60 0,8 -0,3 1,1 1,1 -0,6 1,6 80 1,1 -0,2 1,6 1,0 -0,3 1,5 120 -0,1 1,0 2,1 0,6 0,8 2,0 200 -1,4 -0,3 1,7 -1,7 -1,1 2,0 500 -1,7 -0,8 1,3 -1,4 -0,4 2,0 1000 -0,9 -1,4 1,9 -1,9 -1,6 1,5 2000 -1,6 -0,6 1,5 -1,2 -1,0 1,8 Table 5
Efficiency Transfer (E.T.) factors calculated by ETNA for Marinelli 450D2 and SG3000cut.
E.T.
Penelope simulation
E.T.
Etna computation Relative deviation (%) Energy/keV 450D2 SG3000cut 450D2 SG3000cut 450D2 SG3000cut 45 0,5005 0,2202 0,4891 0,2170 -2,3 -1,4 60 0,5217 0,2292 0,5170 0,2291 -0,9 -0,1 80 0,5533 0,2425 0,5476 0,2426 -1,0 0,0 120 0,6033 0,2728 0,5927 0,2657 -1,8 -2,6 200 0,6470 0,2956 0,6301 0,2903 -2,7 -1,8 500 0,6849 0,3362 0,6589 0,3207 -4,0 -4,6 1000 0,6968 0,3597 0,6721 0,3398 -3,7 5,5 2000 0,7057 0,3725 0,6833 0,3568 -3,3 -4,2 Table 6
Efficiency Transfer factors with PENELOPE and ETNA and the relative deviation compared to experimental data for 139Ce and 137Cs.
ENERGY (keV) E.T. Experimental E.T. PENELOPE Relative Deviation (%) E.T. ETNA Relative Deviation (%) 165.86 11.6 11.9 2.4 12.2 5.1 661.66 10.3 9.8 -3.9 10.5 1.3
Marinelli 450D2 Marinelli SG3000cut Marinelli SG3000
Figure 2. Marinelli positions on the same HPGe detector Ge Standard solution Ge Standard solution Ge Standard solution
Detector parameters : Crystal material: Ge Crystal diameter: 48.6 Crystal length: 55.2
Dead layer thickness: 0.0003 Hole diameter: 9.5
Hole depth: 47.2 Window diameter: 70 Window thickness: 0.5 Window material: Be
Crystal to window distance: 4.4 Housing length: 125
Housing thickness: 1.8 Housing material: Al
Figure 3. Detector parameters of the experimental setup. All parameters are given in
millimeters (mm).
Ge Al housing
Be window