HAL Id: hal-02305307
https://hal.archives-ouvertes.fr/hal-02305307
Submitted on 17 Dec 2020
HAL is a multi-disciplinary open access
archive for the deposit and dissemination of
sci-entific research documents, whether they are
pub-lished or not. The documents may come from
teaching and research institutions in France or
abroad, or from public or private research centers.
L’archive ouverte pluridisciplinaire HAL, est
destinée au dépôt et à la diffusion de documents
scientifiques de niveau recherche, publiés ou non,
émanant des établissements d’enseignement et de
recherche français ou étrangers, des laboratoires
publics ou privés.
High Resolution STEM-HAADF microscopy on γ-Al2O3
supported MoS2 catalyst – Proof by image of the
changes in dispersion and morphology of the slabs with
addition of citric acid.
Luz Zavala Sanchez, Xavier Portier, Françoise Mauge, Laetitia Oliviero
To cite this version:
Luz Zavala Sanchez, Xavier Portier, Françoise Mauge, Laetitia Oliviero. High Resolution
STEM-HAADF microscopy on γ-Al2O3 supported MoS2 catalyst – Proof by image of the changes in dispersion
and morphology of the slabs with addition of citric acid.. Nanotechnology, Institute of Physics, 2019,
31 (3), pp.035706. �10.1088/1361-6528/ab483c�. �hal-02305307�
High Resolution STEM-HAADF microscopy on
γ-Al
2
O
3
supported MoS
2
catalyst – Proof by image of
the changes in dispersion and morphology of the
slabs with addition of citric acid.
Luz Zavala-Sanchez
1, Xavier Portier
2,
Françoise Maugé
1, and Laetitia Oliviero
11
Laboratoire Catalyse et Spectrochimie, Normandie Université, ENSICAEN, UNICAEN, CNRS, 6, bd du Maréchal Juin, 14050 Caen, France.
2 Centre de recherche sur les Ions, les Matériaux et la Photonique, CEA, UMR CNRS 6252, Normandie Université, ENSICAEN, UNICAEN, CNRS, 6, bd du Maréchal Juin, 14050 Caen, France.
E-mail: laetitia.oliviero@ensicaen.fr
Received xxxxxx
Accepted for publication xxxxxx Published xxxxxx
Abstract
Atomic-scale images of MoS2 slabs supported on γ-Al2O3 were obtained by High Resolution Scanning Transmission Electron Microscopy equipped with High Angular Annular Dark Field detector (HR STEM-HAADF). These observations, obtained for sulfide catalysts prepared without or with citric acid as chelating agent, evidenced variations in morphology (shape) and size of the MoS2 nanoslabs, as detected indirectly by the adsorption of CO followed by Infrared spectroscopy. Quantitative dispersion values and a morphology index (S-edge/M-edge ratio) were determined from the slabs observed. In this way, HR STEM-HAADF underlines that the addition of citric acid to Mo catalysts decreases the size of the particles and modifies the shape of the MoS2 nanoslabs from slightly truncated triangles to particles with a higher ratio of S-edge/M-edge. Furthermore, this work demonstrated that the IR/CO method is a relevant approach to describe MoS2 morphology in industrial γ-Al2O3 supported catalysts.
Keywords: HR STEM-HAADF, MoS2, Citric acid, CO adsorption, IR spectroscopy, Hydrotreatment catalyst, Sulfide nanoparticle morphology.
1. Introduction
In order to face with the severe environmental legislations as well as the decrease of light oil resources, heavy crude oils
fuel. Co (or Ni)-promoted Transition Metal Sulfides (TMS) supported catalysts have been the most important hydrodesulfurization (HDS) catalysts in petroleum refineries for many years. To meet the very restrictive regulation demands, a challenge is to develop catalysts with improved
Nanotechnology XX (XXXX) XXXXXX
L Zavala-Sanchez et al
2
activity and controlled selectivity. Hence, there is a strong concern in the implementation of characterization methods able to account for the local structures of the active sites of industrial catalysts as well as their role in the HDS reaction. Indeed, atomic-scale structural information of catalysts prepared under the same conditions as those used industrially can lead to a more rational design of catalysts for industrial applications. Conventional HDS catalysts consist of a bimetallic (CoMo, NiMo) sulfide phase supported on alumina. The sulfide phase is presented as nanoparticles with lamellar structure. High Resolution Transmission Electron Microscopy (HRTEM) observations account for dimensional parameters of these nanoslabs and report values of average stacking (~2 to 4) and average length (~3 to 6 nm) that depend on the sulfidation conditions [1,2]. Since several decades, the most accepted structure model of the catalytic active sites on sulfided CoMo/Al2O3 catalysts is the one proposed by Topsøe [3,4]. The very well-known MoS2 structure establishes that the TMS slab present, in its crystallographic (0001) plane (2D perspective), two types of edges: the Mo-terminated edge (M-edge) and the sulfur-terminated edge (S-edge). Theoretical calculations [5] as well as Scanning Tunneling Microscopy (STM) of TMS [6] confirmed the presence of these two edges on model MoS2 phase and reported that metal promoters (Co or Ni) have different affinities towards M-edge and S-edge. On silica supported MoS2 catalysts, Okamoto et al. showed by X-ray absorption spectroscopy techniques that the local edge structures of the MoS2 slabs affect the Co-anchoring. This study also indicates that M-edge and S-edge sites have different intrinsic activities in HDS reactions, S-edge being more active and more favorable for the promotion and the formation of CoMoS phase [7]. Thus, these previous studies performed on model catalysts report that morphology of MoS2 slabs, in particular the type and amount of the edges exposed, has a significant influence on both the CoMoS site concentration and their intrinsic activity. Chen et al. reported on an advance towards industrial catalysts by showing that CO adsorption followed by infrared spectroscopy characterization (IR/CO) can discriminate between M-edge and S-edge sites of alumina-supported MoS2 phase. These results were based on a parallel study between Density Functional Theory (DFT) calculations and variations in position and intensity of IR bands of CO adsorbed on MoS2/Al2O3 sulfided at various temperatures. Two ν(CO) contributions were distinguished, one at 2115 cm-1 ascribed to CO in interaction with M-edge sites and one at 2065 cm-1 ascribed to CO in interaction with S-edge sites [8–10]. Since the molar extinction coefficient for each contribution was determined, the IR/CO technique allowed to inform on the amount on Mo sites on M- and S-edges of sulfided Mo/Al2O3, and thus, accounted for the shape of the MoS2 nanoslabs. This way, IR demonstrated to be a reliable
technique to recognize the morphology of the particles as well as the quantification of active sites exposed by the slab. It has been also shown that MoS2 morphology is strongly influenced by the sulfide phase - support interactions [11]. On MoS2/Al2O3, the addition of an organic additive or a chelating agent during the impregnation stage can alter these interactions [8,12]. Thereby, chelating agent addition can change MoS2 slab morphology of Mo catalyst deposited on industrially used support such as γ-Al2O3. However, direct information regarding the morphology of the MoS2 prepared in presence of citric acid remains scarce. Since this information is obtained by IR/CO characterization i. e., by an indirect method, the question that arises now is: how to obtain a direct observation of these morphological changes? The morphology of TMS slabs deposited on an industrial support such as γ-alumina is usually characterized by HRTEM [8–11]. HRTEM observations provide an insight on general parameters such as the length, stacking of the slabs and defects such as bending or dislocations. When it comes to the morphological study, one of the obstacles is that TEM images undergo contrast perturbation due to the support, particularly when this one is such a strong insulator like alumina. To achieve the observation, the orientation of the MoS2 slabs in relation to the direction of the incident electron beam is a determining factor. Only MoS2 slabs that are oriented perpendicular to the [0001] axis are observable by means of HRTEM. This is explained because along these directions, parallel to the slabs, the atomic density is quite high, therefore the resulting contrast in the image is easily visible. Whereas for the top view images of the MoS2 slabs (along the [0001] crystallographic direction) the contrast is very low because the electron beam is crossing only one atomic layer (in the case of one slab). Moreover, although the HRTEM technique allows the observation of metallic particles of subnanometric dimensions, when these particles are immersed in an irregular matrix such as γ-Al2O3, their location is complex. Easily, particles of such minimal dimensions can be unnoticed and be confused as part of the support (γ-Al2O3). For this reason, it is necessary to process the images in order to modify the intensities for a possible interpretation and detection of the slabs.
Some advances in HRTEM technique have allowed to obtain images of MoS2 nanoparticles along the [0001] direction of unsupported films and TMS with conductive supports with single-atom sensitivity. For instance, Kisielowski et al. reported imaging of greater than 10 nm length MoS2 particles along the [0001] direction with resolved information about the shape and structure of the nanocatalysts [12]. In spite of the fact that catalysts were prepared in an industrial style, they were synthesized on a non-industrial support (graphitic powder). The selection of the support for preparing catalysts plays a major role, since each support has its own characteristics and presents different interactions with the
active phase. These different interactions between the active sites and the support translate into changes in morphology, size and activity among others. Furthermore, carbon supports are conductive and this allows a better observation of the slabs by means of the HRTEM mode. Nevertheless, this is unattainable with the catalysts supported on alumina. Some researchers have explored chemical attack treatments in an attempt to separate the TMS particles from the support. A method used to overcome the contrast disturbance from the alumina support is to dissolve the support by HF etching [13]. Nevertheless, for CoMoS catalysts, this leads to strong alterations. Indeed, it was found that the dissolution of the support by HF solution led to a partial destruction of the active phase with loss of cobalt and a rearrangement of the MoS2 particles [14].
Experiments of scanning tunneling microscopy (STM) at atomic resolution, provided an overview of the effect of sulfo-reductive atmospheres, sulfidation agents, promoter atoms, and type of support in the equilibrium morphology of single-layer MoS2 [6,15,16]. However, majority of these results are not quite scalable to the commercial catalysts because the preparation and characterization conditions are significantly different from the standard ones used in operation conditions. For instance, in the reported STM studies MoS2 nanoparticles were supported on Au. Indeed, the sample preparation requires conditions of ultra-high vacuum (UHV) and an oriented substrate like Au (111) or carbon. However, this tailored particle growth on a conductive substrate presents strong differences compared with a commercial catalyst, where the active sites are dispersed in an insulator and multi-faceted surface support like amorphous silica-alumina (ASA) or γ-Al2O3.
Advances in electron microscopy have opened new routes to address the atomic-scale structure of catalytic materials [17,18]. Compared to classical image modes, bright-field (BF) and dark-field (DF), High Resolution Scanning Transmission Electron Microscopy in High-Angle Annular Dark Field mode (HR STEM-HAADF) or Z-contrast image mode offers a significant advantage. Indeed, it facilitates the distinction of the elements according to their atomic number (Z), since the contrast is directly proportional to Z1.7, even for objects of a single atomic plane [17]. HR STEM-HAADF mode is suitable for the study of small nanoparticles made of heavy elements, especially if they are deposited on a support composed of lightweight elements, such as industrial alumina. Recently, Alphazan et al. [19,20] reported on highly active W-based catalysts prepared through controlled surface chemistry that their enhanced activities are explained by the 2D hexagonal morphology of WS2 particles. W catalysts have been chosen because this metal provides better contrast with Al2O3 compared to Mo due to the difference in atomic number. Nevertheless, to obtain better crystallized and
dispersed slabs, the sulfidation was performed at higher temperature (Ts = 600°C) than the usual operating one, and the selected metal coverage was considerably lower than the commonly used. When the metal load decreases, the overlapping of many particles is limited, which improves the quality of the observation. In addition, a higher sulfidation temperature results in more crystalline structures with higher stability under the electron beam. Thus, these modifications can lead to morphological changes, i.e. S-edge/M-edge ratio of the sulfided slabs can be modified compared to that of catalysts prepared in a standard manner [21,22]. Therefore, a gap arises between catalytic activity and morphology studies. Hence, the aim of the present work is to obtain a direct characterization of the slab morphology of Al2O3 supported MoS2 catalysts prepared in exactly the same conditions of synthesis and sulfidation than the ones for the catalytic application. With this objective, a parallel study by means of HR STEM-HAADF (direct approach) and IR/CO spectroscopy method (indirect approach) is carried out on Mo catalysts prepared without or with citric acid. Modification of the slab parameters (length, stacking, and shape) according to the preparation conditions is analyzed via HR STEM-HAADF observations and compared with HRTEM and IR/CO results. The coherence between the results from these different approaches validates the indirect characterization of the MoS2 slab by IR/CO method. Thus, the study is a proof by image of the IR spectroscopic results that gives new insight into the characterization of active sites of TMS catalyst.
2. Experimental procedures
2.1 Catalyst preparation
Two Mo/Al2O3 catalysts, without and with citric acid (CA), were prepared by a one-step pore volume impregnation method. The aqueous impregnation solutions were prepared by dissolving a fixed amount of ammonium heptamolybdate tetrahydrate ((NH4)6Mo7O24·4H2O MERCK) in order to reach 3 Mo atoms.nm-2 of Al2O3 support. CA was incorporated at this stage by dissolving the required amount of citric acid (C6H8O7·H2O PROLABO) to obtain a CA/Mo = 2. Afterwards, the solution was added to the pretreated γ- Al2O3 support (SASOL, specific surface area of 252 m2.g-1 and pore volume of 0.84 mL.g-1, precalcined in air at 723 K for 2 h), strongly shaken and left for maturation during 2 h. Finally, the catalysts were dried at 383 K for 16 h. Note that these catalysts were not calcined in order to keep the chelating agent if present in its initial form. Hereinafter, the Mo/Al2O3 catalysts are denoted Mo(CA/Mo = x)/Al2O3. X refers to the molar ratio of CA to Mo. x = 0 or 2.0.
Nanotechnology XX (XXXX) XXXXXX
L Zavala-Sanchez et al
4
2.2 HRTEM and High-resolution Scanning Transmission
Electron Microscopy - High Angular Annular Dark Field
(HR STEM-HAADF).
All TEM images presented hereinafter have been taken using a double corrected JEOL ARM 200F cold FEG microscope operated at 200 kV. First, slab length and stacking degree distributions of sulfide slabs were determined manually by measuring around 200 slabs per sample from HRTEM images. The image treatment was performed using the
commercial software from GATAN
(DIGITALMICROGRAPH). The nanostructure and morphology of the MoS2 slabs were analyzed by high resolution scanning transmission electron microscopy (HR STEM) using a high angle annular dark field (HAADF) detector. The catalyst precursors were firstly sulfided at 623 K (heating rate of 3 K min-1) and 0.1 MPa for 2 h under a 30 mL min-1 flow of 10%H2S/H2. Then, to limit detrimental exposure to air, the sulfided catalysts were unloaded from the sulfidation reactor under argon flow and poured into absolute ethanol. A few drops of the suspension of catalyst were put on a 300 mesh copper grid with holey carbon film. All the images presented in this manuscript were acquired in HAADF mode and the acquisition of an image lasted about 30 s. During this acquisition and despite exposure to the electron beam, the shapes of the particles remained unchanged, meaning that the slabs were quite stable under the electron beam. The possible effect of damage associated with the heating effects caused by the incident beam in the MoS2 nanolayers is always a factor to consider. The advisable acceleration voltage is a low beam energy such as 80 kV. In our study, we did not observe significant changes during the acquisition of the images at 200 kV. Observations at 80 kV were also performed, but no significant difference in terms of slab stability was noticed. Therefore, it was concluded that the operation with an acceleration of 200 kV is compatible with our purpose of morphological analysis.
2.3 Two-Dimensional (2D) quantitative morphology
analysis from HAADF-TEM images.
In a previous work, Baubet et al. reported a reliable methodology for quantification of the morphology from HR HAADF-STEM images [23]. Two methods were compared. The first one consists of the determination of the S-edge/M-edge ratio through the measurement of the lengths of the regular shaped particle. For the second one, a 2D shape morphology index was determined by analysis of the slabs whatever its shape taking into account ten parameters. The results obtained for catalysts sulfided under different conditions were comparable with both methods and were consistent with what was predicted by DFT calculations. In this work, following a similar approach, a sample of a dozen
observable isolated particles for both Mo(CA/Mo = 0)/Al2O3 and Mo(CA/Mo = 2)/Al2O3 samples was taken through contrast optimization in our images, to obtain statistical information about the morphology of the MoS2 slabs. In these regular slabs, a contour was drawn by a simple shape model with straight edges and the corresponding edge lengths were measured, as well as the area of the particle with the help of the Mesurim Pro software. The limited number of particles is explained by the difficulty to observe isolated specimens with faceted edges in these realistic samples.
For assigning M-edge and S-edge, we rely on DFT calculations that predicted that M-edge is energetically more stable than S-edge in a wide range of sulfur chemical potential and, therefore, that the morphology of MoS2 is truncated triangle terminated by mainly M-edge under typical sulfidation and HDS conditions [24].
2.3.1 Particle dispersion analysis
Considering that for each slab, the dispersion is the ratio of edge atoms per total atoms, the calculated dispersion values were obtained through the measurement of slab area and perimeter with the following equation:
Where: D = dispersion P = Particle perimeter (nm) d = atomic diameter Mo (nm)
Nc = Number of corner atoms in the corner A = Particle area (nm2)
2.3.2 S-edge/M-edge ratio calculation
Given that the morphology of these slabs is well in accordance with the prediction of DFT, we consider them to be nanoparticles in "equilibrium”. Therefore, we rely on the previous DFT calculations [24] to assign the chemical nature of the edge. Indeed, for the sulfidation process that we used, the particles must exhibit a majority of M-edge. Hence, for all the slabs observed, the largest edge is assigned to the M-edge and then we consider alternation of S- and M-M-edges. For each particle, all edges were measured carefully. Considering the largest edge length being an M-edge (LM) and taking into account the intercalation between M-edge and S-edge, the S-edge/M-edge ratio is calculated by the following equation (2):
With LSi and LMi, the lengths of each S-edge and M-edge respectively.
2.4 IR spectroscopy of CO adsorption (IR/CO)
The MoS2 edge sites of these catalysts were in-situ characterized by low-temperature CO adsorption followed by IR spectroscopy. The oxidic catalyst was grounded and pressed into a self-supported wafer (10 mg for a disc of 2.01 cm2) and positioned into a quartz IR cell with CaF2 windows. Prior to the adsorption experiments, the sample was sulfided in situ in the IR cell. For this purpose, the catalysts was sulfided in a gas mixture containing 10% H2S/H2 (30 ml.min -1) at 623 K for two hours with a heating rate of 3 K.min-1. After sulfidation, the cell was flushed with Ar and evacuated down to P<1 10-4 Pa until the catalyst reached room temperature. Then, CO adsorption was performed at low temperature (~100 K) to avoid any reaction with the catalysts surface. Small calibrated doses of CO were introduced into the IR cell until equilibrium pressure of 133 Pa. After each CO introduction, FTIR spectra were recorded with 256 scans and a resolution of 4 cm-1 using Nicolet Nexus FT-IR spectrometer equipped with a MCT Detector. The quantification of each edge sites present in the series of catalysts was obtained after the spectral decomposition performed in Peakfit V4.12 using '' Autofit peak III-deconvolution ''. In the spectral decomposition, the values of the center and the full width at half maximum (FWHM) correspond to those previously reported on [6]. The used CO molar extinction coefficients are 20 ± 3 (M-edge) and 35 ± 9 (S-edge) cm·μmol−1 as determined in SI of [6].
3. Results and discussion
3.1 Length and stacking degree determined by HRTEM
analysis
In figure 1 representative images (A-B) and distributions of length and stacking (C-D) of the sulfide slabs obtained for Mo(CA/Mo = 0)/Al2O3 and Mo(CA/Mo = 2)/Al2O3 catalysts are presented. A careful process of measuring the length of the slabs present in each sample was carried out. The addition of citric acid leads to a decrease of the average slab length from 2.9 ± 0.9 nm to 1.7 ± 0.9 nm. Also to an increase of the average stacking number (1.9 to 2.2) is noticed. While the presence of particles stacked in two or more slabs is significant in both samples, the amount of the rather small monolayer slabs observed in the Mo(CA/Mo = 2)/Al2O3 sample was much higher than in the Mo(CA/Mo = 0)/Al2O3
sample. In both samples, interestingly, those particles that were not found stacked are characterized for a minimum slab length. This could suggest that only longer particles will stack into two or more. Larger slabs will stack while the small ones will be better dispersed in the surface. Such results are in accordance with previously reported results and ascribed to the decrease interaction between the MoS2 slabs and the support due to the addition of citric acid [25].
Figure 1. TEM analysis: images of Mo(CA/Mo=0)/Al2O3 (A) and Mo(CA/Mo=2)/Al2O3 (B), slab length distribution (C) and stacking number distribution (D).
3.2 Dispersion calculated from HR HAADF-STEM
images.
In figure 2 (A and C) the HR STEM-HAADF micrographs representative of Mo(CA/Mo = 0)/Al2O3 and Mo(CA/Mo = 2)/Al2O3 are shown respectively. Observed particles are characterized by a good contrast and thus the acquisition mode is adequate to reveal the 2D morphology of slabs in industrial-grade alumina support. Indeed, planar MoS2 slabs are displayed with atomic resolution of the Mo atoms (bright dots) present in the slabs. These HR HAADF-STEM observations reveal differences in slab growth between the two samples analyzed. Indeed, the general topology of Mo(CA/Mo=0)/Al2O3 is characterized by MoS2 slabs grown in the form of plates and by a contrast variation among the slabs (figure 2 (A)). It is also noticeable that some of the slabs in Mo(CA/Mo = 2)/Al2O3 are much smaller than the ones observed in Mo(CA/Mo = 0)/Al2O3 sample. In both samples, brighter areas can be attributed to an increase in the density of Mo that is related to the agglomeration of stacked slabs present. However, according to figure 2 (C), the particles whose length is less than 1 nm, are appreciated with an intensity of homogeneous brightness, which suggests that they are particles of thickness of a single atomic layer (not
Nanotechnology XX (XXXX) XXXXXX
L Zavala-Sanchez et al
6
stacked). In figure 2 (B and D), the contour of the more isolated slabs in both samples is presented. By optimization and variation of contrast by region, a dozen slabs per sample were drawn in order to carry out a statistical analysis of their length and dispersion (eq. (1)). Note that the longest length observed in the 2D particles images was taken into account for determining the diameter of the MoS2 slabs.
Figure 2. Processing of HR STEM-HAADF micrographs of MoS2 particles of Mo(CA/Mo = 0)/Al2O3 (A and B) and Mo(CA/Mo = 2)/Al2O3 (C and D). In figures B and D the contour of selected contrasted particles is shown.
Results are gathered in Table I and figure 3. In accordance with the results obtained from HRTEM, HR STEM HAADF study reveals that the addition of citric acid promotes the reduction of MoS2 particle size. However, for both samples the value obtained by the HR STEM HAADF study is lower than the one obtained by the HRTEM study, underlying that the smallest particles can be hard to distinguish in HRTEM.
Figure 3. Histogram of the measured diameter of the particles observed in HR HAADF-STEM
Moreover, the latter approach is less accurate since the slab length measurements are done from the projection of the slabs which is not necessarily the longest distance of the slabs. Additionally, the distribution in length obtained by both studies is also different: more homogeneous lengths are observed in HR STEM HAADF than in HRTEM. Finally, the fact that the 2D morphology of the slabs is revealed by the HR STEM HAADF study allows calculating realistic dispersion values for each particle. The average value of dispersion is then significantly increased with the addition of citric acid: from 0.48 ± 0.08 for the Mo(CA/Mo=0)/Al2O3 sample to 0.60 ± 0.12 for the Mo(CA/Mo=2)/Al2O3 sample.
3.3. MoS
2slab morphology (shape) and S-edge/M-edge
ratio
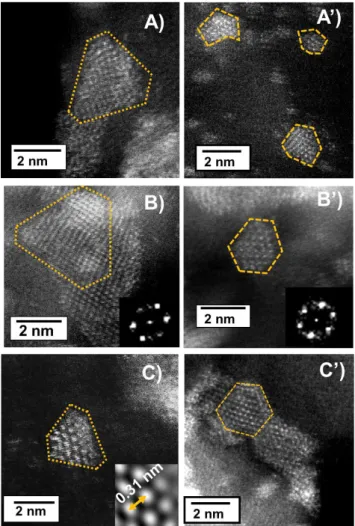
As shown in images at greater magnification in figures 4
(A-C), the MoS2 particles in Mo(CA/Mo=0)/Al2O3 have a geometry, whose shape resembles a triangle with slightly truncated edges. Accurate observation of picture of figure
4(B) shows a particle with this shape superimposed on a larger one, leading to a different projected pattern. Inset of figure 4(B) shows a Fast Fourier Transform (FFT) of a single region of the slab in the image, and the as expected six-fold symmetry of the Mo atoms arrangement is clearly evidenced.
Figure 4. HR STEM-HAADF micrographs of MoS2 particles of Mo(CA/Mo = 0)/Al2O3 and Mo(CA/Mo = 2)/Al2O3 of different zones. Inset B and B’ FFT of a single slab and inset C) zoom on the filtered image.
Furthermore, when analyzing filtered images (inset in figure
4(C) as an example), it was determined that the interatomic distance between the atoms of Mo is ~0.31 nm corresponding to that of the Mo atoms in a MoS2 crystal (0.317 nm). In general, the particles observed for Mo(CA/Mo = 2)/Al2O3 displayed different morphologies than the ones for Mo(CA/Mo = 0)/Al2O3. Addition of citric acid leads to (1) a significant amount of faceted-shape slabs as shown in figures
4(A’-C’) and (2) some rather symmetrical shaped slabs.
Figure 5. Histogram of the S-edge/M-edge ratio based on the measured edge lengths for Mo(CA/Mo=0)/Al2O3 and Mo(CA/Mo=2)/Al2O3
In order to rationalize these morphology observations, calculation of the S-edge/M- edge ratio for a dozen observed particles has been performed. Since HR HAADF-STEM analysis does not allow one to identify the type of edge exposed by the nanoparticles, as done in ref. [23], the longest length was ascribed to M-edge since this is the most stable edge at the sulfidation conditions we used [21]. The S-edge/M-edge ratio from HR HAADF-STEM were then calculated following eq. (2): the distribution in S-edge/M-edge ratio is reported in figure 5 and the average value is 0.37 ± 0.12 for Mo(CA/Mo=0)/Al2O3 and 0.78 ± 0.10 for Mo(CA/Mo=2)/Al2O3 (Table I).
Table I. Parameters calculated from the HR STEM-HAADF images for both catalyst.
The significant increase in average S-edge/M-edge ratio value and the clear difference in distribution pattern agree with the more isotropic character of the slabs for the catalyst prepared with citric acid as previously observed.
3.4. Morphology based on IR/CO of MoS
2/Al
2O
3catalysts prepared with citric acid
IR/CO spectroscopy has revealed that several parameters during the preparation and sulfidation stage can modify the
Nanotechnology XX (XXXX) XXXXXX
L Zavala-Sanchez et al
8
morphology of MoS2 slabs of supported catalysts [21,25–27]. For example, and for the present study, the addition of citric acid promotes the growth of S-edge (IR/CO band at 2065 cm -1
), while it inhibits that of M-edge (IR/CO band at 2115 cm-1) (figure 6). From these variations, it is expected that the morphology of MoS2 slabs is progressively modified from a slightly truncated triangle with predominant M-edge to a more hexagonal shape with closer amount of M-edge and S-edge, as the quantity of citric acid present in the preparation stage is increased. Our HR STEM-HAADF images and deduced results reveal indeed a change in morphology from one sample to another with the addition of citric acid. However, HR STEM-HAADF images also show that not only model forms (triangle and hexagon) are present. Indeed, the obtained images mainly evidenced particles changing from slightly truncated to more-faceted shapes, but the same trend is observed, i. e. the S-edge/M-edge ratio increases with citric acid addition. Another important point is that the increase in dispersion (i. e. decrease in slab length) deduced from the HR STEM-HAADF study is also in accordance with the global increase in edge sites concentration obtained by the IR/CO method.
Figure 6. IR spectra of CO adsorption on sulfided Mo(CA/Mo = 0 or 2)/Al2O3 catalysts.
4. Conclusion
One guideline of this work was to characterize catalysts prepared in conditions close to the ones used for applications and not specifically chosen to meet the requirements of these advanced techniques of characterization. This has made very delicate the observation of the shape of sulfide slabs by electron microscopy. However, atomic-scale images of γ-Al2O3 supported Mo nanoparticles were obtained by HR STEM-HAADF for sulfide catalysts prepared without and
with citric acid. HR STEM-HAADF observations and subsequent exploitation highlighted that the addition of citric acid during the preparation step of Mo catalysts changes the shape of the MoS2 nanoslabs. Indeed, the S-edge/M-edge ratio obtained by HR STEM-HAADF study is significantly increased by addition of citric acid as it was previously obtained by the IR/CO method. Moreover, the study shows that HR STEM-HAADF allows more easily to distinguish the smallest slabs (< 2 nm) from the oxide support. So, this HR STEM-HAADF study is a proof by image of the results obtained by the IR/CO method. The direct observations validate the variation of morphology of MoS2 nanoslabs detected indirectly by the IR/CO method thus consolidating also the ν(CO/Mo) band attribution to CO interacting on the two different edges.
As a consequence, this study strengthens the importance of coupling techniques like microscopy that allows a direct observation of the shape of a group of sulfided slabs and IR spectroscopy that allows an indirect detection of the shape but of a large number of sulfided slabs. The present study paves the way for further investigations on promoted catalysts comparable to the ones used in the HDS industry.
Acknowledgements
L. Zavala-Sanchez acknowledges the Mexican National Council for Science and Technology (CONACYT) for the Ph. D. grant. The authors acknowledge LABEX EMC3 for the financial support to MIMOSA project.
References
[1] Marien Bremmer G, Van Haandel L, Hensen E J M, Frenken J W M and Kooyman P J 2019 The effect of oxidation and resulfidation on (Ni/Co)MoS2 hydrodesulfurisation catalysts Appl. Catal. B Environ. 243
145–50
[2] Toledo-Antonio J A, Cortes-Jacome M A, Escobar-Aguilar J, Angeles-Chavez C, Navarrete-Bolã J and López-Salinas E 2017 Upgrading HDS activity of MoS2 catalysts by chelating thioglycolic acid to MoOx supported on alumina Appl. Catal. B Environ. 213 106–17
[3] Topsøe H and Clausen B S 1984 Importance of Co-Mo-S Type Structures in Hydrodesulfurization Catal. Rev. Sci. Eng. 26 395–420
[4] Brorson M, Carlsson A and Topsøe H 2007 The morphology of MoS2, WS2, Co-Mo-S, Ni-Mo-S and Ni-W-S nanoclusters in hydrodesulfurization catalysts revealed by HAADF-STEM Catal. Today 123 31–6
[5] Byskov L S, Nørskov J K, Clausen B S and Topsøe H 2000 Edge termination of MoS2 and CoMoS catalyst particles Catal. Letters 64 95–9
[6] Lauritsen J V., Helveg S, Lægsgaard E, Stensgaard I, Clausen B S, Topsøe H and Besenbacher F 2001 Atomic-scale structure of Co-Mo-S nanoclusters in hydrotreating catalysts J. Catal. 197 1–5
[7] Okamoto Y, Hioka K, Arakawa K, Fujikawa T, Ebihara T and Kubota T 2009 Effect of sulfidation atmosphere on the hydrodesulfurization activity of SiO2-supported Co-Mo sulfide catalysts: Local structure and intrinsic activity of the active sites J. Catal. 268 49–59
[8] Vradman L, Landau M V, Herskowitz M, Ezersky V, Talianker M, Nikitenko S, Koltypin Y and Gedanken A 2003 High loading of short WS2 slabs inside SBA-15: promotion with nickel and performance in hydrodesulfurization and hydrogenation J. Catal. 213 163–
75
[9] Huang Z D, Bensch W, Kienle L, Fuentes S, Alonso G and Ornelas C 2009 SBA-15 as support for Ni-MoS2 HDS catalysts derived from sulfur-containing molybdenum and nickel complexes in the reaction of HDS of DBT: An all sulfide route Catal. Letters 127 132–42
[10] Nava R, Ortega R A, Alonso G, Ornelas C, Pawelec B and Fierro J L G 2007 CoMo/Ti-SBA-15 catalysts for dibenzothiophene desulfurization Catal. Today 127 70–84
[11] Dimitrov L, Palcheva R, Spojakina A and Jiratova K 2011 Synthesis and characterization of W-SBA-15 and W-HMS as supports for HDS J. porous Mater. 18 425–34
[12] Kisielowski C, Ramasse Q M, Hansen L P, Brorson M, Carlsson A, Molenbroek A M, Topsøe H and Helveg S 2010 Imaging MoS2 nanocatalysts with single-atom sensitivity Angew. Chemie - Int. Ed. 49 2708–10
[13] Li Y, Li A, Li F, Liu D, Chai Y and Liu C 2014 Application of HF etching in a HRTEM study of supported MoS2 catalysts J. Catal. 317 240–52
[14] Berhault G, De La Rosa M P, Mehta A, Yá M J and Chianelli R R 2008 The single-layered morphology of supported MoS2-based catalysts-The role of the cobalt promoter and its effects in the hydrodesulfurization of dibenzothiophene Appl. Catal. A Gen. 345 80–8
[15] Walton A S, Lauritsen J V, Topsøe H and Besenbacher F 2013 MoS2 nanoparticle morphologies in hydrodesulfurization catalysis studied by scanning tunneling microscopy J. Catal. 308 306–18
[16] Besenbacher F, Brorson M, Clausen B S, Helveg S, Hinnemann B, Kibsgaard J, Lauritsen J V., Moses P G, Nørskov J K and Topsøe H 2008 Recent STM, DFT and HAADF-STEM studies of sulfide-based hydrotreating catalysts: Insight into mechanistic, structural and particle size effects Catal. Today 130 86–96
[17] Nellist, P. D., & Pennycook S J 1996 Direct Imaging of the Atomic Configuration of Ultradispersed Catalysts Science (80-. ). 274 413–5
[18] Hillyard S and Silcox J 1995 Detector geometry, thermal diffuse scattering and strain effects in ADF STEM imaging
Ultramicroscopy 58 6–17
[19] Alphazan T, Bonduelle-Skrzypczak A, Legens C, Gay A S, Boudene Z, Girleanu M, Ersen O, Copéret C and Raybaud P 2014 Highly active nonpromoted hydrotreating catalysts through the controlled growth of a supported hexagonal WS2 phase ACS Catal. 4 4320–31
[20] Alphazan T, Bonduelle-Skrzypczak A, Legens C, Boudene Z, Taleb A L, Gay A S, Ersen O, Copéret C and Raybaud P 2016 Improved promoter effect in NiWS catalysts through a molecular approach and an optimized Ni edge decoration J. Catal. 340 60–5
[21] Chen , abruyere , Maug , Quoineaud A A, Hugon A and Oliviero L 2014 IR Spectroscopic Evidence for MoS2 Morphology Change with Sulfidation Temperature on MoS2/Al2O3 Catalyst J. Phys. Chem. C 118 30039–44 [22] Chen J, Oliviero L, Portier X and Mau F 2015 On the
morphology of MoS2 slabs on MoS2/Al2O3 catalysts: the influence of Mo loading RSC 5 81038–44
[23] Baubet B, Girleanu M, Gay A S, Taleb A L, Moreaud M, Wahl F, Delattre V, Devers E, Hugon A, Ersen O, Afanasiev P and Raybaud P 2016 Quantitative Two-Dimensional (2D) Morphology-Selectivity Relationship of CoMoS Nanolayers: A Combined Resolution High-Angle Annular Dark Field Scanning Transmission Electron Microscopy (HR HAADF-STEM) and Density Functional Theory (DFT) Study ACS Catal. 6 1081–92
[24] Schweiger H, Raybaud P, Kresse G, Hervé H and H 2002 Shape and Edge Sites Modifications of MoS2 Catalytic Nanoparticles Induced by Working Conditions: A Theoretical Study J. Catal. 207 76–87
[25] Chen J, Maugé F, Fallah J El and Oliviero L 2014 IR spectroscopy evidence of MoS2 morphology change by citric acid addition on MoS2/Al2O3 catalysts – A step forward to differentiate the reactivity of M-edge and S-edge J. Catal. 320 170–9
[26] Chen J, Dominguez Garcia E, Oliviero E, Oliviero L and Maugé F 2016 Effect of high pressure sulfidation on the morphology and reactivity of MoS2 slabs on MoS2/Al2O3 catalyst prepared with citric acid J. Catal. 339 153–62
[27] Chen J, Oliviero L, Portier X and Maugé F 2015 On the morphology of MoS2 slabs on MoS2/Al2O3 catalysts: the influence of Mo loading RSC Adv. 5 81038–44