HAL Id: hal-00328339
https://hal.archives-ouvertes.fr/hal-00328339
Submitted on 3 Jul 2003
HAL is a multi-disciplinary open access
archive for the deposit and dissemination of
sci-entific research documents, whether they are
pub-lished or not. The documents may come from
teaching and research institutions in France or
abroad, or from public or private research centers.
L’archive ouverte pluridisciplinaire HAL, est
destinée au dépôt et à la diffusion de documents
scientifiques de niveau recherche, publiés ou non,
émanant des établissements d’enseignement et de
recherche français ou étrangers, des laboratoires
publics ou privés.
organic compounds during the MINOS campaign in
Crete, July–August 2001
G. Salisbury, J. Williams, R. Holzinger, Valérie Gros, N. Mihalopoulos, M.
Vrekoussis, R. Sarda-Estève, H. Berresheim, R. von Kuhlmann, M. Lawrence,
et al.
To cite this version:
G. Salisbury, J. Williams, R. Holzinger, Valérie Gros, N. Mihalopoulos, et al.. Ground-based
PTR-MS measurements of reactive organic compounds during the MINOS campaign in Crete, July–August
2001. Atmospheric Chemistry and Physics, European Geosciences Union, 2003, 3 (4), pp.925-940.
�10.5194/acp-3-925-2003�. �hal-00328339�
www.atmos-chem-phys.org/acp/3/925/
Chemistry
and Physics
Ground-based PTR-MS measurements of reactive organic
compounds during the MINOS campaign in Crete, July–August
2001
G. Salisbury1, J. Williams1, R. Holzinger1, V. Gros1, N. Mihalopoulos2, M. Vrekoussis2, R. Sarda-Est`eve3, H. Berresheim4, R. von Kuhlmann1, M. Lawrence1, and J. Lelieveld1
1Department of Air Chemistry, Max Planck Institute for Chemistry, Mainz, Germany 2Department of Chemistry, University of Crete, Heraklion, Crete, Greece
3Laboratoire des Sciences du Climat et de l’Environnement, Gif-sur-Yvette, France 4German Weather Service, Hohenpeissenburg, Germany
Received: 16 December 2002 – Published in Atmos. Chem. Phys. Discuss.: 20 February 2003 Revised: 27 June 2003 – Accepted: 1 July 2003 – Published: 3 July 2003
Abstract. This study presents measurements of acetoni-trile, benzene, toluene, methanol and acetone made using the proton-transfer-reaction mass spectrometry (PTR-MS) tech-nique at the Finokalia ground station in Crete during the Mediterranean INtensive Oxidant Study (MINOS) in July– August 2001. Three periods during the campaign with broadly consistent back trajectories are examined in detail. In the first, air was advected from Eastern Europe with-out significant biomass burning influence (mean acetonitrile mixing ratio 154 pmol/mol). In the second period, the sam-pled air masses originated in Western Europe, and were ad-vected approximately east-east, before turning south-west over the Black Sea and north-south-western Turkey. The third well-defined period included air masses advected from East-ern Europe passing east and south of/over the Sea of Azov, and showed significant influence by biomass burning (mean acetonitrile mixing ratio 436 pmol/mol), confirmed by satel-lite pictures. The mean toluene:benzene ratios observed in the three campaign periods described were 0.35, 0.37 and 0.22, respectively; the use of this quantity to determine air mass age is discussed. Methanol and acetone were gener-ally well-correlated both with each other and with carbon monoxide throughout the campaign. Comparison of the ace-tone and methanol measurements with the MATCH-MPIC model showed that the model underestimated both species by a factor of 4, on average. The correlations between acetone, methanol and CO implied that the relatively high levels of methanol observed during MINOS were largely due to direct biogenic emissions, and also that biogenic sources of acetone were highly significant during MINOS (∼35%). This in turn suggests that the model deficit in both species may be due, at least in part, to missing biogenic emissions.
Correspondence to: G. Salisbury
(gavins@mpch-mainz.mpg.de)
1 Introduction
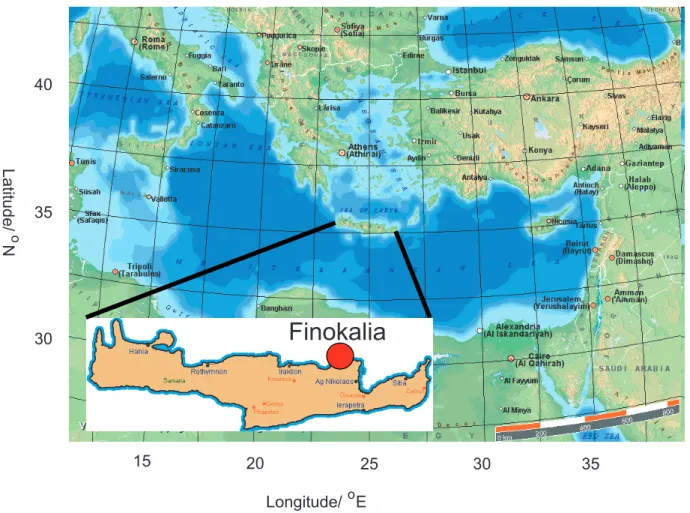
Measurements of organic compounds, particularly oxy-genated species, in the atmosphere of the Eastern Mediter-ranean away from the large urban conurbations, are very scarce in the literature. Leaving aside plant emission data, a review of the literature revealed only two extensive data sets, namely the AEROBIC intensive campaign at an ele-vated forested site in central Greece in 1997 (Harrison et al., 2001; Tsigaridis and Kanakidou, 2002) and a longer-term series of canister measurements carried out at an altitude of ca. 1000 m in the Peloponnisos region of Greece in 1996 and 1997 (Moschonas and Glavas, 2000). Yet the Mediter-ranean region is likely to be of considerable importance to the air quality over a much wider region, since in summer relatively stable conditions prevail in the lower troposphere, where air is advected south/south-east from the industrial Eu-ropean nations and is subsequently transported to northern Africa and the Middle East (Mihalopoulos et al., 1997; Sanz and Mill´an, 1998; Lelieveld et al., 2002). Since the climate of the Mediterranean in summer is characterised by high-pressure, cloud-free conditions, high photochemical activity is to be expected, and the atmospheric processing of organic species emitted over continental Europe will be considerable. The Finokalia measurement station, on the North coast of Crete ca. 70 km east of Heraklion (35◦190N, 25◦400E; 130 m
above sea level; Fig. 1), is ideally placed to examine the air masses advected from continental Europe in summer. Lo-cal pollution is restricted to a few cars per day passing on a minor coastal road ca. 50 m west of and some 20 m below the station. Coastal orography shifts the local wind direction from north/north-west to almost due west in summer, and only a slight sea-breeze oscillation in wind direction between day and night is generally observed. Air passing a substan-tial distance over Crete before arrival at the site is therefore
15
20
25
30
35
30
35
40
La
titu
de
/
N
oLongitude/ E
oFinokalia
Fig. 1. Location of Finokalia measurement station, site of the ground-based measurements during MINOS, July–August 2001.
rare at Finokalia under these conditions (Mihalopoulos et al., 1997), so that local effects on the atmospheric chemistry are minimal for long periods.
This paper presents measurements of acetonitrile, ben-zene, toluene, acetone and methanol made using the proton-transfer-reaction mass-spectrometry (PTR-MS) technique at Finokalia during the Mediterranean INtensive Oxidants Study (MINOS) in July–August 2001. The only reported source of acetonitrile in the atmosphere is from biomass burning (Lobert et al., 1990; Holzinger et al., 1999); the MI-NOS PTR-MS acetonitrile data are therefore used to assess the extent of biomass-burning influence on the air sampled during the campaign. In contrast, benzene and toluene are also emitted from fossil-fuel use; the toluene:benzene ratio is used in the present work to assess the time elapsed since the air sampled at Finokalia was last polluted.
Sources and sinks of acetone and methanol in the atmo-sphere are subject to a high degree of uncertainty, since few atmospheric measurements of these species have been made to date, particularly in the boundary layer. The budget of acetone is of major interest, since this compound is believed to be an important source of HOxradicals in the upper tro-posphere, as well as a reservoir for NOx through the
for-mation of peroxyacetyl nitrate (PAN) (Singh et al., 1995; Wennberg et al., 1998). The role of methanol in the atmo-sphere is unclear; a recent study suggests that a substantial reservoir of this species may exist in the oceans (Galbally and Kirstine, 2002). On a global scale, biogenic emissions of both species are known to be substantial; for example, Kirs-tine et al. (1998) found that acetone formed up to 23% and methanol up to 15% of the total carbon emissions from grass and clover in pastureland in Victoria, Australia. For acetone, Jacob et al. (2002) estimated that, in percentage contribu-tion terms, the global annual emissions from primary anthro-pogenic sources (solvent use and motor vehicle emissions) are of the order of 1%, from primary biogenic sources 35%, from secondary production in the air from propane oxidation 22%, and from biomass burning 5%. The total global source strength of acetone was estimated to be ca. 95 Tg yr−1, ap-preciably more than previously concluded by Singh et al. (2000) (56 Tg yr−1). Jacob et al. (2002) also proposed a sig-nificant global oceanic source for acetone (27 Tg yr−1). On a regional scale, however, a stronger contribution to acetone production from photochemical reactions of anthropogenic emissions might be expected than these figures suggest.
The global budget of methanol is even more uncer-tain. Singh et al. (2000) estimated a combined source strength for methanol of the order of 122 Tg yr−1(range 75– 210 Tg yr−1), a total far exceeding the known sinks (40– 50 Tg yr−1), suggesting that loss processes other than OH reaction and surface deposition must be important in the at-mospheric budget of this compound. In percentage contri-bution terms, the global annual emissions of methanol from primary anthropogenic sources were estimated to be ca. 2% (largely from evaporation during solvent use), from primary biogenic sources 61%, from methane oxidation 15%, and from biomass burning 5%, with the rest coming from de-cay of plant matter and a possible oceanic source (Singh et al., 2000). Biogenic production of methanol is associated with plant growth, as it is a by-product of pectin harden-ing around cellulose (see Galbally and Kirstine, 2002). A more recent review of the global methanol budget by Heikes et al. (2002) suggested even greater uncertainty, with a to-tal source strength in the range 90–480 Tg yr−1. In this pa-per, the sources of acetone and methanol are examined in the light of results from the 3D global chemistry-meteorology model MATCH-MPIC (Model of Atmospheric Transport and Chemistry - Max Planck Institute for Chemistry version). Al-though the resolution of this model is necessarily coarse, the general lack of measurements of reactive organic species in the Eastern Mediterranean means that the MINOS campaign represented a unique opportunity to test the performance of a global atmospheric chemistry model in a relatively unex-plored region, in atmospheric chemistry terms. Of particular interest is whether the GEIA organic emissions scheme used in the MATCH-MPIC model is realistic (see also Gros et al., 2003).
2 Experimental
2.1 The PTR-MS technique
The PTR-MS technique has been described in detail previ-ously (Hansel et al., 1995; Lindinger et al., 1998); only a brief description will therefore be given here. The princi-ple of the instrument is the reaction of trace organic species in ambient air with H3O+ions, generated from the hollow-cathode discharge of water vapour, to give the protonated or-ganic species (RH+). Under typical operating conditions,
only a small proportion of the H3O+ ions reacts with the trace species, so that the concentration of the product ions may be calculated from Eq. (1):
(RiH+) = (H3O+)0(1 − e−ki(Ri)t) ≈ (H3O+)0(Ri)kit, (1) where kiis the reaction rate coefficient for the proton trans-fer reaction from H3O+to the species Ri, and t is the transit time for the H3O+ions in the drift tube assembly where the proton transfer reactions occur; the drift tube is held at a pres-sure of ca. 2 mbar. Only organic species with a proton affin-ity greater than that of water can be detected. The primary
(H3O+) and product ions are detected using a quadrupole mass spectrometer fitted with a secondary electron multiplier detector array.
During the MINOS campaign, over 40 masses were con-tinuously monitored using the PTR-MS instrument; the vast majority of these showed no significant signal except dur-ing a few biomass burndur-ing events seen on 15 and 17 August (see Sect. 3). The five protonated masses which could be ob-served and confidently identified (cf. Holzinger et al., 2001a, 2001b, 2003; Warneke et al., 2001; Williams et al., 2001) were as follows: 33 (methanol); 42 (acetonitrile); 59 (ace-tone); 79 (benzene) and 93 (toluene). The precision of indi-vidual measurements was estimated based on the detection limit for each species, calculated from the standard devia-tion of the background signal at each mass when no organic species were present, using a signal:noise ratio of 2:1. For 10-min average measurements (4 measurement points), the resulting precision values were calculated to be less than 10% for methanol, acetonitrile, and acetone, 21% for benzene, and 31% for toluene, based on typical measured mixing ratios during MINOS of 4, 0.3, 3, 0.2 and 0.06 nmol/mol, respec-tively. The accuracy of the measurements was largely limited by the accuracy of the rate coefficients, ki. In order to opti-mise the rate coefficients used for the particular conditions of our instrument, empirical calibration factors were derived for each species using a standard calibration gas mixture di-luted to cover a range of mixing ratios, from a few nmol/mol to about 1 µmol/mol. As the standard was rated to an accu-racy of 5%, the accuaccu-racy of the PTR-MS meaurements was estimated to be better than 10%.
2.2 Measurement site, instrument deployment and support-ing measurements
The PTR-MS instrument, together with a GC system for the measurement of peroxy acetyl nitrate (PAN; see Lange et al., 2003) and a 2D-GC instrument for the measurement of C7–C14 organic compounds (Xu et al., 2003a, b) were de-ployed in a measurement container situated ca. 50 m west of and some 20 m below the permanent Finokalia station, in a bend of the minor coastal road mentioned in the In-troduction. All three instruments sampled from a common 1/2” Teflon line leading to an inlet situated some 3 m above the roof of the container and supported on a mast. Canister measurements of light VOCs were also made at 6 h intervals throughout the campaign, and at much shorter intervals on several days (see Gros et al., 2003 for details.) Neighbour-ing containers housed instruments for aerosol/particle mea-surements (J¨ulich Research Centre/Mainz University; see Schneider et al., 2003) and OH and H2SO4 measurements (German Weather Service; see Berresheim et al., 2003). A range of other measurements were made at the Finokalia sta-tion during the campaign period, including standard mete-orological parameters, radon and thoron, DMS, NO, NO2, NOy, black carbon and O3, all carried out by the University
0.8 0.6 0.4 0.2 0.0 nmol/mol 31.07.01 05.08.01 10.08.01 15.08.01 20.08.01 Date Acetonitrile 10 8 6 4 2 0 nmol/mol 31.07.01 05.08.01 10.08.01 15.08.01 20.08.01 Date Methanol Acetone 0.8 0.6 0.4 0.2 0.0 nmol/mol 31.07.01 05.08.01 10.08.01 15.08.01 20.08.01 Date/time Benzene Toluene (a) (b) (c)
Figure 2. MINOS PTR-MS time-series of measurements.
Fig. 2. MINOS PTR-MS time-series of measurements.
of Crete, Heraklion, and CO, carried out by the National Cen-tre for Scientific Research (CNRS), Paris, France.
3 Results
3.1 Back trajectories and air-mass classification
The full time series of the PTR-MS measurements of methanol, acetone, acetonitrile, benzene and toluene at Fi-nokalia during MINOS are shown in Fig. 2. The data points used in Fig. 2 are 10-min averages with a 5-point running average applied, in order to show more clearly the trends ob-served during the campaign. Five-day back-trajectory cal-culations were made for the entire MINOS campaign pe-riod at six-hourly intervals for a pressure of 950 mbar using data provided by the European Centre for Medium-Range Weather Forecasting, Reading, UK, via the British Atmo-spheric Data Centre, Oxford, UK. Based on both the trajec-tory results and chemical tracers measured at Finokalia, in particular CO, black carbon and acetonitrile, the campaign as a whole was split into four distinct periods for the purposes
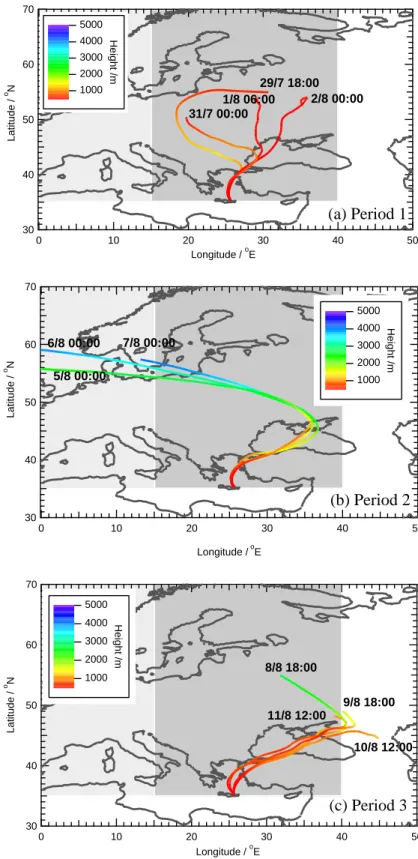
of further data analysis, as indicated in Fig. 3. Representative trajectories for Periods 1–3 are shown in Fig. 4, which shows that the air throughout all three periods arrived at Finokalia from the north, having passed over the Aegean Sea.
3.1.1 Period 1 (29 July–2 August) – Air advected from Eastern Europe in the boundary layer
In Period 1 (Fig. 4a), air originating in Eastern Europe was observed in Crete, although the position of the air mass five days prior to arrival at Finokalia shifted eastwards in the course of this period. The colour-scale for Fig. 4a (red=low, blue=high throughout) shows that the trajectory heights re-mained low (< 1200 m) throughout Period 1. The lowest mixing ratios of acetonitrile were observed at this time (mean 154 pmol/mol; see Table 1). Since acetonitrile has no signif-icant source other than biomass burning (Lobert et al., 1990; Holzinger et al., 1999), it may be inferred that biomass-burning influence on the measurements was at its minimum during this part of the campaign.
1 2 4 3 1.0 0.8 0.6 0.4 0.2 0.0 Acetonitrile (nmol/mol) 31.07.01 05.08.01 10.08.01 15.08.01 20.08.01 Date/time 250 200 150 100 50 0 CO (nmol/mol) Acetonitrile CO
Figure 3. The time periods defined for data analysis during MINOS.
Fig. 3. The time periods defined for data analysis during MINOS.
Table 1. Selected means for Periods 1–3
Speciesa Period 1 Period 2 Period 3
Methanol 3.34 3.64 6.13 (0.61) (1.25) (1.20) Acetone 2.87 3.23 4.53 (0.19) (0.34) (0.54) Acetonitrile 0.154 0.245 0.436 (0.024) (0.063) (0.082) Benzene 0.129 0.197 0.376 (0.068) (0.079) (0.134) Toluene 0.038 0.061 0.080 (0.024) (0.054) (0.059) CO 166.7 125.6 209.1 (14.5) (13.5) (33.9) Black carbonb 749.4 872.5 2246.6 (305.5) (211.4) (586.9) Radonc 1.80 1.08 1.95 (0.21) (0.19) (0.45) Ozone 62.1 55.6 66.4 (6.7) (6.7) (2.6)
aAll species in nmol/mol except where indicated; standard
devia-tions are in parentheses.
bngC m−3
cmBq m−3
3.1.2 Period 2 (4–7 August) – Western European free tro-pospheric air
During Period 2 (Fig. 4b), the air arriving at Finokalia orig-inated above the boundary layer in Western Europe, and was advected approximately east-south-east, before descend-ing and turndescend-ing south-west over the Black Sea and north-western Turkey. “Non-biomass-burning” anthropogenic in-fluence was at its minimum in this part of the campaign, with mean mixing ratios of carbon monoxide and ozone, for ex-ample, of 126 and 56 nmol/mol, respectively.
3.1.3 Period 3 (8–12 August) – Eastern European air heav-ily influenced by biomass burning
In Period 3 (Fig. 4c), air masses were once again advected from Eastern Europe, but now passed consistently east and south of/over the Sea of Azov; the trajectory height 5 days before Finokalia varied between nearly 3000 m at the start of Period 3 and less than 900 m at its end. A notable peak in acetonitrile, CO and black carbon of long duration occurred during this period, associated with a prolonged biomass-burning event. The average acetonitrile mixing ratio dur-ing this period was 436 pmol/mol, and carbon monoxide was also considerably higher than earlier in the campaign (Pe-riods 1 and 3 mean mixing ratios 167 and 209 nmol/mol, respectively; see Table 1). Evidence for a large number of fires around the Sea of Azov at this time is provided by the MODIS satellite pictures available from NASA at http://visibleearth.nasa.gov/cgi-bin/viewrecord?9323. 3.1.4 Period 4 (12–21 August) – Mixed trajectory origins;
biomass-burning influence
The pattern of trajectories for the remaining part of the cam-paign was far less consistent, being a mixture of those pat-terns observed in Periods 1–3, although biomass-burning in-fluence remained high until the end of the campaign (see the acetonitrile trace in Fig. 2). The campaign maximum mixing ratios of both acetone and methanol were observed in two short events during Period 4, on 15 and 17 August. Acetonitrile also exhibited pronounced peaks at these times (Fig. 2b), demonstrating that these periods were associated with short, recent biomass-burning events. Peaks of benzene and toluene, as well as most other masses monitored by the PTR-MS instrument during MINOS, were observed at the same time (Fig. 2c). These short events are discussed further in Sect. 4. Otherwise, however, owing to the difficulties in characterising the air masses in Period 4, further analyses in this paper concentrate solely on Periods 1–3.
3.2 Comparison of Periods 1, 2 and 3 3.2.1 Biomass-burning signature
Periods 1 and 3 provide an interesting contrast between air masses essentially free of direct biomass-burning influence (Period 1; mean acetonitrile mixing ratio 154 pmol/mol) and air masses strongly influenced by biomass burning (Period 3; mean acetonitrile mixing ratio 436 pmol/mol). Figure 5 shows the time series of the acetonitrile:CO ratio through-out the campaign, where both increased values and increased variability in the measurements after Period 1 are clearly dis-cernible. The frequency distributions for the same ratio in Period 1 only and for all data later in the campaign (not shown) were also significantly different, with a single maxi-mum at 0.0009 for Period 1 and a single maximaxi-mum at 0.0020 for the rest of the campaign. It is also of interest to note
70 60 50 40 30 Latitude / o N 50 40 30 20 10 0 Longitude / oE 5/8 00:00 6/8 00:00 7/8 00:00
(b) Period 2
5000 4000 3000 2000 1000 Height /m 70 60 50 40 30 Latitude / o N 50 40 30 20 10 0 Longitude / oE 29/7 18:00 1/8 06:00 2/8 00:00 31/7 00:00(a) Period 1
5000 4000 3000 2000 1000 Height /mFigure 4. Five-day back trajectories calculated from Finokalia during the MINOS campaign (950 HPa) using ECMWF data (courtesy of the British Atmospheric Data Centre, UK). Times marked are arrival times at Finokalia (UT). The shaded areas represent the Western European (light grey; 35-70N, 10W-15E) and
Eastern European (dark grey; 35-75N, 15E-40E) source regions used in the MATCH-MPIC model (see Section 3.3).
70 60 50 40 30 Latitude / o N 50 40 30 20 10 0 Longitude / oE 11/8 12:00 8/8 18:00 10/8 12:00 9/8 18:00
(c) Period 3
5000 4000 3000 2000 1000 Height /mFigure 4. Five-day back trajectories calculated from Finokalia during the MINOS campaign (950 HPa) using ECMWF data (courtesy of the British Atmospheric Data Centre, UK). Times marked are arrival times at Finokalia (UT). The shaded areas represent the Western European (light grey; 35-70N, 10W-15E) and Eastern European (dark grey; 35-75N, 15E-40E) source regions used in the MATCH-MPIC model (see Section 3.3).
Fig. 4. Five-day back trajectories calculated from Finokalia during the MINOS campaign (950 HPa) using ECMWF data (courtesy of the
British Atmospheric Data Centre, UK). Times marked are arrival times at Finokalia (UT). The shaded areas represent the Western European (light grey; 35–70◦N, 10◦W–15◦E) and Eastern European (dark grey; 35–75◦N, 15◦E–40◦E) source regions used in the MATCH-MPIC model (see Sect. 3.3).
5 4 3 2 1 0 CH3CN/CO (pmol/nmol) 31.07.01 05.08.01 10.08.01 15.08.01 Date/time Period 1
Figure 5. The acetonitrile:CO ratio during MINOS. Note that for clarity the units here are pmol/nmol, as opposed to nmol/nmol used in the text.
Fig. 5. The acetonitrile:CO ratio during MINOS. Note that for
clar-ity the units here are pmol/nmol, as opposed to nmol/nmol used in the text.
Table 2. Mean values of selected tracer ratios during MINOS
Ratioa Period 1 Period 2 Period 3
Toluene:benzene 0.35 0.37 0.22 (0.55) (0.72) (0.17) Acetone:methanol 0.88 0.97 0.76 (0.13) (0.28) (0.11) Acetonitrile:CO 0.0009 0.0019 0.0021 (0.0001) (0.0005) (0.0003) Methanol:CO 0.020 0.028 0.030 (0.003) (0.008) (0.005) Acetone:CO 0.017 0.026 0.022 (0.001) (0.002) (0.002)
aAll ratios in nmol/nmol; standard deviations are in parentheses.
that the mean acetonitrile:CO ratio in Period 3 (see Table 2), and the mode of the frequency distribution of this quantity (not shown) for the whole campaign after 06:00 on 2 August (0.0021 and 0.0019, respectively) both match very well the acetonitrile emission factor relative to CO measured in the laboratory in Mainz 2000 of 0.20% (Holzinger et al., 2002a). It follows, therefore, that only Period 1 of the campaign may be taken to have been essentially free of direct biomass-burning influence; the peak in biomass-biomass-burning signal was indeed in Period 3 (see Table 1 and Fig. 3), but some influ-ence of biomass burning was seen throughout the campaign after 2 August. This is clear from the mean quantities given in Table 1: black carbon and benzene, for example, were both higher on average in Period 2 than in Period 1 (mean black carbon concentrations 872.5 and 749.4 ngC m−3; mean benzene mixing ratios 197 and 129 pmol/mol, respectively), despite the relatively low CO levels during this part of the campaign.
3.2.2 Tracer ratios
Table 2 shows that the acetone:methanol ratio averaged 0.9– 1.0 in Periods 1 and 2, but was lower (mean < 0.8) in Period 3. Since the atmospheric lifetimes of acetone and methanol for conditions at Finokalia (using the Period 2 mean OH concentration of 3.6 × 10⁶ molecules cm−3 and measured UV irradiances) were ca. 11 and 3.5 d, respec-tively, it may be concluded that methanol emission from the biomass burning observed in Period 3 was greater than acetone emission. This qualitative conclusion is supported by laboratory biomass-burning measurements made using a PTR-MS instrument in Mainz in 1997 and 2000, where the mean emission factors, expressed as a percentage of CO emission, were 0.64 and 0.77% for methanol, and 0.54 and 0.35% for acetone, respectively (Holzinger et al., 1999; Holzinger et al., 2002a). For comparison, the estimates given by Andreae and Merlet (2001) for the burning of agricultural residues, savannah/grassland and extratropical forest were all ca. 2% for methanol and 0.5–0.7% for acetone. The methanol:CO and acetone:CO ratios show the same pattern, so that the mean methanol:CO ratio in Period 3 (0.030) was 50% higher than in Period 1 (0.020), whereas the acetone:CO ratio was on average only 29% higher in Period 3 (0.022) than in Period 1 (0.017). Looking at the data in a differ-ent way, we note that the enhancemdiffer-ents in the mixing ra-tios for CO, acetone and methanol from Period 1 to Period 3 were 42.4, 1.66, and 2.79 ppbv, respectively, based on the averages given in Table 1. If we assume that these enhance-ments were entirely due to biomass burning, we obtain the “biomass-burning” methanol:CO and acetone:CO ratios 6.5 and 3.9%, respectively. Clearly these ratios are much higher than the PTR-MS lab measurements and literature values of the emission ratios, and may indicate secondary production of both species in the biomass-burning plume (see for ex-ample Mauzerall et al., 1998; Reiner et al., 2001; Jacob et al., 2002), and/or that the observed enhancements were not simply due to biomass burning (see Sect. 4.1).
3.2.3 Diel cycles
Figures 2 and 3 show that pronounced diel cycles were ob-served both in the PTR-MS measurements and in the CO measurements during MINOS. The mean diel cycles for methanol, acetone, acetonitrile, CO, ozone and wind direc-tion are given for Periods 1 and 3 in Fig. 6. The first point to note when considering Fig. 6 is that the averaged cycles shown represent less than four complete days in each case. Nevertheless, without over-interpreting the data, several in-teresting points can be made from this analysis. First, it may be noted that none of the trace gases were strongly correlated or anti-correlated with changes in local wind direction for either campaign period (bottom panels of Fig. 6), with the possible exception of ozone in Period 3. This supports our assertion that local emissions and orographic features at the
0.20 0.18 0.16 0.14 0.12 Acetonitrile /ppbv 24 20 16 12 8 4 0 Local time 200 190 180 170 160 150 140 CO /ppbv Acetonitrile CO 8.0 7.5 7.0 6.5 6.0 5.5 5.0 4.5 4.0 Methanol /ppbv 24 20 16 12 8 4 0 Local time 6.0 5.5 5.0 4.5 4.0 3.5 3.0 Acetone /ppbv Methanol Acetone 5.0 4.5 4.0 3.5 3.0 2.5 2.0 Methanol /ppbv 24 20 16 12 8 4 0 Local time 3.4 3.2 3.0 2.8 2.6 Acetone /ppbv Methanol Acetone 0.60 0.55 0.50 0.45 0.40 0.35 0.30 Acetonitrile /ppbv 24 20 16 12 8 4 0 Local time 250 240 230 220 210 200 190 180 CO /ppbv Acetonitrile CO 74 72 70 68 66 64 62 60 Ozone /ppbv 24 20 16 12 8 4 0 Local time 290 280 270 260 250 240 Wind direction / o Ozone Wind direction 70 68 66 64 62 60 58 56 Ozone /ppbv 24 20 16 12 8 4 0 Local time 290 280 270 260 250 Wind direction / o Ozone Wind direction
Period 1
Period 3
Figure 6. Mean diel cycles for selected trace gases and wind direction
during Periods 1 and 3 of MINOS.
Fig. 6. Mean diel cycles for selected trace gases and wind direction during Periods 1 and 3 of MINOS.
Finokalia site did not affect the PTR-MS measurements to any significant degree. Second, while in Period 3 there was a clear daytime peak of ozone, suggestive of local photochem-ical ozone production, the ozone diel cycle in Period 1 was more complex, and clearly involved the interplay of chemi-cal and dynamichemi-cal effects. Since inspection of Fig. 6 shows also that none of the other trace gases correlated strongly
with ozone during either period, we can be confident that the other diel cycles observed, in particular for the purposes of the present work those of methanol and acetone, were not simply owing to local photochemistry. To check this con-clusion, the trajectories obtained for Period 1 were used to calculate approximate hours of daylight experienced by the air en route to Finokalia from the Turkish coast. Although
the peaks in ozone were found to correspond approximately to the calculated peaks in the number of daylight hours en route to the measurement site, no correlation, either positive or negative, was observed between either methanol or ace-tone and the number of daylight hours in this manner. More-over, in Period 1, general decreases in methanol, acetone and CO were observed between ca. 08:00 and 18:00 local time, although it must be noted that the acetone diel cycle in Pe-riod 1 was much weaker than the the other two, and might not be significant. The acetonitrile profile shows that the de-gree of biomass-burning influence at this time was small and variable, although clearly non-zero. Acetonitrile was not cor-related with any other parameter, and was likely controlled by the emission rates from distant sources.
In Period 3, methanol, CO and acetonitrile all showed clear decreases between ca. 09:00 and 19:00 local time. One possible explanation for these observations is that the increasing radiation-induced turbulence during the daytime mixed less polluted free tropospheric air into the boundary layer. If this were the case, the overlying air must have been rather less influenced by biomass burning, to judge from the acetonitrile diel cycle. The acetone diel cycle does not fit this pattern, however, and it seems clear from Fig. 6 that pho-tochemical production of acetone was also occurring at this time, presumably due to higher levels of photochemical pre-cursors than those observed in Period 1 of the campaign. It may be noted that acetone began to rise at ca. 04:00 local time, i.e. before sunrise and long before ozone started to rise (ca. 08:00), which would indicate that the photochemical acetone production observed was not occurring locally. The combination of diel cycling in the importance of the biomass-burning influence (cf. the methanol diel cycle) and regional photochemical production of acetone ensured that the aver-aged acetone peak did not coincide with those of either ozone or acetonitrile.
The diel cycle of methanol in Period 3 is particularly strik-ing, and since methanol is highly water-soluble, a possible role of the ocean, either through uptake, emission or possibly both, cannot be ruled out. Indeed, the amplitude of the diel variation (defined as 90th percentile-10th percentile/mean mixing ratio) for methanol was much greater in both peri-ods (35 and 41%, respectively) than for acetone (8 and 17%, respectively).
In summary, consideration of Fig. 6 provides evidence that the diel cycles observed during MINOS were mainly as a result of advection to the site and/or vertical mixing, with evidence of photochemical production only seen in the cases of ozone (possibly in both periods) and acetone in Period 3.
3.3 Comparison of the acetone and methanol measure-ments with the MATCH-MPIC model output
3.3.1 Introduction to the MATCH-MPIC model
The model runs here were done with the Model of Atmo-spheric Transport and Chemistry, Max Planck Institute for Chemistry version 3.0 (hereafter MATCH-MPIC), described and evaluated in Rasch et al. (1997), Mahowald et al. (1997a, b), Lawrence et al. (1999), and von Kuhlmann (2001), and references therein. MATCH is an offline model that uses ba-sic meteorological parameters (pressure, temperature, hori-zontal winds, surface heat fluxes, and surface stresses) from the National Centers for Environmental Prediction (NCEP) aviation forecasts (Caplan and Pan, 2000). The meteorology component of MATCH simulates advective transport, con-vection, vertical diffusion, cloud fractions, and cloud micro-physics (Lawrence et al., 1999). A horizontal resolution of approximately 2.8◦×2.8◦(T42) was used in this study.
The tropospheric chemistry module of MATCH-MPIC is described in detail in Lawrence et al. (1999), von Kuhlmann (2001), and von Kuhlmann et al. (2003a,b) (see also http:// www.mpch-mainz.mpg.de/∼kuhlmann). It includes isoprene
chemistry based on the Mainz Isoprene Mechanism (P¨oschl et al., 2000), as well as representations of ethane, propane, ethene, propene, and n-butane (von Kuhlmann, 2001). Pho-tochemical production of acetone in the model occurs explic-itly solely from propane; higher iso-alkanes do not represent a source of acetone, since n-butane chemistry, which is used as a pool for higher alkanes, does not produce acetone. Ace-tone from oxidation of terpenes is not explicitly included, but is accounted for as part of the total biogenic emissions of 40 Tg yr−1, which are emitted using the distributions and sea-sonality of terpenes and other hydrocarbons given by Guen-ther et al. (1995) in equal weights. This figure is likely too low in the light of the review by Jacob et al. (2002), but is nevertheless higher than in earlier modelling studies. Surface sources are included for NOx, CO and non-methane hydro-carbons (NMHCs) from industrial activities, biomass burn-ing, and soils; the model also includes lightning NOx and aircraft emissions. Dry deposition and wet scavenging losses are computed based on the modelled meteorological param-eters.
3.3.2 Results
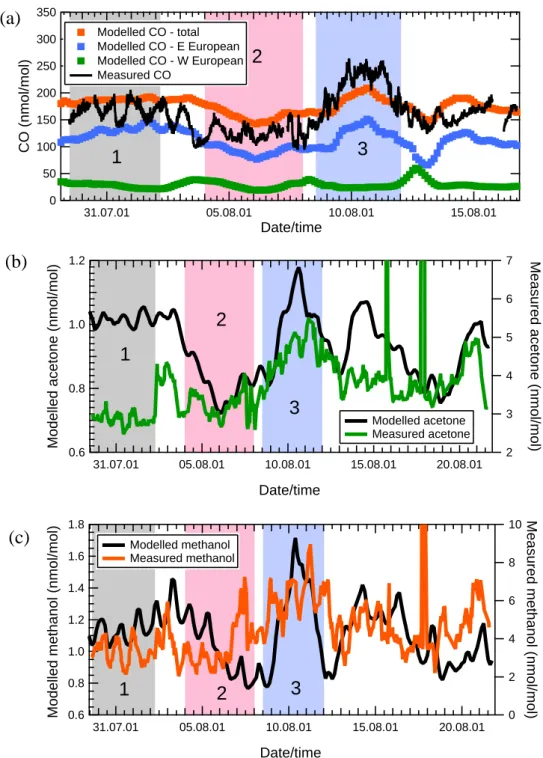
The model-output CO data interpolated to the position of Finokalia are plotted together with the measurements in Fig. 7a. Also included in Fig. 7a are the Western European and Eastern European (the two highest) source contributions to the modelled total CO mixing ratios. Figure 7a shows that Eastern Europe dominated the CO source in the MATCH results, as expected from the trajectory analyses presented previously, and also that the trends and structure in the to-tal modelled CO derived largely from the Eastern European
1
2
3
1.2 1.0 0.8 0.6Modelled acetone (nmol/mol)
31.07.01 05.08.01 10.08.01 15.08.01 20.08.01 Date/time 7 6 5 4 3 2
Measured acetone (nmol/mol)
Modelled acetone Measured acetone
1
2
3
1.8 1.6 1.4 1.2 1.0 0.8 0.6Modelled methanol (nmol/mol)
31.07.01 05.08.01 10.08.01 15.08.01 20.08.01 Date/time 10 8 6 4 2 0
Measured methanol (nmol/mol)
Modelled methanol Measured methanol
1
2
3
350 300 250 200 150 100 50 0 CO (nmol/mol) 31.07.01 05.08.01 10.08.01 15.08.01 Date/time Modelled CO - total Modelled CO - E European Modelled CO - W European Measured CO(a)
(b)
(c)
Figure 7. Comparison of MINOS measurements with MATCH-MPIC model output for (a) CO, (b) acetone, (c) methanol. Periods 1-3 are marked in each panel.
Fig. 7. Comparison of MINOS measurements with MATCH-MPIC model output; Periods 1–3 are marked in each panel.
contribution. The general levels of the measurements, the rel-atively high levels in Period 1, and the relrel-atively low levels in Period 2 are all captured well by the MATCH-MPIC model. These features represent good evidence that the meteorology in the model was functioning well, and provides a solid basis for comparison of the MATCH acetone and methanol data with the measurements. The model CO also shows a pro-nounced peak in Period 3. However, the MATCH model uses
a climatological fire scheme, so that this peak (much shorter and sharper than that seen in the measurements) will not rep-resent the actual fires burning at that time.
The model-output acetone and methanol mixing ratios in-terpolated to the position of Finokalia are plotted together with the PTR-MS measured values in Figs. 7b and c, re-spectively. It is important to note that in each case the 5-point smoothed measured data are used (as in Fig. 2), and
are plotted on a different scale. Figure 7b shows that the relatively low levels in Period 2, as well as the peak in Pe-riod 3, were both reproduced in the modelled acetone data, although the absolute mixing ratios were considerably lower throughout. On average the acetone measurements were four times higher than the model (model: measurement ratio 0.26; standard deviation 0.05). A similar pattern was evident in the methanol comparison (Fig. 7c), where the highest methanol levels were observed during Period 3 in both model and mea-surements, but once again the absolute mixing ratios were lower than the measured values by a factor of ca. 4 (mean methanol model:measurement ratio over the whole MINOS period 0.28; standard deviation 0.10).
As noted in Sect. 3.2.3, diel cycles were evident in the measurements of both species, but particularly marked for methanol (see Figs. 3 and 6). Similar cycles were observed in the model output, albeit not necessarily exactly synchronous, and of smaller amplitude. These results suggest that the model captured rather well at least the chemical behaviour of both species, since the chemical mechanisms of produc-tion and loss of acetone and methanol in the atmosphere are quite dissimilar. Acetone is produced in quite high yield from the oxidation of a range of volatile organic compounds, and is photolysed quite rapidly, whereas methanol is pro-duced largely from methane oxidation (see Sect. 4.2) and is not photolysed (Singh et al., 2000; Jacob et al., 2002). The large shortfall in the modelled levels of acetone and methanol seems likely, therefore, to be due to deficiencies in the emis-sions inventory of methanol and acetone themselves, as well as in acetone’s chemical precursors. This conclusion is sup-ported by the comparison of MINOS propane measurements with MATCH output propane data presented by Gros et al. (2003); MATCH was found to underestimate propane (a sig-nificant precursor of acetone) by a factor of 1.5–3. This de-ficiency in propane is, however, not sufficient to explain the shortfall in acetone. Even assuming 100% yield of acetone from OH-oxidation of propane, the MINOS campaign mean propane mixing ratio of 235 pmol/mol implies an upper limit to the “missing” acetone of ca. 0.8 nmol/mol, taking into count the different lifetimes of the two species. Since the ac-tual mean acetone deficit over the whole MINOS campaign (excluding the short biomass-burning peaks in Period 4) was 2.9 nmol/mol, we can conclude that a maximum of ca. 30% of the shortfall in acetone mixing ratios in the MATCH re-sults can be accounted for by deficiencies in propane emis-sions in the model.
Figure 7 also shows, however, that the
model:measurement ratio for both compounds was rather variable over the campaign as a whole, suggesting weak-nesses in the distribution of emissions in the model, and that emissions are underestimated to differing extents according to type and source region. In the case of methanol, these observations in turn suggest that the relatively high mixing ratios measured during MINOS arose largely from direct emissions.
4 Discussion
4.1 Use of the toluene:benzene ratio as an indicator of air mass age
Table 2 indicates that the toluene:benzene ratio was consid-erably lower in Period 3 (0.22) than in Periods 1 and 2 (0.35 and 0.37, respectively); this observation is explicable with reference to the emission ratios of the two species. Anthro-pogenic emissions typically have a toluene:benzene ratio of 2–3:1, whereas the biomass-burning emission ratio is of the order of 1:2 (Merlet and Andreae, 2001).
The use of the toluene:benzene ratio to indicate the time since an air mass last encountered anthropogenic emissions (commonly known as the air mass “age”) is based on the differing rates of reaction of the two compounds with the OH radical, as shown in Eq. (2) (see for example, Roberts et al., 1984; McKenna et al., 1995).
Air mass age ≈ {ln(X/Y)0−ln(X/Y)t}/{(kX−kY)∗(OH)}, (2) where X represents toluene, Y benzene, t represents the time since the compounds were emitted into the atmosphere (at time t = 0), k is the rate coefficient for the reaction of each compound with OH, and (OH) represents an integrated OH concentration over the lifetime of the air mass. The calcu-lation assumes that there is one well-defined source of both compounds, there are no other significant chemical or physi-cal losses of either molecule, and that mixing of the air mass with “background” air has no significant effect on the ratio. In practice, since the lifetime of benzene in the atmosphere is considerably longer than that of toluene, mixing has the effect of artificially reducing the toluene:benzene ratio. Air mass ages calculated by this technique must therefore be con-sidered as upper limits. Other assumptions in the calculation are the toluene:benzene emission ratio and the OH concen-trations assumed. For Periods 1 and 2, the toluene:benzene emission ratio was taken to be ca. 3:1, assuming that mea-surements of these species in central Athens (Moschonas and Glavas, 1996) are representative of urban centres over the wider source region observed in this study. For Period 3, the last emissions of toluene and benzene were assumed for the purposes of this calculation to be from biomass burning. However, the toluene:benzene emission ratio for the burn-ing of agricultural residues calculated from data presented by Andreae and Merlet (2001) is 0.19, which is lower than the mean toluene:benzene ratio measured in Period 3 of 0.22 (Table 2), and therefore clearly much too low. Consequently as a starting point for discussion the emission ratio of 0.57 for the “savannah-grassland” vegetation type (Andreae and Merlet, 2001) was used (see below). The 24-h mean OH concentrations measured at Finokalia during Periods 2 and 3 of MINOS were used in the calculation; since there were no OH measurements available for Period 1, the Period 2 24-h average concentration of 3.6 × 10⁶molecules cm−3was also used in the air mass age calculation for this period.
The mean air mass ages for Periods 1 and 2 were 35 h and 34 h, respectively. Examination of the back trajectories for these periods showed that the time since the air sampled at Finokalia left the coast of the mainland varied between 12.5 and 20 h for Period 1, and 12 and 29 h for Period 2. The cal-culated air mass ages seem reasonable, therefore, and suggest that the air measured at Finokalia during these periods was last polluted in north-western Turkey (Istanbul region; see Figs. 4a and b).
The calculated mean air mass age for Period 3 was just 15 h, even using a biomass-burning toluene:benzene emis-sion ratio of 0.57 rather than 0.19. However, this result will be too low if the air was also influenced by anthropogenic emissions. Evidence that this was indeed the case is pro-vided by the methyl chloroform data, presented by Gros et al. (2003), since the levels of this tracer were also elevated during part of Period 3. The time since the air sampled at Finokalia during Period 3 left the coast of the mainland var-ied between 12 and 21.5 h, based on the trajectory analy-sis. As noted previously, satellite pictures taken at this time confirmed high biomass-burning activity in Eastern Europe north and east of the Black Sea. Clearly, however, the air later sampled at Finokalia then passed over populated areas in Turkey, as in Periods 1 and 2, so that the biomass-burning influence will inevitably have been mixed with additional an-thropogenic emissions, as our data show.
Air mass ages were also calculated for the short-duration biomass burning events observed with the PTR-MS instru-ment on 15 and 17 August (during Period 4; see Fig. 2) us-ing the Period 4 24-h average OH concentration of 4.9 × 10⁶ molecules cm−3. During these short periods, benzene reached up to ca. 1.3 nmol/mol and toluene was up to a max-imum of ca. 0.4 nmol/mol. The air mass ages were calculated to be 10.9 h for 15 August and 16.6 h for 17 August. Exam-ination of the trajectories showed that the time since these air masses had left the coast of the mainland was ca. 14.5 h for 15 August and ca. 20 h for 17 August. Since, as already noted, these calculated air mass ages are essentially upper limits, these results suggest that the short-duration fires oc-curred on one or more of the Greek islands, possibly in the Cyclades. Moreover, the sharpness of these peaks itself sug-gests that the fires were considerably closer to Finokalia than those observed in Period 3.
In summary, the use of the toluene:benzene ratio to calcu-late air mass age during MINOS has proved broadly consis-tent with the trajectory information, although clearly the ap-proach is limited both by the emissions ratio assumed – espe-cially where more than one emission source type is present, as here for Period 3 – and the OH concentrations used. It is by no means clear that the OH concentrations measured at Finokalia were representative of those in the air on its path from Turkey to the measurement site.
8 7 6 5 4 3 2 1 Acetone (nmol/mol) 8 6 4 2 Methanol (nmol/mol) 31.07.01 05.08.01 10.08.01 15.08.01 20.08.01 Date/time
Figure 8. Correlation between acetone and methanol for the entire MINOS period excluding short biomass-burning events on 15th and 17th August.
Fig. 8. Correlation between acetone and methanol for the entire
MINOS period excluding short biomass-burning events on 15 and 17 August.
4.2 Sources of acetone and methanol during MINOS As discussed in Sect. 3, the MATCH-MPIC model underes-timated the measured acetone and methanol measurements by a factor of 3–4 during MINOS. This result suggested that the relatively high mixing ratios of methanol measured dur-ing MINOS arose largely from direct emissions, as, unlike acetone, its photochemical production in the atmosphere is slow (see Section 3.2.3 and below). However, as discussed in the Introduction (see Singh et al., 2000; Jacob et al., 2002) the emission inventories of both compounds are rather poorly understood, both qualitatively and quantitatively.
4.2.1 Relationships between acetone, methanol and CO Figure 8 shows that acetone and methanol were, over the campaign as a whole, fairly well correlated (r2 = 0.58). This in itself suggests common emission sources, since, as noted previously, the photochemical routes to formation and destruction of the two species are very different in the atmo-sphere. The colour coding in Fig. 8, with respect to date and time, shows that the gradient of the correlation was rather different in Period 1 (0.22; r2 = 0.52) compared to later in the campaign (0.33; r2 = 0.57), where biomass-burning influence was significant (lines of best fit not shown). The fact that these two gradients were different, and the extent of correlation in Period 1 (r2 = 0.52) shows that the likely common sources of the two compounds were not simply biomass-burning sources. The analogous correlations from the MATCH data showed similar trends over the campaign as a whole (gradient 0.39; r2=0.52) and post-Period 1 (gra-dient 0.38; r2=0.58). However, in Period 1 the correlation between modelled acetone and methanol was very low (gra-dient 0.09; r2 = 0.07). This result suggests again that the emissions of both species, from common sources other than
biomass burning, were greatly underestimated in the model. Again it must be noted, however, that acetone may have been predominantly a secondary photochemical product of com-pounds co-emitted with methanol.
Despite the good correlation observed between methanol and acetone during MINOS, the relationships between the two species and CO were somewhat different. Over the whole campaign, the extent of CO-acetone correlation (r2=
0.39) was similar to that between methanol and CO (r2 =
0.36). However, this result conceals the fact that the level of correlation of the two species with CO in Period 1 was differ-ent to that found later in the campaign. In Period 1, methanol was better correlated with CO (r2=0.43) than was acetone (r2=0.24). For acetone, the quite poor correlation between acetone and CO in the boundary layer described here may indicate that biogenic sources of acetone dominated during Period 1, since, where anthropogenic emissions are impor-tant, a high correlation is invariably observed (cf. de Reus et al., 2003). Since biomass-burning influence was low at this time, the relatively high correlation between methanol and CO can only be rationalized by one or more of three explana-tions: first, a significant anthropogenic source of methanol in Eastern Europe; second, biogenic emissions of methanol and reactive organic species such as isoprene, followed by sec-ondary photochemical production of CO; or third, concomi-tant photochemical production of CO and methanol from the oxidation of methane under relatively low-NOx conditions via the self-reaction of methylperoxy radicals:
CH3O2+CH3O2→CH2O + CH3OH + O2. (3) The lack of good correlation between CO and acetone sug-gests that the second and/or third of these explanations may be the most likely. Moreover, recent reviews of the global methanol budget (Galbally and Kirstine, 2002; Heikes et al. 2002) suggest that the global anthropogenic source of methanol may be relatively small. Galbally and Kirstine (2002) estimate a global anthropogenic source of methanol in the range 3–5 Tg yr−1. The total source estimate they derive is 83–260 Tg yr−1, which implies a maximum es-timated anthropogenic contribution of ca. 6%. Heikes et al. (2002) estimate an anthropogenic methanol source term of 5–11 Tg yr−1, with a total source of 90–490 Tg yr−1. These figures imply a maximum anthropogenic contribution to methanol of ca. 12%. A rather higher anthropogenic con-tribution to methanol mixing ratios (20%) was derived by Schade and Goldstein (2001) based on measurements made in a ponderosa pine plantation in the Sierra Nevada moun-tains, although the authors stress that this figure should be treated as an upper limit (Sect. 3.2, p. 3115). Even assum-ing that up to 20% of the methanol observed durassum-ing MINOS was of anthropogenic origin, we propose that only strong biogenic emissions are realistically able to explain the high methanol mixing ratios observed during Period 1 of MINOS, where biomass-burning influence was at a minimum. The
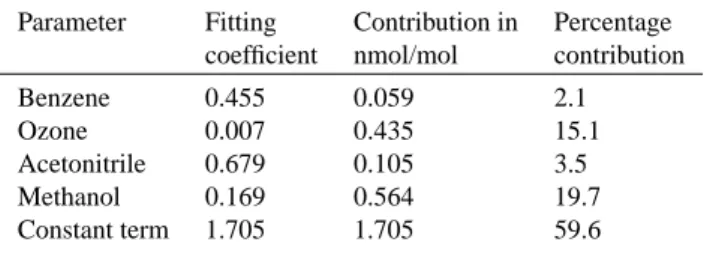
Table 3. Fitting coefficients obtained in the multiple regression
analysis performed on the acetone data in Period 1 of MINOS (29 July – 2 August 2001), where biomass-burning influence was at its minumum.
Parameter Fitting Contribution in Percentage
coefficient nmol/mol contribution
Benzene 0.455 0.059 2.1
Ozone 0.007 0.435 15.1
Acetonitrile 0.679 0.105 3.5
Methanol 0.169 0.564 19.7
Constant term 1.705 1.705 59.6
correlation of methanol with benzene, a well-known anthro-pogenic tracer, for Period 1 gave a correlation coefficient (r2 value) of just 0.08. Moreover, methanol production from methane is very slow, and only likely to occur to any ap-preciable extent where NOxis very low. In fact, assuming a rather high 24-h mean CH3O2mixing ratio of 20 pmol/mol, and that the yield of methanol from the methylperoxy self-reaction is 100%, which is far from the case, we calcu-lated a methanol production rate of just 29 pmol/mol/d using the latest IUPAC recommended rate data (available at http: //www.iupac-kinetic.ch.cam.ac.uk/). This amount is clearly far too small to be a significant factor in the form of the methanol diel cycle observed during MINOS. The only other known mechanism of photochemical production of methanol in the atmosphere is the photolysis of glycolaldehyde, de-rived from isoprene oxidation, with an estimated yield based on isoprene of ca. 2–3% (G. Moortgat, personal communi-cation, 2002), and biomass burning (Christian et al., 2003, and references therein). The importance of this source in the absence of biomass burning is difficult to quantify, but this does not in itself affect the argument made here, since this process too represents a biogenic source of methanol.
The correlation coefficients (r2 values) in linear correla-tions with CO for all data after Period 1 (excluding the short biomass burning events seen on 15 and 17 August) were 0.48 for methanol and 0.69 for acetone. The gradient of the acetone-CO correlation also shifted, from 0.006 in Period 1 to 0.014 over the rest of the campaign (cf. de Reus et al., 2003). The extent of correlation between methanol and CO did not change greatly between the non-biomass-burning in-fluenced air masses and the biomass-burning inin-fluenced air masses. However, given the very different conditions en-countered in the two periods, this seems likely to be coin-cidental. The good correlation between acetone and CO in Period 3 was almost certainly due to both direct emission of acetone during biomass burning and rapid oxidation of other emitted compounds to generate acetone in the early life of the burning plume (Mauzerall et al., 1998; Reiner et al., 2001; Jacob et al., 2002).
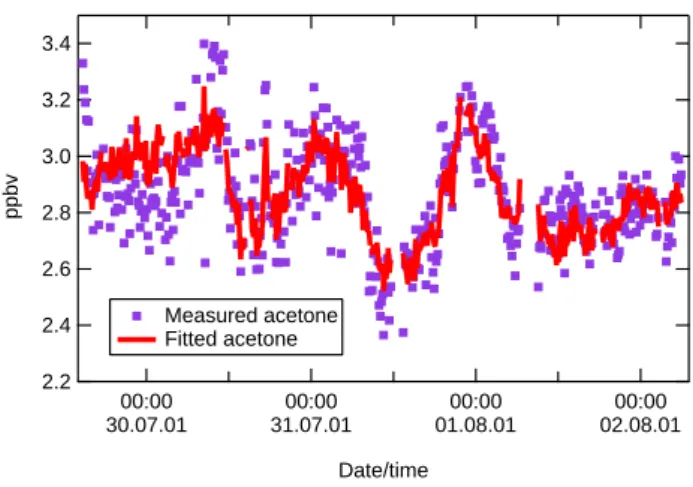
3.4 3.2 3.0 2.8 2.6 2.4 2.2 ppbv 00:00 30.07.01 00:00 31.07.01 00:00 01.08.01 00:00 02.08.01 Date/time Measured acetone Fitted acetone
Figure 9. Measured acetone for Period 1 compared with the results of a multivariate fitting analysis.
Fig. 9. Measured acetone for Period 1 compared with the results of
a multivariate fitting analysis.
4.2.2 Multiple regression analysis of acetone data in Pe-riod 1
Assuming that the methanol observed during MINOS de-rived predominantly from biogenic emissions, it follows that this species may be used to a first approximation as a bio-genic emission tracer. Consequently, a multiple regression analysis was carried out on the acetone data for Period 1, in order to examine further the sources of this compound where biomass-burning influence was at its minimum in the cam-paign. In this technique, the measurement series were fitted to a linear combination of other measurements, using an ex-pression of the form:
Fit(Acetone) = a + b∗(parameter x1) +c∗(parameter x2) + ...(4) where the fitting parameter a represents the background mixing ratio of acetone. The independent measurement series were chosen to represent different possible acetone sources, namely benzene for anthropogenic emission, ozone for photochemical production, acetonitrile for biomass burn-ing emission, and methanol for biogenic emission. In this analysis, no attempt was made to define and substract back-ground mixing ratios for the longer-lived tracers prior to the fitting procedure, because of the paucity of measurements available in this region. Tests showed that subtraction of constant values from individual tracers made no difference to the fit achieved, but merely served to raise the value of the constant, background term in the resulting analysis. The fit obtained is plotted in Fig. 9, while the chi-squared (χ2) statistic, used to gauge the goodness of fit for the parameter-isation, was 6.8 (where a value of 1 indicates a perfect fit). Figure 9 shows that the trends in the measurements are well captured in the fit, although the highs and lows are some-what flattened out. The fitting coefficients obtained in this procedure are given in Table 3, together with the mean cal-culated contributions to the mixing ratios of acetone. These values were obtained by multiplying the coefficient for each
variable by the average mixing ratio of each variable. Also given in the table are the equivalent percentage contributions by parameter, to give a clearer impression of the relative im-portance of the different parameters. The gradient of the line of best fit between the measurements and fitted data was 1.0, with intercept 0.0. Table 3 shows that the contributions of direct anthropogenic and biomass-burning emissions of ace-tone were very small (ca. 2 and 4%, respectively). The use of methanol as a tracer for direct biogenic emissions suggests that 20% of the acetone observed in Period 1 of MINOS de-rived from this source. It is worth noting that even if we as-sume that 20% of the methanol observed was actually of an-thropogenic origin, the results presented in Table 3 are little affected. 20% of 20% implies an extra 4% of anthropogenic acetone, making 6% in total – still a very small figure. The 15% contribution from the ozone term represents secondary photochemical production of acetone, and was probably also predominantly biogenic in origin, based on the lack of good correlation between acetone and CO, noted previously. This suggests a total biogenic contribution to the acetone mixing ratios of 35%. By far the highest contribution to the ob-served mixing ratios was the constant term, which may be interpreted as the regional background mixing ratio of ace-tone (1.7 nmol/mol), and demonstrates that Finokalia is a rea-sonably remote measurement station. These results may be compared with those of Goldstein and Schade (2000), who derived the following contributions to acetone mixing ratios in the Sierra Nevada mountains, California, USA: anthro-pogenic 14% (of which 1% primary, 99% secondary), bio-genic 45% (of which 35% primary, 65% secondary), 41% regional background, calculated to be 1.4 nmol/mol. Both studies suggest that biogenic sources of acetone are consid-erably more important than anthropogenic sources, as pro-posed in the global budget estimates of acetone presented by Singh et al. (2000) and Jacob et al. (2002).
5 Summary and conclusions
In this paper we have focussed on the sources of methanol and acetone measured during the MINOS campaign in Crete, July–August 2001, particularly for Period 1 of the campaign, where the acetonitrile measurements indicated that biomass-burning influence – of importance through most of the cam-paign – was relatively low. The air masses in this period may therefore represent typical Eastern European boundary-layer out-flow into the Mediterranean in the summer, with the fol-lowing mean mixing ratios: methanol 3.3 nmol/mol; acetone 2.9 nmol/mol, benzene 130 pmol/mol, CO 167 nmol/mol, ozone 62 nmol/mol. The mean acetone:CO, methanol:CO and acetonitrile:CO ratios in this period were 0.017, 0.020 and 0.0009.
Diel cycles observed during MINOS were mainly as a result of advection to the site and/or vertical mixing, with
evidence of photochemical production only seen in the cases of ozone (possibly in both periods) and acetone in Period 3.
A comparison of the acetone and methanol measurements with the results of the MATCH-MPIC model showed that the model reproduced quite well the larger-scale trends of both compounds. However, both species were underestimated by a factor of four on average over the whole campaign. In addition, the model:measurement ratio for both compounds was rather variable over the campaign as a whole, suggest-ing weaknesses in the distribution of emissions in the model. These observations in turn suggested that the relatively high mixing ratios of methanol measured during MINOS arose largely from direct emissions. Recent reviews of the global methanol budget by Galbally and Kirstine (2002) and Heikes et al. (2002) suggest that the anthropogenic contribution to the global source strength of this species is relatively small. Since the photochemical production route of methanol is rather slow, only high biogenic emissions are realistically able to explain the high methanol mixing ratios observed dur-ing MINOS.
Assuming that methanol was predominantly biogenically emitted, we used methanol as a biogenic tracer in a multi-variate analysis of the acetone measurements in Period 1. The calculated contribution of direct anthropogenic emis-sions of acetone was found to be very small (up to 6%). A total of 35% biogenic contribution to the observed ace-tone mixing ratios was obtained, assuming that the secondary photochemical production of acetone also ultimately derived from biogenic sources, while the remainder was a constant background term, representing a regional background ace-tone level of 1.7 nmol/mol. These results imply that the miss-ing methanol and acetone sources apparent in the MATCH-MPIC model are, at least to a large extent, biogenic emis-sions, and also that biogenic sources of acetone are consid-erably more important than anthropogenic sources, as sug-gested in the global budget estimates of acetone presented by Singh et al. (2000) and Jacob et al. (2002).
Acknowledgement. The authors would like to acknowledge the
BADC trajectory service for the back-trajectories used in this pa-per. Thanks to M. de Reus for her sterling work in organising the MPI side of the MINOS campaign, and to D. Scharffe for getting our container up and running. GS would like to thank L. Lange, X. Xu and A. R¨ompp for their help and encouragement during the experiment, and J. Sciare, F. Slemr and J. Crowley for useful com-ments on this work.
References
Berresheim, H., Plass-D¨ulmer, C., Elste, T., and Mihalopoulos, N.: OH in the coastal boundary layer of Crete during MINOS: mea-surements and relationship with ozone photolysis, Atmos. Chem. & Phys. Discuss., 3, 1183–1212, 2003.
Caplan, P. and Pan, H. L.: Changes to the 1999 NCEP Opera-tional MRF Model Analysis/Forecast System, NaOpera-tional Centers
for Environmental Prediction, Silver Spring, NCEP Pub. No. 452, 2000.
Christian, T. J., Kleiss, B., Yokelson, R.J ., et al.: Comprehensive laboratory measurements of biomass-burning emissions I. The emissions from Indonesian, African, and other fuels, submitted to J. Geophys. Res., 2003.
de Reus, M., Fischer, H., Arnold, F., de Gouw, J., Warneke, C., and Williams, J.: On the relationship between acetone and car-bon monoxide in air masses of different origin, Atmos. Chem. & Phys. Discuss., 3, 1017–1049, 2003.
Galbally, I. E. and Kirstine, W.: The production of methanol by flowering plants and the global cycle of methanol, J. Atmos. Chem., 43, 195–229, 2002.
Goldstein, A. H. and Schade, G. W.: Quantifying biogenic and an-thropogenic contributions to acetone mixing ratios in a rural en-vironment, Atmos. Environ., 34, 4997–5006, 2000.
Gros, V., Williams, J., van Ardenne, J., Salisbury, G., Hofmann, R., Lawrence, M., von Kuhlmann, R., Lelieveld, J., Krol, M., Berresheim, H., Lobert, J. M., and Atlas, E.: Origin of anthro-pogenic hydrocarbons and halocarbons measured in the summer-time European outflow (on Crete in 2001), Atmos. Chem. & Phys. Discuss., 3, 1893–1923, 2003.
Guenther, A., Hewitt, C. N., Erickson, D., Fall, R., et al.: A global model of natural volatile organic-compound emissions, J. Geo-phys. Res., 100, 8873–8892, 1995.
Hansel, A., Jordan, A., Holzinger, R., Prazeller, P., Vogel, W., and Lindinger, W.: Proton transfer mass spectrometry: on-line trace gas analysis at ppb level, Int. J. Mass Spectrom., 150, 609–619, 1995.
Harrison, D., Hunter, M. C., Lewis, A. C., Seakins, P. W., Bon-sang, B., Gros, V., Kanakidou, M., Touaty, M., Kavouras, I., Mi-halopoulos, N., Stephanou, E., Alves, C., Nunes, T., and Pio, C.: Ambient isoprene and monoterpene concentrations in a Greek fir (Abies Borisii-regis) forest: reconciliation with emissions mea-surements and effects on measured OH concentrations, Atmos. Environ., 35, 4699–4711, 2001.
Heikes, B. G., Chang, W., Pilson, M. E. Q., et al.: Atmospheric methanol budget and ocean implication, Global Biogeochem. Cyc., 4, 1133, doi:10.129/2002GB001895, 2002.
Holzinger, R., Warneke, C., Hansel, A., et al.: Biomass burning as a source of formaldehyde, acetaldehyde, methanol, acetone, ace-tonitrile, and hydrogen cyanide, Geophys. Res. Lett., 26, 1161– 1164, 1999.
Holzinger, R., Kleiss, B., Donoso, L., and Sanhueza, E.: Aromatic hydrocarbons at urban, suburban, rural (8◦520N; 67◦190W) and remote sites in Venezuela, Atmos. Environ., 35, 4917–4927, 2001a.
Holzinger, R., Jordan, A., Hansel, A., and Lindinger, W.: Automo-bile emissions of acetonitrile: assessment of its contribution to the global source, J. Atmos. Chem., 38, 187–193, 2001b. Holzinger, R., Kleiss, B., Crutzen, P. J., Lobert, J. M., and Kaene,
W. C.: VOC emissions from savannah fuels, manuscript in prepa-ration, Atmos. Chem. & Phys., to be submitted, 2003.
Jacob, D., Field, B., Yin, E., Bey, I., Li, Q., Logan, J., Yantosca, R., and Singh, H.: Atmospheric budget of acetone, J. Geophys. Res., 107, 10.1029/2001JD000694, 2002.
Kirstine, W., Galbally, I., Ye, Y., and Hooper, M.: Emissions of volatile organic compounds (primarily oxygenated species) from pasture, J. Geophys. Res., 103, 10 605-10 609, 1998.
von Kuhlmann, R.: Photochemistry of tropospheric ozone, its precursors and the hydroxyl radical: a 3D-modeling study considering non-methane hydrocarbons, Ph.D. thesis, Johannes Gutenberg-Universit¨at Mainz, Mainz,Germany, 2001.
von Kuhlmann, R., Lawrence, M. G., Crutzen, P. J., and Rasch, P. J.: A model for studies of tropospheric ozone and nonmethane hydrocarbons: Model description and ozone results, J. Geophys. Res., 108, 4294, doi:10.1029/2002JD002893, 2003a.
von Kuhlmann, R., Lawrence, M. G., Crutzen, P. J., and Rasch, P. J.: A model for studies of tropospheric ozone and nonmethane hydrocarbons: Model evaluation of ozone related species, sub-mitted to J. Geophys. Res., doi:10.1029/2002JD003348, 2003b. Lange, L., Williams, J., Lawrence, M., von Kuhlmann, R.,
Vrek-oussis, M., Economou, C., Mihalopoulos, N., and Lelieveld, J., The budget of reactive nitrogen species at a ground-based station on Crete during the MINOS 2001 campaign, Atmos. Chem. & Phys., submitted.
Lawrence, M. G., Crutzen, P. J., Rasch, P. J., Eaton, B. E., and Mahowald, N. M.: A model for studies of tropospheric photo-chemistry: Description, global distributions, and evaluation, J. Geophys. Res., 104, 26 245–26 277, 1999.
Lelieveld, J., Berresheim, H., Borrmann, S., et al.: Global air pollu-tion crossroads over the Mediterranean, Science, 298, 794–799, 2002.
Lindinger, W., Hansel, A., and Jordan, A.: On-line monitoring of volatile organic compounds at pptv levels by means of Proton-Transfer-Reaction Mass Spectrometry (PTR-MS): medical ap-plications, food control and environmental research, Int. J. Mass Spectrom., 173, 191–241, 1998.
Lobert, J. M., Scharffe, D. H., Hao, W. M., and Crutzen, P. J.: Importance of biomass burning in the atmospheric budget of nitrogen-containing gases, Nature, 346, 552–554, 1990. Mahowald, N. M., Rasch, P. J., Eaton, B. E., Whittlestone, S., and
Prinn, R. G.: Transport of222radon to the remote troposphere using the Model of Atmospheric Transport and Chemistry and assimilated winds from ECMWF and the National Center for En-vironmental Prediction/NCAR, J. Geophys. Res., 102, 28 139– 28 152, 1997a.
Mahowald, N. M., Prinn, R., and Rasch, P. J.: Deducing CCl3F
emissions using an inverse method and chemical transport mod-els with assimilated winds, J. Geophys. Res., 102, 28 153– 28 168, 1997b.
Mauzerall, D. L., Logan, J. A., Jacob, D. J, Anderson, B. E., et al.: Photochemistry in biomass burning plumes and implications for tropospheric ozone over the tropical South Atlantic, J. Geophys. Res., 103, 8401–8423, 1998.
McKenna, D., Hord, C., and Kent, J.: Hydroxyl radical concen-trations and Kuwait oil fire emission rates for March 1991, J. Geophys. Res., 100, 26 005–26 025, 1995.
Mihalopoulos, N., Stephanou, E., Pilitsidis, S., Kanakidou, M., and Bousquet, P.: Atmospheric aerosol composition above the East-ern Mediterranean region, Tellus, 49B, 314–326, 1997. Moschonas, N. and Glavas, S.: Non-methane hydrocarbons at a
high-altitude rural site in the Mediterranean (Greece), Atmos. Environ., 34, 973–984, 2000.
P¨oschl, U., von Kuhlmann, R., Poisson, N., and Crutzen, P. J.: De-velopment and intercomparison of condensed isoprene oxidation mechanisms for global atmospheric modeling, J. Atmos. Chem., 37, 29–52, 2000.
Rasch, P. J., Mahowald, N. M., and Eaton, B. E.: Representations of transport, convection and the hydrologic cycle in chemical trans-port models: implications for the modeling of short lived and soluble species, J. Geophys. Res., 102, 28 127–28 138, 1997. Reiner, T., Sprung, D., Jost, C., Gabriel, R., Mayol-Bracero, O.
L., Andreae, M. O., Campos, T. L., and Shetter, R. E.: Chemi-cal characterization of pollution layers over the tropiChemi-cal Indian Ocean: signatures of emissions from biomass and fossil fuel burning, J. Geophys. Res., 106, 28 497–28 510, 2001.
Roberts, J., Felsenfeld, F., Liu, S., Bollinger, M., Hahn, C., Albrit-ton, D., and Sievers, R.: Measurements of aromatic hydrocarbon ratios and NOxconcentrations in the rural troposphere:
observa-tions of airmass photochemical aging and NOxremoval, Atmos.
Environ., 18, 2421–2432, 1984.
Sanz, M. J. and Mill´an, M. M.: The dynamics of aged air masses and ozone in the Western Mediterranean: relevance to forest ecosystems, Chemosphere, 36, 1089–1094, 1998.
Schade, G. W and Goldstein, A. H.: Fluxes of oxygenated volatile organic compounds from a ponderosa pine plantation, J. Geo-phys. Res., 106, 3111–3123, 2001.
Schneider, J., Borrmann, S., Wollny, A., Blsner, M., Mihalopoulos, N., Bardouki, H., and Sciare, J.: Ground-based particle measure-ments during MINOS (Crete, August 2001): Size distribution and inorganic chemical composition, Atmos. Chem. & Phys., submitted, 2003.
Singh, H. B., Kanakidou, M., Crutzen, P. J., and Jacob, D. J.: High concentrations and photochemical fate of oxygenated hydrocar-bons in the free troposphere, Nature, 78, 50–54, 1995.
Singh, H., Chen, Y., Tabazadeh, A., et al.: Distribution and fate of selected oxygenated organic species in the troposphere and lower stratosphere over the Atlantic, J. Geophys. Res., 103, 3795– 3805, 2000.
Tsigaridis, K. and Kanakidou, M.: Importance of volatile organic compound photochemistry over a forested area in central Greece, Atmos. Environ., 36, 3137–3146, 2002.
Warneke, C., van der Veen, C., Luxembourg, S., de Gouw, J. A., and Kok, A.: Measurements of benzene and toluene in ambi-ent air using proton-transfer-reaction mass spectrometry: cali-bration, humidity dependence, and field intercomparison, Int. J. Mass Spectrom., 207, 167–182, 2001.
Wennberg, P. O., Hanisco, T. F., Jaegl´e, L., et al.: Hydrogen rad-icals, nitrogen radrad-icals, and the production of O3in the upper troposphere, Science, 279, 49–53, 1998.
Williams, J., P¨oschl, U., Crutzen, P. J., Hansl, A., Holzinger, R., Warneke, C., Lindinger, W., and Lelieveld, J.: An atmospheric chemistry interpretation of mass scans obtained from a proton transfer mass spectrometer flown over the tropical rainforest of Surinam, J. Atmos. Chem., 38, 133–166, 2001.
Xu, X., Williams, J., van Stee, L., Beens, J., Adahchour, M., Vreuls, R., and Lelieveld, J.: Comprehensive two-dimensional gas chro-matography (GCxGC) measurements of volatile organic com-pounds in the atmosphere, Atmos. Chem. & Phys. Discuss., 3, 1139–1181, 2003a.
Xu, X., Williams, J., Plass-D¨ulmer, C., Berresheim, H., Salisbury, G., Lange, L., and Lelieveld, J.: GC x GC measurements of C7– C11 aromatic and n-alkane hydrocarbons on Crete, in air from Eastern Europe during the MINOS campaign, Atmos. Chem. & Phys. Discuss., 3, 1477–1513, 2003b.