HAL Id: hal-03226939
https://hal.archives-ouvertes.fr/hal-03226939
Submitted on 16 May 2021
HAL is a multi-disciplinary open access
archive for the deposit and dissemination of
sci-entific research documents, whether they are
pub-lished or not. The documents may come from
teaching and research institutions in France or
abroad, or from public or private research centers.
L’archive ouverte pluridisciplinaire HAL, est
destinée au dépôt et à la diffusion de documents
scientifiques de niveau recherche, publiés ou non,
émanant des établissements d’enseignement et de
recherche français ou étrangers, des laboratoires
publics ou privés.
increasing wildfire pollution over boreal North America
Xu Yue, Susanna Strada, Nadine Unger, Aihui Wang
To cite this version:
Xu Yue, Susanna Strada, Nadine Unger, Aihui Wang. Future inhibition of ecosystem productivity by
increasing wildfire pollution over boreal North America. Atmospheric Chemistry and Physics,
Euro-pean Geosciences Union, 2017, 17 (22), pp.13699-13719. �10.5194/acp-17-13699-2017�. �hal-03226939�
https://doi.org/10.5194/acp-17-13699-2017 © Author(s) 2017. This work is distributed under the Creative Commons Attribution 3.0 License.
Future inhibition of ecosystem productivity by increasing wildfire
pollution over boreal North America
Xu Yue1,2, Susanna Strada3, Nadine Unger4, and Aihui Wang2
1Climate Change Research Center, Institute of Atmospheric Physics, Chinese Academy of Sciences, Beijing 100029, China 2Nansen-Zhu International Research Centre, Institute of Atmospheric Physics, Chinese Academy of Sciences,
Beijing 100029, China
3Laboratoire des Sciences du Climat et de l’Environnement, L’Orme des Merisiers – Bat 712, 91191 Gif-Sur-Yvette, France 4College of Engineering, Mathematics and Physical Sciences, University of Exeter, Exeter, EX4 4QE, UK
Correspondence to:Xu Yue (xuyueseas@gmail.com) Received: 5 April 2017 – Discussion started: 23 June 2017
Revised: 11 October 2017 – Accepted: 12 October 2017 – Published: 17 November 2017
Abstract. Biomass burning is an important source of tropo-spheric ozone (O3) and aerosols. These air pollutants can af-fect vegetation photosynthesis through stomatal uptake (for O3) and light scattering and absorption (for aerosols). Wild-fire area burned is projected to increase significantly in bo-real North America by the mid-century, while little is known about the impacts of enhanced emissions on the terrestrial carbon budget. Here, combining site-level and satellite obser-vations and a carbon–chemistry–climate model, we estimate the impacts of fire emitted O3and aerosols on net primary productivity (NPP) over boreal North America. Fire emis-sions are calculated based on an ensemble projection from 13 climate models. In the present day, wildfire enhances sur-face O3 by 2 ppbv (7 %) and aerosol optical depth (AOD) at 550 nm by 0.03 (26 %) in the summer. By mid-century, area burned is predicted to increase by 66 % in boreal North America, contributing more O3(13 %) and aerosols (37 %). Fire O3causes negligible impacts on NPP because ambient O3concentration (with fire contributions) is below the dam-age threshold of 40 ppbv for 90 % summer days. Fire aerosols reduce surface solar radiation but enhance atmospheric ab-sorption, resulting in enhanced air stability and intensified regional drought. The domain of this drying is confined to the north in the present day but extends southward by 2050 due to increased fire emissions. Consequently, wildfire aerosols enhance NPP by 72 Tg C yr−1in the present day but decrease NPP by 118 Tg C yr−1in the future, mainly because of the soil moisture perturbations. Our results suggest that future wildfire may accelerate boreal carbon loss, not only through
direct emissions increasing from 68 Tg C yr−1at present day to 130 Tg C yr−1 by mid-century but also through the bio-physical impacts of fire aerosols.
1 Introduction
The area burned by wildfire is increasing in recent decades in North American boreal regions (Stocks et al., 2002; Ka-sischke and Turetsky, 2006). Fire activity is closely related to weather conditions and large-scale atmospheric oscilla-tions (Gillett et al., 2004; Duffy et al., 2005) and is pro-jected to increase significantly in the future due to climatic changes (Flannigan et al., 2005; Balshi et al., 2009; de Groot et al., 2013; Wang et al., 2015). More area burned and the consequent fire emissions are accelerating carbon loss in boreal North America (Bond-Lamberty et al., 2007; Turet-sky et al., 2011). Meanwhile, fire-induced air pollution, in-cluding ozone (O3) and aerosols, is predicted to increase in boreal and downwind regions by mid-century (Yue et al., 2013, 2015). Wildfire emissions have large impacts on air quality (Wotawa and Trainer, 2000; Morris et al., 2006), weather and climate conditions (Randerson et al., 2006; Zhao et al., 2014), and public health (Zu et al., 2016; Liu et al., 2017). However, little is known about how these pollu-tants affect ecosystem carbon assimilation and how this im-pact will change with the increased wildfire activity in the future.
Surface O3 causes damages to photosynthesis through stomatal uptake (Sitch et al., 2007). In the present climate state, fire-induced O3enhancements are predicted to reduce net primary productivity (NPP) in the Amazon forest by 230 Tg C yr−1 (1 Tg = 1012g), a magnitude comparable to the direct release of CO2from fires in South America (Paci-fico et al., 2015). The aerosol effects are more uncertain be-cause both positive and negative feedbacks occur. Appear-ance of aerosols increases diffuse light, which is beneficial for shaded leaves in the lower canopy. Consequently, pho-tosynthesis of the whole ecosystem will increase as long as the total light availability is not compromised (Kanniah et al., 2012). Rap et al. (2015) estimated that biomass burning aerosols increase Amazon NPP by 78–156 Tg C yr−1, which offsets about half of the damage caused by fire O3 (Paci-fico et al., 2015). In contrast, strong light attenuation asso-ciated with high aerosol loading may decrease canopy pho-tosynthesis (Cohan et al., 2002; Oliveira et al., 2007; Cirino et al., 2014). Furthermore, the aerosol radiative effects indi-rectly influence ecosystem productivity through concomitant meteorological perturbations that are only beginning to be examined (Yue et al., 2017).
Future wildfire activity is projected to increase over bo-real North America but with large uncertainties (Flannigan et al., 2005; Tymstra et al., 2007; Girardin and Mudelsee, 2008; Nitschke and Innes, 2008; Amiro et al., 2009; Bal-shi et al., 2009; Bergeron et al., 2010; Wotton et al., 2010; de Groot et al., 2013; Wang et al., 2016). For example, Amiro et al. (2009) predicted an increase of 34 % in the area burned in Canada for a 2 × CO2 scenario (2040–2060) relative to a 1 × CO2condition (1975–1995), using the Canadian Fire Weather Index (CFWI) and output from the Canadian Global Climate Model (CGCM) version 1. Balshi et al. (2009) pro-jected that area burned in boreal North America would dou-ble by the year 2045–2050 relative to 1991–2000, using the Multivariate Adaptive Regression Splines (MARS) approach and meteorological output from CGCM version 2. The in-creasing rate in Balshi et al. (2009) is higher than that in Amiro et al. (2009), indicating substantial uncertainties in fire projections originating from both fire models and simu-lated future climate. However, even with the same fire mod-els and climate change scenario, large uncertainties (in both magnitude and signs) are found in the projection of area burned among individual climate models (Moritz et al., 2012; Yue et al., 2013). The multi-model ensemble approach has shown superior predictability over single models in histori-cal climate simulations (Flato et al., 2013) and near-term cli-mate predictions (Kirtman et al., 2014) and has been used as a standard technique to assess changes of climate variables in the long-term projections (Collins et al., 2013). Follow-ing this strategy, Yue et al. (2015) used output from 13 cli-mate models to drive fire regression models and predicted an average increase of 66 % in boreal area burned at 2046– 2065 relative to 1981–2000 under the IPCC A1B scenario (Solomon et al., 2007). Yue et al. (2015) further calculated
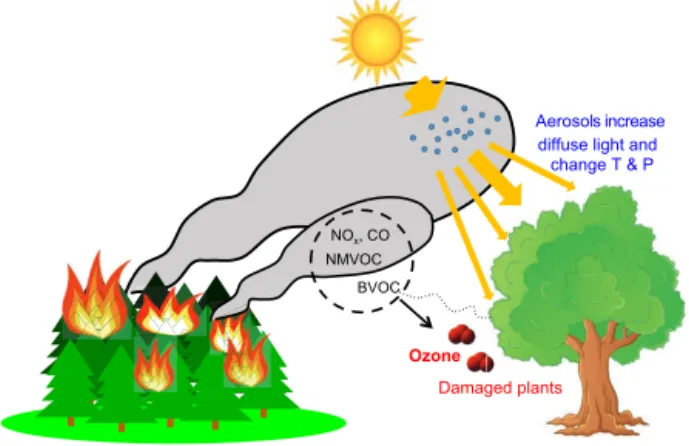
. Illustration of atmospheric chemistry and physics, and biospheric processes fire plumes increase diffuse light and temperature and precipitation, influencing vegetation photosynthesis. Ozone
-emitted precursors (NOx, CO, and non-methane volatile (NMVOC)) and associated BVOC changes causes direct damage to plant ynthesis.
Aerosols increase diffuse light and change T & P NMVOC Damaged plants NOx, CO BVOC Ozone
Figure 1. Illustration of atmospheric chemistry and physics as well as biospheric processes investigated in the study. Carbona-ceous aerosols from fire plumes increase diffuse light and change temperature (T) and precipitation (P), influencing vegetation pho-tosynthesis. Ozone generated photochemically from fire-emitted precursors (NOx, CO, and non-methane volatile organic
pounds, NMVOC) and associated biogenic volatile organic com-pound (BVOC) changes causes direct damage to plant photosyn-thesis.
that the wildfire emission increase by the 2050s would in-crease mean summertime surface O3by 5 ppbv in Alaska and 3 ppbv in Canada. The study found regional maximum O3 enhancements as high as 15 ppbv, suggesting the potential for possible vegetation damage and land carbon loss due to the enhanced boreal fire-related air pollution. Wildfire aerosols are also expected to increase significantly but not predicted in Yue et al. (2015).
In this study, we quantify the impacts of O3and aerosols emitted from boreal wildfires on the land carbon uptake in North America in the present climate state and in the future world at 2050, taking advantage of the ensemble projection of future wildfire emissions by Yue et al. (2015). The major chain we investigate includes (i) generation of aerosols and surface ozone from wildfire emissions and (ii) impact of fire-emitted aerosols and ozone on plant photosynthesis through physical and biogeochemical processes (Fig. 1). We first an-alyze relationships between gross primary production (GPP) and aerosol optical depth (AOD) at 550 nm over the boreal regions based on observations. We then perform a suite of Earth system model simulations using NASA GISS Mod-elE2 that embeds the Yale Interactive Terrestrial Biosphere model (YIBs), a framework known as ModelE2-YIBs (Yue and Unger, 2015). Future projections of wildfire emissions from Yue et al. (2015) are applied as input to ModelE2-YIBs model to project fire-induced O3and aerosol concentrations in the 2010s and 2050s. The impacts of the boreal fire O3 on forest photosynthesis are predicted using the flux-based damage algorithm proposed by Sitch et al. (2007), which has been fully evaluated against available O3 damage sensitiv-ity measurements globally and over North America (Yue and
Unger, 2014; Yue et al., 2016, 2017). Fire aerosols induce perturbations to radiation, meteorology, and hydrology, lead-ing to multiple influences on the land carbon uptake. Sen-sitivity experiments are performed using the YIBs model in offline mode to isolate the contributions of changes in the individual meteorological drivers.
2 Materials and methods
2.1 Observed GPP–AOD relationships
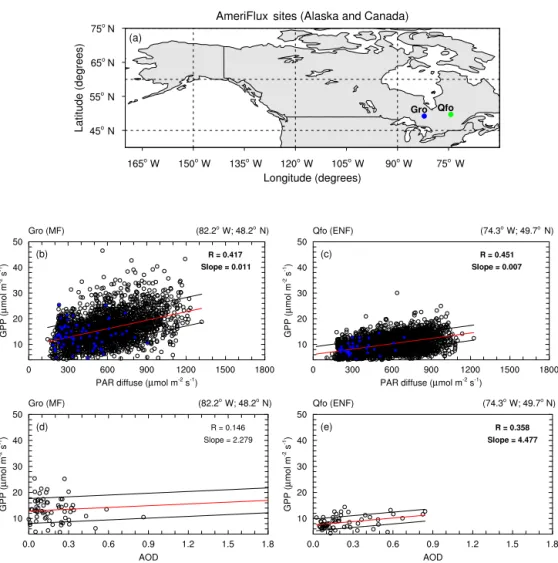
Following the approach by Strada et al. (2015), we investi-gate the GPP sensitivity to diffuse radiation and AOD vari-ability in boreal regions. First, we identify study sites in Canada and Alaska from the AmeriFlux (AMF) network (http://ameriflux.lbl.gov/). There are much fewer boreal sites than those in temperate regions. We select AMF sites pro-viding hourly (or half-hourly) simultaneous measurements of GPP (non-gap-filled) and photosynthetically active ra-diation (PAR, total and diffuse) for at least 3 consecutive years. Only two Canadian sites meet the criteria: Ground-hog River (CA-Gro; 82.2◦W, 48.2◦N), a mixed forest (MF), and Québec Mature Boreal Forest Site (CA-Qfo; 73.4◦W, 49.7◦N), an evergreen needleleaf forest (ENF). At the two selected sites, we calculate the Pearson’s correlation coef-ficients between half-hourly GPP and different components of PAR. In total, we select 2432 and 3201 pairs of GPP and PAR measurements at CA-Gro and CA-Qfo, respec-tively. We then apply instantaneous Level 2 Collection 6 of AOD pixels at 3 km resolution retrieved by the Moder-ate Resolution Imaging Spectroradiometer (MODIS, https: //ladsweb.nascom.nasa.gov/) onboard the Aqua and Terra satellites (Levy et al., 2013). The MODIS 3 km AOD product has been fully validated against ground-based sun photome-ters on both global (Remer et al., 2013) and urban/suburban (Munchak et al., 2013) scales. Strada et al. (2015) used ground-based AOD observations from the Aerosol Robotic Network (AERONET) near AMF sites to validate the sam-pling technique of MODIS 3 km AOD product. They found high correlations of 0.89–0.98 and regression slopes from 0.89 to 1.03 for daily AOD between AERONET and MODIS at four AMF sites. For this study, the validation against ground-based AOD observations was not possible because no AERONET stations exist near to the selected AMF sites.
Every day, MODIS satellite sensors pass a specific region between 10:00 and 14:00 local time (LT), leaving patchy signals around the AMF sites. Most of MODIS AOD data at high latitudes are available only in boreal summer; as a result, we narrow our explorations of the GPP–AOD rela-tionships to the noontime (10:00–14:00 LT) from June to August. The chosen noontime window limits the contribu-tions that confounding factors such as low solar angles and high diffuse fraction may have on the amount of diffuse PAR and plant productivity (Niyogi et al., 2004). For each
sum-mer day, we select instantaneous MODIS 3 km AOD pixels that are (a) located within a distance of 0.03◦ (about 3 km) from the targeted AMF site and (b) “quasi-coincident” with AMF data, which are available each half-hour. Because of the unavoidable temporal differences between MODIS over-pass and AMF data availability, we name this selection quasi-coincident. A cloud mask applied to the MODIS retrieval procedure conveniently filters out cloudy instants and should reduce the effect of clouds in the scattering process. We cal-culate both the correlation and regression coefficients be-tween quasi-coincident GPP and AOD at the selected sites. Negative GPP is considered as a missing value. To further re-duce the influence of cloud cover, we discard instants (both AMF and MODIS data) when precipitation is nonzero. In total, we select 65 pairs of GPP and AOD at CA-Gro site and another 59 pairs at CA-Qfo site. The GPP–AOD sam-pling pairs are much fewer than GPP–PAR, because we se-lect instants when both instantaneous AOD and GPP data are available. In addition, AOD is screened for clear instants to exclude the impacts of clouds.
2.2 Wildfire emissions
Wildfire emissions used in climate modeling are calculated as the product of area burned, fuel consumption, and emis-sion factors. To predict area burned, we build stepwise re-gressions for area burned in 12 boreal ecoregions (Yue et al., 2015). Observed area burned aggregated from intera-gency fire reports is used as the predictand. Predictors are selected from 44 (5 × 6 + 7 × 2) variables including five me-teorological parameters (mean and maximum temperature, relative humidity, precipitation, and geopotential height at 500 hPa) of six different time intervals (winter, spring, sum-mer, autumn, fire season (May–October), and the whole year), as well as the mean and maximum values of 7 fire in-dexes from the CFWI system during fire season. We consider the impacts of antecedent factors on current fire activity by including all above variables at the same year and those in the previous 2 years, making a total of 132 (44 × 3) factors. The final formats of regression are different among ecore-gions, depending on the selection of the factors that con-tribute the maximum observed variance in predictands but main the minimum collinearity among predictors. These re-gression functions are then driven with output from 13 Cou-pled Model Intercomparison Project Phase 3 (CMIP3) cli-mate models under the A1B scenario (Meehl et al., 2007) to predict area burned at present day (1981–2000) and mid-century (2046–2065). In the A1B scenario, CO2 concentra-tion is projected to 532 ppm by the year 2050, similar to the value of 541 ppm in the IPCC RCP8.5 scenario (van Vuuren et al., 2011) archived for the Coupled Model Intercomparison Project Phase 5 (CMIP5).
We derive a 1◦×1◦gridded burned area based on the pre-diction for each ecoregion following the approach by Yue et al. (2015). Temporally, the annual area burned estimated with
regressions is first converted to monthly area burned using the mean seasonality for each boreal ecoregion during 1980– 2009. Spatially, large fires tend to burn in ecosystems where historical fires are frequent because of favorable conditions (Keane et al., 2008). In each 1◦×1◦grid square, we calcu-late the frequency of large fires (> 1000 ha) during 1980– 2009; these fires account for about 85 % of total area burned in boreal North America. We arbitrarily attribute 85 % of area burned within each ecoregion to a number of fires with fixed size of 1000 ha. We then allocate these large fires among the 1◦×1◦grid cells based on the observed spatial probability of large fires. For example, if one grid box (named grid A) bears 1 % of large fires (> 1000 ha) within an ecoregion at present day, the same grid will bear the same possibility for large fires in the future. However, fuel availability limits re-burning and fire spread during the forest return interval, sug-gesting that current burning will decrease the possibility of future fires in the same location. To consider such impact, we scale the observed probabilities by the fraction remain-ing unburned in each grid box and then use this modified probability distribution to allocate large fires for the remain-ing months. For example, if present-day fires have consumed 20 % of the total area within grid A, then the possibility of large fire will be 0.8 % (1 % × 0.8, instead of 1 %) for this grid. Finally, we disaggregate the remaining 15 % of area burned into fires 10 ha in size and randomly distribute these fires across all grid boxes in the ecoregion. With this method, we derive the gridded area burned for boreal North Amer-ica by eliminating reburning issues. Sensitivity tests show that specifying different area burned to the large fires (100 or 10 000 ha rather than 1000 ha) yields < 1 % changes in pre-dicted biomass burned, suggesting that this approach is not sensitive to the presumed fire size in the allocation proce-dure.
Fuel consumption, the dry mass burned (DM) per fire area, is the product of fuel load and burning severity. For fuel load in Alaska, we use 1 km inventory from the US For-est Service (USFS) Fuel Characteristic Classification System (FCCS; McKenzie et al., 2007). For fuel load in Canada, we use a 1 km fuel type map from the Canadian Fire Behavior Prediction (FBP) system (Nadeau et al., 2005), combined with fuel-bed definition from the FCCS. Burning severity, the fraction of fuel load burned by fires, is calculated with the USFS CONSUME model 3.0 following the approach described in Val Martin et al. (2012). With both fuel load and burning severity, we derive fuel consumption and fur-ther calculate biomass burned in boreal North America with the predicted area burned. As in Amiro et al. (2009) and Yue et al. (2015), we apply constant fuel load for both present day and mid-century because opposite and uncertain fac-tors influence future projections (Kurz et al., 2008; Heyder et al., 2011; Friend et al., 2014; Knorr et al., 2016; Kim et al., 2017). Instead, we consider changes in burning severity due to perturbations in fuel moisture as indicated by CFWI (Yue et al., 2015). On average, we estimate a 9 % increase
in fuel consumption over boreal North America by the mid-century, because higher temperature and lower precipitation result in a future with drier fuel load (Flannigan et al., 2016). Fire emissions for a specific species are then estimated as the product between biomass burned and the corresponding emission factor, which is adopted from measurements by An-dreae and Merlet (2001) except for NOx. We use the average value of 1.6 g NO per kg DM from six studies as NOx emis-sion factor, because the number of 3.0 g NO per kg DM re-ported in Andreae and Merlet (2001) is much higher than that of 1.1 g NO per kg DM from field observations (Alvarado et al., 2010). Based on projected area burned and observation-based fuel consumption and emission factors, we derive fire emissions of NOx, carbon monoxide (CO), non-methane volatile organic compounds (NMVOCs, alkenes, and alka-nes), NH3, SO2, black carbon (BC), and organic carbon (OC) in the present day and mid-century.
2.3 NASA ModelE2-YIBs model
The NASA ModelE2-YIBs is an interactive climate–carbon– chemistry model, which couples the chemistry–climate model NASA ModelE2 (Schmidt et al., 2014) and the YIBs vegetation model (Yue and Unger, 2015). NASA ModelE2 is a general circulation model with horizontal resolution of 2◦×2.5◦ latitude by longitude and 40 vertical layers up to 0.1 hPa. It dynamically simulates both the physical (emissions, transport, and deposition) and chemical (pro-duction, conversion, and loss) processes of gas-phase chem-istry (NOx, HOx, Ox, CO, CH4, and NMVOCs), aerosols (sulfate, nitrate, ammonium, BC, OC, dust, and sea salt), and their interactions. In the model, oxidants influence the photochemical formation of secondary aerosol species (e.g., sulfate, nitrate, and biogenic secondary organic aerosol), in turn, aerosols alter photolysis rates and influence the on-line gas-phase chemistry. Size-dependent optical parameters computed from Mie scattering, including extinction coeffi-cient, single scattering albedo, and asymmetry parameters, are applied for each aerosol type (Schmidt et al., 2014). The model also considers interactions between climate and atmospheric components. Simulated climate affects forma-tion, transport, and deposition of atmospheric components, in turn, both O3and aerosols influence climate by altering radiation, temperature, precipitation, and other climatic vari-ables. Both observation-based evaluations and multi-model intercomparisons indicate that ModelE2 demonstrates skill in simulating climatology (Schmidt et al., 2014), soil mois-ture (Fig. S1 in the Supplement), radiation (Wild et al., 2013), atmospheric composition (Shindell et al., 2013b), and radia-tive effects (Shindell et al., 2013a).
YIBs is a process-based vegetation model that dynami-cally simulates changes in leaf area index (LAI) through car-bon assimilation, respiration, and allocation for prescribed plant functional types (PFTs). Coupled photosynthesis– stomatal conductance is simulated with the Farquhar–Ball–
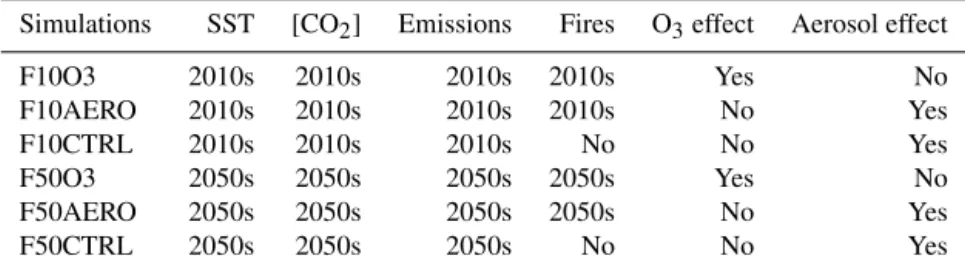
Table 1. Online simulations with ModelE2-YIBs climate model.∗
Simulations SST [CO2] Emissions Fires O3effect Aerosol effect
F10O3 2010s 2010s 2010s 2010s Yes No F10AERO 2010s 2010s 2010s 2010s No Yes F10CTRL 2010s 2010s 2010s No No Yes F50O3 2050s 2050s 2050s 2050s Yes No F50AERO 2050s 2050s 2050s 2050s No Yes F50CTRL 2050s 2050s 2050s No No Yes ∗Values of SST, [CO
2], and emissions are adopted from RCP8.5 scenario, with the average of 2006–2015 for
the 2010s and that of 2046–2055 for the 2050s. For fire emissions, 2010 values are predicted based on meteorology for 1981–2000 and 2050 values are for 2046–2065.
Berry scheme (Farquhar et al., 1980; Ball et al., 1987). Leaf-level photosynthesis is upscaled to canopy Leaf-level by sepa-rating diffuse and direct light for sunlit and shaded leaves (Spitters, 1986). Plant respiration considers thermal depen-dence as well as acclimation to temperature (Atkin and Tjoelker, 2003). Soil respiration is calculated based on the carbon flows among 12 biogeochemical pools (Schaefer et al., 2008). Net carbon uptake is allocated among leaves, stems, and roots to support leaf development and plant growth (Cox, 2001). The YIBs model has been benchmarked against in situ GPP from 145 eddy covariance flux tower sites and satellite retrievals of LAI and phenology (Yue and Unger, 2015). An interactive flux-based O3damage scheme proposed by Sitch et al. (2007) is applied to quantify the pho-tosynthetic responses to ambient O3(Yue and Unger, 2014). For this scheme, O3damaging level is dependent on excess O3stomatal flux within leaves, which is a function of ambi-ent O3concentration, boundary layer resistance, and stom-atal resistance. Reduction of photosynthesis is calculated on the basis of PFTs, each of which bears a range of low-to-high sensitivities to O3uptake.
2.4 Simulations
Using the NASA ModelE2-YIBs model, we perform six time-slice simulations, three for present-day (2010s) and three for mid-century (2050s), with atmosphere-only config-uration to explore the impacts of fire emissions on NPP in boreal North America (Table 1). Simulations F10CTRL and F50CTRL turn off all fire emissions as well as O3 vegeta-tion damage for the 2010s and 2050s, respectively. However, climatic feedbacks of aerosols from other sources (both natu-ral and anthropogenic) and related photosynthetic responses are included. Simulations F10AERO and F50AERO consider the responses of plant productivity to perturbations in radi-ation and meteorology caused by aerosols, including emis-sions from wildfires and other sources, but do not include any O3 vegetation damage. In contrast, simulations F10O3 and F50O3 calculate offline O3damage based on the simu-lated O3from all sources including fire emissions. For these simulations, reductions of GPP are calculated twice with
ei-ther low or high O3sensitivity. However, both of these GPP changes are not fed back into the model to influence carbon allocation and tree growth. Plant respiration is changing in response to meteorological perturbations due either to cli-mate change or to aerosol radiative effects. We assume no im-pact of O3damage to plant respiration and examine vegeta-tion NPP, the net carbon uptake by biosphere, for the current study. The difference between AERO and CTRL runs iso-lates the impacts of fire aerosols on NPP, and the difference between O3 and CTRL runs isolates O3vegetation damage caused by fire and non-fire emission sources.
All simulations are conducted for 20 years and outputs for the last 15 years are used for analyses. The simulations ap-ply sea surface temperatures (SSTs) and sea ice distributions from previous NASA GISS experiments under the IPCC RCP8.5 scenario (van Vuuren et al., 2011). Decadal average monthly-varying SST and sea ice of 2006–2015 are used as boundary conditions for present-day (2010s) runs while that of 2046–2055 are used for future (2050s) runs. In the RCP8.5 scenario, global average SST increases by 0.62◦C while sea ice area decreases by 13.8 % at the mid-century com-pared to the present-day level. Decadal average well-mixed greenhouse gas concentrations and anthropogenic emissions of short-lived species, both at present day and mid-century, are adopted from the RCP8.5 scenario (Table 2). The en-hancement of CO2 will affect climate (through longwave absorption) and ecosystem productivity (through CO2 fer-tilization) but not the fire activity and related emissions di-rectly. Natural emissions of soil and lightning NOx, biogenic volatile organic compounds (BVOCs), dust, and sea salt are climate sensitive and simulated interactively. The YIBs vege-tation model cannot simulates changes in PFT fractions. The RCP8.5 land cover change dataset shows limited changes in land cover fractions between the 2010s and 2050s (Oleson et al., 2010). For example, relative to the 2010s, a maximum gain of 5 % is predicted for grassland in the 2050s, resulting from a 1 % loss in deciduous forest and another 1 % loss in needleleaf forest over boreal North America. As a result, a land cover dataset derived from satellite retrievals (Hansen et al., 2003) is applied as boundary conditions for both the 2010s and 2050s.
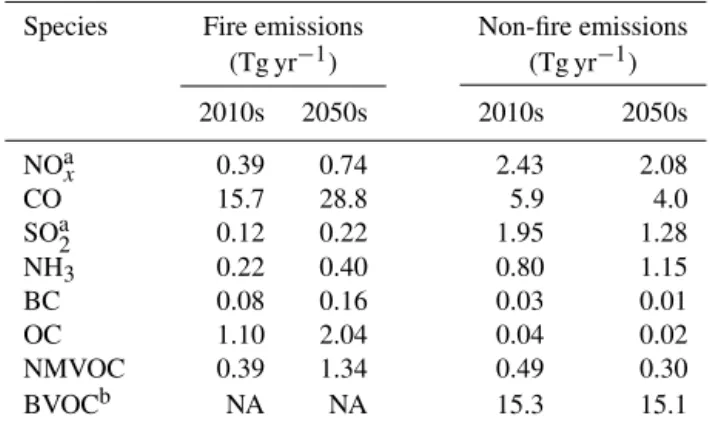
Table 2. Emissions from wildfires and non-fire sources over boreal North America.
Species Fire emissions Non-fire emissions
(Tg yr−1) (Tg yr−1) 2010s 2050s 2010s 2050s NOax 0.39 0.74 2.43 2.08 CO 15.7 28.8 5.9 4.0 SOa2 0.12 0.22 1.95 1.28 NH3 0.22 0.40 0.80 1.15 BC 0.08 0.16 0.03 0.01 OC 1.10 2.04 0.04 0.02 NMVOC 0.39 1.34 0.49 0.30 BVOCb NA NA 15.3 15.1
aNatural emissions are included for NO
x(lightning and soil) and SO2(volcano). bModelE2-YIBs calculates BVOC emissions using photosynthesis-dependent
scheme implemented by Unger et al. (2013).
To evaluate the simulated GPP responses to changes in diffuse radiation, we perform site-level simulations using the stand-alone YIBs model, which is driven with observed hourly meteorology (including temperature, relative humid-ity, surface pressure, wind speed, and soil moisture) and both diffuse and direct PAR at sites CA-Gro and CA-Qfo. To iso-late the impact of individual aerosol-induced climatic per-turbations on NPP, we perform 10 sensitivity experiments using the offline YIBs model driven with offline meteorol-ogy simulated by ModelE2-YIBs model (Table 3). For ex-ample, the offline run Y10_CTRL is driven with variables from the online simulation of F10CTRL (Table 1). The run Y10_TAS adopts the same forcing as Y10_CTRL except for temperature, which is simulated by the climate simulation of F10AERO. In this case, we quantify the NPP responses to in-dividual and/or combined climate feedback (mainly in tem-perature, radiation, and soil moisture) by fire aerosols. Each offline run is conducted for 12 years and the last 10 years are used for analyses.
2.5 Observation datasets
We use observations to evaluated GPP, AOD, and O3in bo-real North America simulated by ModelE2-YIBs. For GPP, we use a benchmark data product upscaled from FLUXNET eddy covariance data using an ensemble of regression trees (Jung et al., 2009). For AOD observations, we use satellite retrieval at 550 nm from Terra MODIS Level 3 data product. For O3, gridded datasets are not available. We use site-level observations from 81 US sites at the Clean Air Status and Trends Network (CASTNET, https://www.epa.gov/castnet) and 202 Canadian sites at the National Air Pollution Surveil-lance (NAPS, http://www.ec.gc.ca/rnspa-naps/) program. All datasets are averaged over the 2008–2012 period to repre-sent prerepre-sent-day climatological conditions. Gridded datasets
are interpolated to the same 2◦×2.5◦resolution as ModelE2-YIBs model.
3 Results
3.1 Observed GPP–AOD relationships
Positive correlations between GPP and diffuse PAR are found at the two boreal sites (Fig. 2b, c). The magnitude of diffuse PAR is similar for these sites, possibly because they are located at similar latitudes (Fig. 2a). GPP values at CA-Gro are generally higher than that at CA-Qfo, likely because deciduous broadleaf forest (DBF) has higher photosynthetic rates. Consequently, the slope of regression between GPP and PARdifis higher at CA-Gro than that at CA-Qfo, suggest-ing that GPP of DBF (or MF) is more sensitive to changes in diffuse PAR than that of ENF. We find almost zero correla-tion between GPP and PARdirat the two sites (Table 4), in-dicating that photosynthesis is in general light-saturated for sunlit leaves at these sites during boreal summer noontime. As a result, modest reductions in direct light by aerosols will not decrease GPP of the whole canopy.
With satellite-based AOD, we find positive correlations between GPP and AOD at both sites (Fig. 2d, e). How-ever, the slope of regression between GPP and AOD is lower (and not significant) at CA-Gro compared with that at CA-Qfo, opposite to the GPP–PARdif regressions. The cause of such discrepancy might be related to the limita-tion of data availability. For the same reason, the GPP– AOD correlation is insignificant at CA-Gro site. On average, GPP sensitivity (denoted as mean ± range) is estimated as 3.5 ± 1.1 µmol m−2s−1 per unit AOD at lower latitudes of boreal regions in the summer.
3.2 Model evaluations
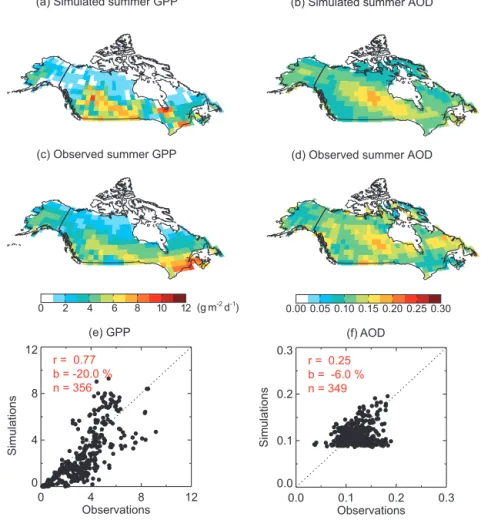
Simulated summer GPP shows high values in mid-western Canada (Alberta and Saskatchewan) and the southeast (On-tario) (Fig. 3a). Forest GPP at high latitudes is low because of the cool weather and light limitation there. Simulated GPP reasonably captures the spatial distribution with a high corre-lation coefficient of 0.77 (p 0.01) and relatively small bi-ases within 20 % of the data product. Simulated AOD repro-duces the observed spatial pattern including the high values in boreal forests (Fig. 3b). In contrast to the MODIS observa-tions, predicted AOD is relatively uniform over the west with a background value of ∼ 0.1. This discrepancy explains the low correlation coefficient (R = 0.25, p < 0.01) between the model and MODIS data. The simulation fails to capture the high values in the west, possibly due to a climate model un-derestimation of biogenic secondary organic aerosol, which may be an important contribution over the western boreal forest. Simulated maximum daily 8 h average (MDA8) [O3] shows low values in boreal North America and high values in the western and eastern US (Fig. 4a). This pattern is
consis-Table 3. Simulations with YIBs vegetation model driven by offline meteorology from ModelE2-YIBs climate model.
Simulations Base forcing Temperature PAR Soil moisture
Y10_CTRL F10CTRL
Y10_ALL F10CTRL F10AERO F10AERO F10AERO
Y10_TAS F10CTRL F10AERO
Y10_PAR F10CTRL F10AERO
Y10_SLM F10CTRL F10AERO
Y50_CTRL F50CTRL
Y50_ALL F50CTRL F50AERO F50AERO F50AERO
Y50_TAS F50CTRL F50AERO
Y50_PAR F50CTRL F50AERO
Y50_SLM F50CTRL F50AERO
Figure 2. Relationships between (b, c) GPP and diffuse PAR and (d, e) GPP and MODIS AOD at (a) two boreal sites: Groundhog River (Gro) and Québec Mature Boreal Forest Site (Qfo). The two sites are from the AmeriFlux network in Canada and are dominated by mixed forest (MF at Gro) and evergreen needleleaf forest (ENF at Qfo) (Table 1). Data cover summer days (June–August). AmeriFlux diffuse PAR and GPP (in µmol m−2s−1) are half-hourly observations (10:00–14:00 LT). Instantaneous MODIS Aqua and Terra 3 km AOD are selected in a time span centered on AmeriFlux record time. For each plot: the red line indicates the regression line and black lines depict the 1 σ interval; the regression slope and correlation coefficient are both included for each site (in bold if statistically significant at 95 % confidence level). Blue dots in panels (b, c) show instants when MODIS Aqua and Terra 3 km AODs overlap AmeriFlux data.
Table 4. Pearson’s correlation coefficients for GPP–PAR and GPP–AOD relationships at AmeriFlux (AMF) sitesa.
Site Periodb Pearson’s R
GPP–PAR GPP–PARdir GPP–PARdif GPP–AOD AOD-PARdif AOD-PARdir
CA-Gro 2004–2013 0.19 (2432) −0.01 (2432) 0.42 (2432) 0.15 (65) 0.60 (65) −0.52 (65)
CA-Qfo 2003–2014 0.16 (3201) −0.04 (3201) 0.45 (3201) 0.36 (59) 0.91 (34) −0.80 (34)
aBoth GPP and PAR (direct PAR
dirand diffuse PARdif) data are adopted from site-level AMF measurements. AOD data are adopted from instantaneous
MODIS Aqua and Terra 3 km retrievals. Correlations are calculated for quasi-coincident AMF and MODIS data over summer noontime (June–August, 10:00–14:00 LT). The sampling number for each correlation is denoted in brackets. Significant (p < 0.05) correlation coefficients are bolded.
bFor CA-Gro site, diffuse PAR observations of 2005–2009 have been discarded because of poor calibration, as documented on the AMF website.
(a) Simulated summer GPP
(c) Observed summer GPP 0 2 4 6 8 10 12 (g m-2 d-1) 0 4 8 12 Observations 0 4 8 12 Simulations r = 0.77 b = -20.0 % n = 356 (e) GPP
(b) Simulated summer AOD
(d) Observed summer AOD
0.00 0.05 0.10 0.15 0.20 0.25 0.30 0.0 0.1 0.2 0.3 Observations 0.0 0.1 0.2 0.3 Simulations r = 0.25 b = -6.0 % n = 349 (f) AOD
Figure 3. Evaluation of simulated summer (a) GPP and (b) AOD at 550 nm with (c, d) observations. Simulation results are from F10AERO (Table 1). Each point on the (e, f) scatter plot represents one grid square in boreal North America. The number of points (n), correlation coefficient (r), and relative bias (b) for the evaluation are presented on the plot.
tent with surface observations (Fig. 4b), but the model over-estimates the measured surface O3 by 22 %. The Canadian measurement sites are located near the southern boundary and as a result do not represent the average state over the vast boreal region at higher latitudes.
With the Sitch et al. (2007) scheme, the YIBs model sim-ulates reasonable GPP responses to [O3] in North America (Yue and Unger, 2014; Yue et al., 2016). Generally, damage to GPP increases with the enhancement of ambient [O3], but
with varied sensitivities for different plant species (see Fig. 6 of Yue and Unger, 2014). In response to the same level of [O3], predicted O3damages are higher for deciduous trees than those for needleleaf trees, consistent with observations from meta-analyses (Wittig et al., 2007). The model also re-produces observed light responses of GPP to diffuse radi-ation in boreal regions. With the site-level simulradi-ations, we evaluate the modeled GPP–PARdifrelationships at the hourly (instead of half-hourly) time step during summer. For 1342
4.
(a) Simulated summer MDA8 O
3 30oN 45oN 60oN 75oN 180o 150o W 120oW 90oW 60oW
(b) Observed summer MDA8 O
3 30oN 45oN 60oN 75oN 180o 150oW 120oW 90oW 60oW 10 20 30 40 50 60 70 (ppbv) 10 35 60 85 Observations 10 35 60 85 Simulations r = 0.72 b = 21.9% n = 283
Figure 4. Evaluation of simulated summer surface maximum daily 8 h average [O3] with observations for 2008–2012. Observations
are collected from 81 US sites at the Clean Air Status and Trends Network (CASTNET) and 202 Canadian sites at the National Air Pollution Surveillance (NAPS) program. The number of points (n), correlation coefficient (r), and mean bias (b) for the evaluation are presented on the plot. Values over Canada and Alaska are denoted with blue points.
pairs of GPP and PARdif at the site CA-Gro, the observed correlation coefficient is 0.42 and regression slope is 0.011, while the results for the simulation are 0.60 and 0.014, re-spectively. At the site CA-Qfo, the observations yield a cor-relation coefficient of 0.46 and regression slope of 0.007 for 1777 pairs of GPP and PARdif. The simulated correlation is 0.61 and the regression is 0.011 at the same site. The GPP sensitivity to PARdifin the model is slightly higher than that of the available observations, likely because the latter are af-fected by additional non-meteorological abiotic factors. To
remove the influences of compound factors other than radi-ation, we follow the approach of Mercado et al. (2009) to discriminate GPP responses to “diffuse” and “direct” compo-nents of PAR at the two sites (Fig. 5). The model successfully reproduces the observed GPP-to-PAR sensitivities. Increase in PAR boosts GPP, but the efficiency is much higher for dif-fuse light than that for direct light, suggesting that increase of diffuse radiation is a benefit for plant growth.
3.3 Simulation of wildfire O3and aerosols
During 1980–2009, wildfire is observed to burn 2.76×10⁶ha and 156.3 Tg DM every year over boreal North America. Similarly, the ensemble prediction with fire regression mod-els estimates present-day area burned of 2.88 × 10⁶ha yr−1 and biomass burned of 160.2 Tg DM yr−1(Yue et al., 2015). By the mid-century, area burned is projected to increase by 77 % (to 5.10 × 10⁶ha yr−1) in boreal North America, mainly because of the higher temperature in future fire sea-sons. Consequently, biomass burned increases by 93 % (to 308.6 Tg DM yr−1) because fuel consumption also increases by 9 % on average in a drier climate (Yue et al., 2015). En-hanced fire emissions increase concentrations of surface O3 and column AOD, especially over Alaska and central Canada (Fig. 6). The maximum centers of air pollutants are collo-cated for O3and AOD but with disproportional magnitudes, suggesting nonlinear conversion among fire emission species as well as the interactions with natural emission sources (e.g., lightning/soil NOx and BVOC). On average, wildfire emissions contribute 7.1 ± 3.1 % (2.1 ± 0.9 ppbv) to surface O3 and 25.7 ± 2.4 % (0.03 ± 0.003) to AOD in the sum-mer over boreal North Asum-merica in the present day. By mid-century, these ratios increase significantly to 12.8 ± 2.8 % (4.2 ± 0.9 ppbv) for O3and 36.7 ± 2.0 % (0.05 ± 0.003) for AOD.
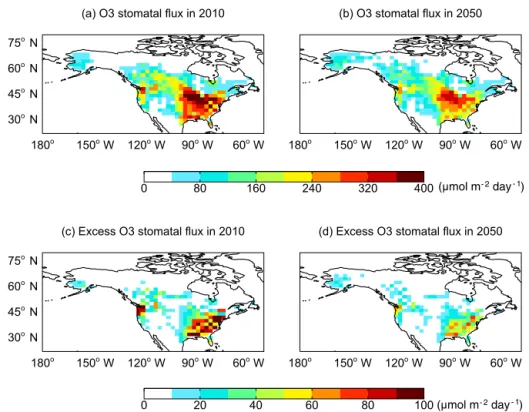
3.4 Simulation of fire pollution impacts on NPP Surface O3, including both fire and non-fire emissions (Ta-ble 2), causes limited (1–2 %) damages to summer GPP in boreal North America (Fig. 7). The most significant dam-age is predicted over eastern US, where observed [O3] is high over vast forest ecosystems (Fig. 4). In the western US, [O3] is also high but the O3-induced GPP reduction is trivial because low stomatal conductance in the semiarid ecosys-tems limits O3 uptake there (Yue and Unger, 2014). Over boreal North America, dominant PFTs are ENF (account-ing for 44 % of total vegetation cover) and tundra (treated as shrubland, accounting for 41 % of total vegetation cover). Both species have shown relatively high O3 tolerance with a damaging threshold of 40 ppbv as calculated with Sitch’s scheme (Yue and Unger, 2014). For boreal regions, the mean [O3] of 28 ppbv (Fig. 4a) is much lower than this damaging threshold, explaining why the excess O3stomatal flux (the flux causing damages) is low there (Fig. 8). Statistics in Yue
PAR (W m-2) 0 100 200 300 400 GPP ( µ mol C m -2 s -1) 0 10 20 30 ModelObs
(a) Site CA-Gro
PAR (W m-2) 0 100 200 300 400 0 5 10 15 20 (b) Site CA-Qfo
Figure 5. Observed (blue) and simulated (red) response of GPP to diffuse (square) and direct (triangle) PAR at boreal sites (a) CA-Gro (2004–2013) and (b) CA-Qfo (2004–2010). Observations and simulations are split into “diffuse” and “direct” conditions when the diffuse fraction is > 0.8 and < 0.2, respectively. Data points are then averaged over PAR bins of 30 W m−2with error bars indicating 1 standard deviation of GPP for each bin.
! !
$#%"!
Figure 6. Changes in summer (a, b) [O3] and (c, d) AOD at 550 nm induced by wildfire
$#%%! (a) 6O3 by wildfire in 2010 -10 -6 -2 2 6 10 (ppbv) (b) 6O3 by wildfire in 2050 -10 -6 -2 2 6 10 (ppbv) (c) 6AOD by wildfire in 2010 -0.15 -0.09 -0.03 0.03 0.09 0.15 (d) 6AOD by wildfire in 2050 -0.15 -0.09 -0.03 0.03 0.09 0.15
Figure 6. Changes in summer (a, b) [O3] and (c, d) AOD at 550 nm induced by wildfire emissions in (a, c) the 2010s and (b, d) the 2050s
over boreal North America. Only significant changes (p < 0.05) are shown.
et al. (2015) show that maximum daily 8 h average (MDA8) [O3] with fire contributions can be higher than 40 ppbv in Alaska and Canada. However, such episodes appear at the 95th percentile for present day and 90th percentile for mid-century, suggesting that O3vegetation damage is rare in bo-real North America and fire-induced O3 enhancement does not exacerbate such damages. Therefore, we do not consider O3damage effects further.
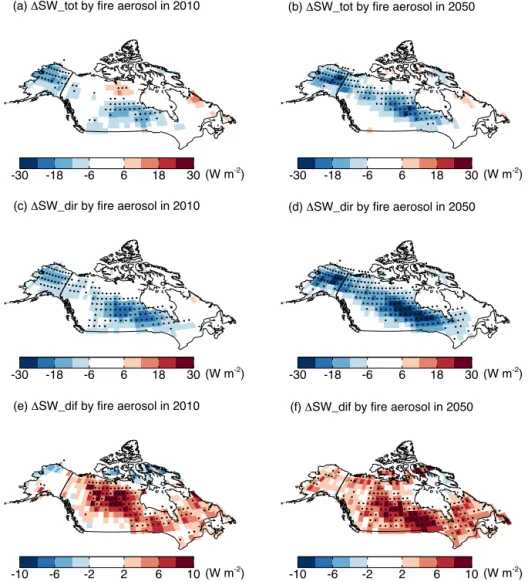
Fire aerosols cause significant perturbations in shortwave radiation at surface (Fig. 9). The direct light is largely atten-uated especially over Alaska and central Canada, where fire aerosols are most abundant (Fig. 6). In contrast, diffuse light
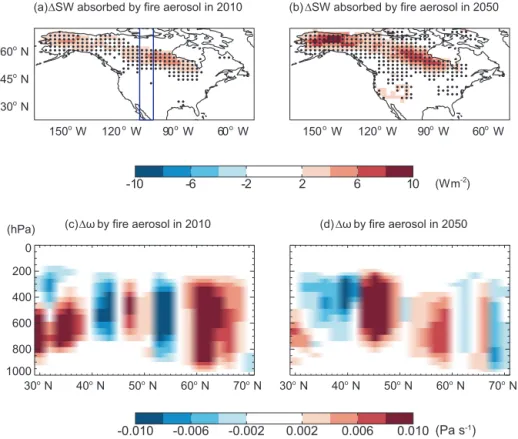
widely increases due to particle scattering. In the present day, the average reduction of 5.6 W m−2in the direct light com-ponent is in part offset by the enhancement of 2.6 W m−2 in the diffuse light component, leading to a net reduction of 3.0 W m−2in solar radiation over boreal North America. By the mid-century, a stronger reduction of 9.5 W m−2in direct light is accompanied by an increase of 4.0 W m−2in diffuse light, resulting in a net reduction of 5.5 W m−2in solar radi-ation. Fire-induced BC aerosols strongly absorb solar radia-tion in the atmospheric column (Fig. 10a, b). On average, fire aerosols absorb 1.5 W m−2in the present day and 2.6 W m−2 by the mid-century.
$%&%!
7.
$%&#!
(a) Low ozone damage in 2010
30oN
45oN
60oN 75oN
180o 150oW 120oW 90oW 60oW
(b) Low ozone damage in 2050
180o 150oW 120oW 90oW 60oW
(c) High ozone damage in 2010
30oN
45oN
60oN
75oN
180o 150oW 120oW 90oW 60oW
(d) High ozone damage in 2050
180o 150oW 120oW 90oW 60oW
-20 -12 -4 4 12 20 (%)
Figure 7. Simulated O3damages to summer GPP in North America. Results shown are from simulations with (a, b) low and (c, d) high O3
sensitivities for (a, c) 2010 and (b, d) 2050. Simulated [O3] includes contributions from both wildfire and non-fire emissions. Results for
2010 are derived as (F10O3/F10CTRL-1) · 100 %. Results for 2050 are derived as (F50O3/F50CTRL-1) · 100 %.
!
(a) O3 stomatal flux in 2010
30oN 45oN 60oN 75oN 180o 150oW 120oW 90oW 60oW (b) O3 stomatal flux in 2050 180o 150oW 120oW 90oW 60oW 0 80 160 240 320 400( mol m day- 2 - 1)
(c) Excess O3 stomatal flux in 2010
30oN
45oN
60oN
75oN
180o 150oW 120oW 90oW 60oW
(d) Excess O3 stomatal flux in 2050
180o 150oW 120oW 90oW 60oW
0 20 40 60 80 100
μ
( mol m dayμ - 2 - 1)
Figure 8. Simulated summertime O3stomatal fluxes in boreal North America. Results shown are the (a, b) mean and (c, d) excess flux at (a, c) 2010 and (b, d) 2050. Simulated [O3] includes contributions from both wildfire and non-fire emissions. Excess O3stomatal flux is
! ! !
! (a) 6SW_tot by fire aerosol in 2010
-30 -18 -6 6 18 30 (W m-2)
(b) 6SW_tot by fire aerosol in 2050
-30 -18 -6 6 18 30 (W m-2) (c) 6SW_dir by fire aerosol in 2010
-30 -18 -6 6 18 30 (W m-2)
(d) 6SW_dir by fire aerosol in 2050
-30 -18 -6 6 18 30 (W m-2) (e) 6SW_dif by fire aerosol in 2010
-10 -6 -2 2 6 10 (W m-2)
(f) 6SW_dif by fire aerosol in 2050
-10 -6 -2 2 6 10 (W m-2)
Figure 9. Changes in surface radiative fluxes induced by wildfire aerosols in boreal North America. Results shown are for the changes in summertime (June–August) (a, b) total, (c, d) direct, and (e, f) diffuse solar radiation at surface caused by aerosols from wildfire emissions at (a, c, e) present day and (b, d, f) mid-century. Significant changes (p < 0.05) are marked with black dots. Results for 2010 are calculated as F10AERO–F10CTRL. Results for 2050 are calculated as F50AERO–F50CTRL.
Atmospheric circulation patterns respond to the aerosol-induced radiative perturbations (Fig. 10c, d). Surface radia-tive cooling and atmospheric heating together increase air stability and induce anomalous subsidence. In the present day, such descending motion is confined to 55–68◦N, ac-companied by a rising motion at 52–55◦N (Fig. 10c). As a re-sult, fire aerosols induce surface warming at higher latitudes but cooling at lower latitudes in boreal regions (Fig. 11a). Meanwhile, precipitation is inhibited by the subsidence in northwestern Canada but is promoted by the rising motion in the southwest (Fig. 11c). By the mid-century, the range of subsidence expands southward to 42◦N (Fig. 10d) due to strengthened atmospheric heating (Fig. 10b). The down-ward convection of warm air offsets surface radiative cooling (Fig. 9b), leading to a significant warming in the southwest (Fig. 11b). The expanded subsidence further inhibits
precip-itation in vast domain of Canada (Fig. 11d). Soil moisture is closely related to rainfall and as a result exhibits dipole changes (drier north and wetter south) in the present day (Fig. 11e) but widespread reductions (Fig. 11f) by the mid-century.
In response to the climatic effects of fire aerosols, bo-real NPP shows distinct changes between the present day and mid-century (Fig. 12). Such changes in NPP are a con-sequence of changes in GPP and autotrophic respiration (Fig. S2). Variations in plant respiration resemble those of GPP, because higher photosynthesis leads to faster leaf and tissue development, resulting larger maintenance and growth respiration. In the 2010s, forest NPP increases by 5–15 % in Alaska and southern Canada but decreases by 5–10 % in northern and eastern Canada. This pattern of NPP changes (1NPP) is connected to the climatic effects of aerosols,
(a) ∆SW absorbed by fire aerosol in 2010
30oN 45oN 60oN
150oW 120oW 90oW 60oW
(b) ∆SW absorbed by fire aerosol in 2050
150oW 120oW 90oW 60oW -10 -6 -2 2 6 10 (W m-2) 30oN 40oN 50oN 60oN 70oN 1000 800 600 400 200 0 (c) ∆ω by fire aerosol in 2010 30oN 40oN 50oN 60oN 70oN (d) ∆ω by fire aerosol in 2050 -0.010 -0.006 -0.002 0.002 0.006 0.010 (Pa s-1) (hPa)
Figure 10. Predicted (a, b) absorption of shortwave radiation and (c, d) perturbations in vertical velocity by wildfire aerosols at (a, c) present day and (b, d) mid-century. The absorption of shortwave radiation is calculated as the differences of radiative perturbations between top of atmosphere and surface. Vertical velocity is calculated as the longitudinal average between 105 and 112.5◦W (two blue lines in panel a). Positive (negative) values indicate descending (rising) motion. Results for the 2010s are calculated as F10AERO–F10CTRL. Results for the 2050s are calculated as F50AERO–F50CTRL. Significant changes (p < 0.05) in panel (a, b) are indicated as black points.
especially changes in soil moisture (Fig. 11). The correla-tion between 1NPP (Fig. 12a) and changes in soil moisture (Fig. 11e) reaches R = 0.56 (n = 356), much higher than the values of R = −0.11 for temperature change (Fig. 11a) and R =0.22 for precipitation change (Fig. 11c). On the conti-nental scale, the patchy responses of NPP offset each other. Since the dominant fraction of carbon uptake occurs in south-ern Canada (Fig. 3a), where positive NPP change is pre-dicted (Fig. 12a), wildfire aerosols enhance the total NPP by 72 Tg C yr−1in the present day (Table 5). In contrast, in-creased wildfire emissions in the 2050s inhibit precipitation (Fig. 11d) and decrease soil moisture in boreal North Amer-ica (Fig. 11f), leading to widespread NPP reductions and a total NPP loss of 118 Tg C yr−1(Fig. 12b, Table 5).
4 Discussion
4.1 Roles of aerosol climatic feedback
The contrasting sign of NPP responses in the present day and mid-century are closely related to the aerosol-induced sur-face climatic feedback. Sensitivity experiments using offline YIBs model (Table 3) allowed assessment of the impacts
Table 5. Changes in NPP (Tg C yr−1) caused by composite and in-dividual climatic effects of fire aerosols.
2010s 2050s Onlinea 72 −118 Offline totalb 126 −97 Temperature 11 −22 Radiation 8 14 Soil moisture 104 −86
aOnline results are calculated using the
ModelE2-YIBs model with F10AERO–F10CTRL for the 2010s and F50AERO–F50CTRL for the 2050s.
bOffline results are calculated with the YIBs model
driven with individual or combined changes in temperature, radiation, and soil moisture.
of individual changes in the major meteorological drivers, including temperature, radiation (diffuse and direct), and soil moisture (Table 5). The offline simulations driven with changes in all three variables yield 1NPP of 126 Tg C yr−1 for the 2010s and −97 Tg C yr−1 for the 2050s. These val-ues are different from the online simulations, which predict 1NPP of 72 Tg C yr−1for the 2010s and −118 Tg C yr−1for the 2050s. A lack of other aerosol-induced feedbacks in the
!
(a) 6TAS by fire aerosol in 2010
-1.0 -0.6 -0.2 0.2 0.6 1.0 (oC)
(b) 6TAS by fire aerosol in 2050
-1.0 -0.6 -0.2 0.2 0.6 1.0 (oC) (c) 6PREC by fire aerosol in 2010
-1.0 -0.6 -0.2 0.2 0.6 1.0 (mm d-1)
(d) 6PREC by fire aerosol in 2050
-1.0 -0.6 -0.2 0.2 0.6 1.0 (mm d-1)
(e) 6SOILW by fire aerosol in 2010
-30 -18 -6 6 18 30 (%)
(f) 6SOILW by fire aerosol in 2050
-30 -18 -6 6 18 30 (%)
Figure 11. Predicted changes in summertime (a, b) surface air temperature, (c, d) precipitation, and (e, f) soil water content at surface caused by aerosols from wildfire emissions at (a, c, e) present day and (b, d, f) mid-century. Results for temperature and precipitation are shown as absolute changes. Results for soil water are shown as relative changes. Results for the 2010s are calculated as F10AERO–F10CTRL. Results for the 2050s are calculated as F50AERO–F50CTRL. Significant changes (p < 0.05) are marked with black dots.
(a) 6NPP by fire aerosol in 2010 (b) 6NPP by fire aerosol in 2050
-30 -18 -6 6 18 30 (%)
Figure 12. Predicted percentage changes in summer NPP caused by wildfire aerosols at (a) present day and (b) mid-century. Results for the 2010s are calculated as (F10AERO/F10CTRL-1) · 100 %. Results for the 2050s are calculated as (F50AERO/F50CTRL-1) · 100 %. Signifi-cant changes (p < 0.05) are marked with black dots.
offline model, for example changes in relative humidity, sur-face pressure, soil temperature, and turbulence momentum, may cause such discrepancy between the online and offline simulations. Seasonal analyses show that summertime 1NPP is 99 Tg C at present day and −95 Tg C at mid-century, dom-inating the NPP changes all through the year, because both wildfire emissions and ecosystem photosynthesis maximize in boreal summer.
Observations show that aerosols can promote plant pho-tosynthesis through increasing diffuse radiation (Niyogi et al., 2004; Cirino et al., 2014; Strada et al., 2015). Our analy-ses with ground data also show positive correlations between GPP and PARdif(Fig. 2 and Table 4), and the model repro-duces observed GPP responses to perturbations in direct and diffuse PAR (Fig. 5). Wildfire aerosols enhance diffuse radi-ation by 2.6 W m−2 (1.7 %) at present day and 4.0 W m−2 (2.3 %) at mid-century in boreal North America (Fig. 9). With these changes, simulated NPP increases by 8 Tg C yr−1 at the 2010s and 14 Tg C yr−1 at the 2050s (Table 5). Near the two AMF sites (Fig. 2a), wildfires increase local AOD by 0.03 (Fig. 6c). Meanwhile, we estimate that summer average (00:00–24:00) GPP increases by 0.04 µmol m−2s−1 in the same region due to aerosol diffuse fertilization effects (DFE) based on the results of Y10_PAR–Y10_CTRL. This change suggests a simulated GPP sensitivity of 1.2 µmol m−2s−1 (22 %) per unit AOD. Observed GPP sensitivity to AOD at the two sites are 2.3 (19 %) and 4.5 µmol m−2s−1(58 %) per unit AOD (Fig. 2d, e). The absolute value of GPP sensitivity from simulations is much smaller than that of observations, because the former is for 24 h average while the latter is only for noontime (10:00–14:00). The relative change of 22 % in YIBs model falls within the observed range of 19–58 %.
The estimated NPP changes of 8 Tg C yr−1 by the radia-tive effects of boreal fire aerosols are much weaker than the enhancement of 78–156 Tg C yr−1 by fires in the Ama-zon basin (Rap et al., 2015). There are at least two rea-sons for such a difference in the DFE between boreal and Amazon fire aerosols. First, wildfire emissions and associ-ated impacts on radiation are much smaller in boreal regions. Wildfires in Alaska and Canada directly emit 68 Tg C yr−1 at the 2010s, resulting in enhancement of summer AOD by 35 % and diffuse radiation by 1.7 %. These boreal emissions are much smaller than the ∼ 240 Tg C yr−1 in the Amazon basin (van der Werf et al., 2010), where fires enhance re-gional PM2.5 concentrations by 85 % and diffuse radiation by 6.2 % in dry seasons (Rap et al., 2015). Second, larger solar insolation at lower latitudes allows stronger DFE for the same unit change of diffuse radiation. In our prediction, most of the NPP changes occur at high latitudes in boreal regions (Fig. 12), where total insolation is not so abundant as that in the tropical areas. Consequently, the decline of di-rect radiation in boreal regions more likely converts the light availability of sunlit leaves from light saturation to light lim-itation, offsetting the benefit from enhanced diffuse radiation for shaded leaves. For this study, we do not find GPP
reduc-tion by the decline of direct light at the two AMF sites (Ta-ble 4), possibly because these sites are located at middle lat-itudes (< 50◦N). In the future, more observations at higher latitudes (> 55◦N) are required to explore the sensitivity of GPP to AOD in light-limited conditions.
Simulations have shown that absorbing aerosols can cause regional drought by increasing air stability (Liu, 2005; Cook et al., 2009; Tosca et al., 2010). Our results confirm this ten-dency but with a varied range of hydrological responses de-pending on the magnitude of wildfire emissions (Figs. 11c– f). Observations suggest that precipitation (and the associated soil moisture) is the dominant driver of the changes in GPP over North America, especially for the domain of cropland (Beer et al., 2010). Sensitivity experiments with offline YIBs model show that changes in soil moisture account for 82.5 % of 1NPP at present day and 70.5 % of 1NPP at mid-century (Table 5). These results suggest that aerosol-induced changes in soil water availability, instead of temperature and radia-tion, dominantly contribute to the changes of boreal NPP, consistent with observational and experimental results (Ma et al., 2012; Girardin et al., 2016; Chen et al., 2017). 4.2 Limitations and uncertainties
In this study, we examine the interactions among climate change, fire activity, air pollution, and ecosystem produc-tivity. To reduce the complexity of the interactions, we fo-cus on the most likely dominant feedback and thus main chain of events: climate → fire → pollution → biosphere (Fig. 1). However, our choice of feedback analysis does not mean that the interplay of other processes is unimportant. For example, climate-induced changes in vegetation cover and types can influence fire activity by alteration of fuel load and air pollution by BVOC emissions (climate → biosphere →fire/pollution). In addition, other feedbacks may amplify ecosystem responses but are not considered. For example, the drought caused by fire aerosols in the mid-century (Fig. 11) may help increase fire activity (fire → pollution → climate → fire). Furthermore, we apply fixed SSTs in the climate simulations because reliable ocean heat fluxes for the future world were not available. Many previous studies have inves-tigated regional aerosol–climate feedbacks without ocean re-sponses. For example, Cook et al. (2009) found that dust– climate–vegetation feedback promotes drought in US, with a climate model driven by prescribed SSTs. Similarly, Liu (2005) found fire aerosols enhance regional drought using a regional climate model, which even ignores the feedback be-tween local climate and large-scale circulation. While we do concede that our experimental design is not a complete as-sessment of all known processes and feedbacks, within these limitations, this study for the first time quantifies the indirect impacts of wildfire on long-range ecosystem productivity un-der climate change.
We use the ensemble projected fire emissions from Yue et al. (2015). Area burned is predicted based on the
simu-lated meteorology from multiple climate models. Such an approach may help reduce model uncertainties in climatic responses to CO2changes (Collins et al., 2013; Kirtman et al., 2014) but cannot remove the possible biases in the se-lection of climate scenarios and fire models. All predictions in Yue et al. (2015) are performed under the IPCC A1B sce-nario. With two different scenarios, A2 of high emissions and B2 of low emissions, Balshi et al. (2009) showed that fu-ture area burned in boreal North America increases at a sim-ilar rate until the 2050s, after which area burned in A2 sce-nario increases much faster than that in B2 scesce-nario. On av-erage, boreal area burned in Balshi et al. (2009) increases by ∼ 160 % during 2051–2060 compared with 2001–2010, which is much higher than the change of 66 % in Yue et al. (2015). In contrast, Amiro et al. (2009) predicted that bo-real area burned at the 2 × CO2scenario increases only by 34 % relative to the 1 × CO2scenario. This ratio is only half of the estimate in Yue et al. (2015), which compared results between periods with 1.44 × CO2and 1 × CO2. The discrep-ancies among these studies are more likely attributed to the differences in fire models. Although both Amiro et al. (2009) and Yue et al. (2015) developed fire weather regressions in boreal ecoregions, the former study did not include geopo-tential height at 500 hPa and surface relative humidity as pre-dictors, which make dominant contributions to area burned changes in the latter study. In contrast, Balshi et al. (2009) de-veloped nonlinear regressions between area burned and cli-mate on a grid scale, which helps retain extreme values at both the temporal and spatial domain. Compared to previ-ous estimates, Yue et al. (2015) predicted median increases in future fire emissions over boreal North America.
We apply constant land cover and fuel load for both present day and mid-century, but we estimate an increase in fuel consumption due to changes in fuel moisture. Fu-ture projection of boreal fuel load is highly uncertain because of multiple contrasting influences. For example, using a dy-namic global vegetation model (DGVM) and an ensemble of climate change projections, Heyder et al. (2011) predicted a large-scale dieback in boreal–temperate forests due to in-creased heat and drought stress in the coming decades. In contrast, projections using DGVMs show a widespread in-crease in vegetation carbon under the global warming sce-nario with CO2 fertilization of photosynthesis (Friend et al., 2014; Knorr et al., 2016). In addition, compound factors such as greenhouse gas mitigation (Kim et al., 2017), popu-lation change (Knorr et al., 2016), pine beetle outbreak (Kurz et al., 2008), and fire management (Doerr and Santin, 2016) may exert varied impacts on future vegetation and fuel load. Although we apply constant fuel load, we consider changes of fuel moisture because warmer climate states tend to dry fuel and increase fuel consumption (Flannigan et al., 2016). With constant fuel load but climate-driven fuel moisture, we calculate a 9 % increase in boreal fuel consumption by the mid-century (Yue et al., 2015). Although such increment is higher than the prediction of 2–5 % by Amiro et al. (2009)
for a doubled-CO2climate, the consumption-induced uncer-tainty for fire emission is likely limited because changes in area burned are much more profound.
Predicted surface [O3] is much higher than observations over boreal North America (Fig. 4). This bias does not af-fect main conclusions of this study, because predicted O3 causes limited damages to boreal GPP even with the over-estimated [O3] (Fig. 7). The result confirms that fire-induced O3vegetation damage is negligible in boreal North America. For aerosols, the model captures reasonable spatial pattern of AOD but with a background value of ∼ 0.1 outside fire-prone regions, where the observed AOD is usually 0.1–0.2 (Fig. 3). This discrepancy may be related to the insufficient represen-tations of physical and chemical processes in the model but may also result from the retrieval biases in MODIS data due to the poor surface conditions (Liu et al., 2005) and small AOD variations (Vachon et al., 2004) at high latitudes.
Simulated aerosol climatic effects depend on radiative and physical processes implemented in the climate model. We find that present-day boreal fire aerosols on average ab-sorb 1.5 W m−2in the atmosphere (Fig. 10), which is much smaller than the value of 20.5 ± 9.3 W m−2for fires in equa-torial Asia (Tosca et al., 2010). This is because boreal fires enhance AOD only by 0.03 while tropical fires increase AOD by ∼ 0.4. Previous modeling studies showed that fire plumes induce regional and downwind drought through enhanced at-mospheric stability (Feingold et al., 2005; Tosca et al., 2010; Liu et al., 2014). Most of these results were based on the direct and/or semidirect radiative effects of fire aerosols. In-clusion of the indirect aerosol effect may further inhibit pre-cipitation and amplify drought but may also introduce ad-ditional uncertainties for the simulations. The fire–drought interaction may promote fire activity, especially in a warmer climate. Ignoring this interaction may underestimate future area burned and the consequent emissions.
4.3 Implications
Inverse modeling studies have shown that the land ecosys-tems of boreal North America are carbon neutral in the present day, with the estimated land-to-air carbon flux from −270 ± 130 to 300 ± 500 Tg C yr−1 (Gurney et al., 2002; Rödenbeck et al., 2003; Baker et al., 2006; Jacobson et al., 2007; Deng et al., 2014). Here, we reveal a missing land carbon source due to future wildfire pollution, tak-ing into account full coupltak-ing among fire activity, climate change, air pollution, and the carbon cycle. Fire pollution aerosol increases boreal NPP by 72 Tg C yr−1in the present day, comparable to the direct carbon loss of 68 Tg C yr−1 from wildfire CO2 emissions (product of biomass burned and CO2 emission factors). By mid-century, increasing fire emissions instead cause a NPP reduction of 118 Tg C yr−1 due to the amplified drought. Although NPP is not a di-rect indicator of the land carbon sink, reduction of NPP is always accompanied with the decline of net ecosystem
ex-change and the enhanced carbon loss. In combination with the enhanced carbon emission of 130 Tg C yr−1, future bo-real wildfire presents an increasing threat to the regional car-bon balance and global warming mitigation. Furthermore, the NPP reductions are mostly located in southern Canada, where cropland is the dominant ecosystem, newly exposing the future wildfire-related air pollution risk to food produc-tion.
Our analyses of fire pollution effects on boreal North American productivity may not be representative for other boreal ecosystems and/or on the global scale. There is sub-stantial variability in plant species, topography, and climatol-ogy across different boreal regions. Such differences indicate distinct GPP sensitivities as well as fire characteristics. At lower latitudes, where anthropogenic pollution emissions are more abundant, ambient ozone concentrations may have ex-ceeded damaging thresholds for most plant species. In those regions, additional ozone from a fire plume may cause more profound impacts on photosynthesis than our estimate for boreal North America. For example, Amazonian fire is pre-dicted to reduce forest NPP by 230 Tg C yr−1 through the generation of surface ozone (Pacifico et al., 2015). Mean-while, solar radiation is more abundant at lower latitudes, in-dicating more efficient increases in photosynthesis through aerosol DFE because the sunlit leaves receive saturated di-rect light in those regions. As shown in Beer et al. (2010), partial correlations between GPP and solar radiation are pos-itive in boreal regions but negative over the subtropics and tropics, suggesting that light extinction by fire aerosols has contrasting impacts on plant photosynthesis in the high ver-sus low latitudes. Further simulations and analyses are re-quired to understand the net impacts of ozone and aerosols from biomass burning on the global carbon cycle.
Data availability. Data used in this study can be provided
upon request to the corresponding author, Xu Yue (xuyue-seas@gmail.com). Due to limited disk space, simulation results used for analyses will be deleted 1 year after the paper’s publica-tion.
The Supplement related to this article is available online at https://doi.org/10.5194/acp-17-13699-2017-supplement.
Competing interests. The authors declare that they have no conflict of interest.
Acknowledgements. Xu Yue acknowledges funding support
from the National Key Research and Development Program of China (grant no. 2017YFA0603802), the National Basic Research Program of China (973 program, grant no. 2014CB441202), and the “Thousand Youth Talents Plan”. Nadine Unger acknowledges
funding support from the University of Exeter. Edited by: Frank Dentener
Reviewed by: two anonymous referees
References
Alvarado, M. J., Logan, J. A., Mao, J., Apel, E., Riemer, D., Blake, D., Cohen, R. C., Min, K.-E., Perring, A. E., Browne, E. C., Wooldridge, P. J., Diskin, G. S., Sachse, G. W., Fuel-berg, H., Sessions, W. R., Harrigan, D. L., Huey, G., Liao, J., Case-Hanks, A., Jimenez, J. L., Cubison, M. J., Vay, S. A., Wein-heimer, A. J., Knapp, D. J., Montzka, D. D., Flocke, F. M., Pol-lack, I. B., Wennberg, P. O., Kurten, A., Crounse, J., Clair, J. M. St., Wisthaler, A., Mikoviny, T., Yantosca, R. M., Carouge, C. C., and Le Sager, P.: Nitrogen oxides and PAN in plumes from boreal fires during ARCTAS-B and their impact on ozone: an integrated analysis of aircraft and satellite observations, At-mos. Chem. Phys., 10, 9739–9760, https://doi.org/10.5194/acp-10-9739-2010, 2010.
Amiro, B. D., Cantin, A., Flannigan, M. D., and de Groot, W. J.: Future emissions from Canadian boreal forest fires, Can. J. Forest Res., 39, 383–395, https://doi.org/10.1139/X08-154, 2009. Andreae, M. O. and Merlet, P.: Emission of trace gases and aerosols
from biomass burning, Global Biogeochem. Cy., 15, 955–966, 2001.
Atkin, O. K. and Tjoelker, M. G.: Thermal acclimation and the dy-namic response of plant respiration to temperature, Trends Plant Sci., 8, 343–351, https://doi.org/10.1016/S1360-1385(03)00136-5, 2003.
Baker, D. F., Law, R. M., Gurney, K. R., Rayner, P., Peylin, P., Denning, A. S., Bousquet, P., Bruhwiler, L., Chen, Y. H., Ciais, P., Fung, I. Y., Heimann, M., John, J., Maki, T., Maksyutov, S., Masarie, K., Prather, M., Pak, B., Taguchi, S., and Zhu, Z.: TransCom 3 inversion intercomparison: Impact of trans-port model errors on the interannual variability of regional CO2fluxes, 1988–2003, Global Biogeochem. Cy., 20, GB1002,
https://doi.org/10.1029/2004gb002439, 2006.
Ball, J. T., Woodrow, I. E., and Berry, J. A.: A model predict-ing stomatal conductance and its contribution to the control of photosyn- thesis under different environmental conditions, in: Progress in Photosynthesis Research, edited by: Biggins, J., Ni-jhoff, Dordrecht, Netherlands, 110–112, 1987.
Balshi, M. S., McGuirez, A. D., Duffy, P., Flannigan, M., Walsh, J., and Melillo, J.: Assessing the response of area burned to changing climate in western boreal North America using a Mul-tivariate Adaptive Regression Splines (MARS) approach, Glob. Change Biol., 15, 578–600, https://doi.org/10.1111/J.1365-2486.2008.01679.X, 2009.
Beer, C., Reichstein, M., Tomelleri, E., Ciais, P., Jung, M., Carval-hais, N., Rodenbeck, C., Arain, M. A., Baldocchi, D., Bonan, G. B., Bondeau, A., Cescatti, A., Lasslop, G., Lindroth, A., Lomas, M., Luyssaert, S., Margolis, H., Oleson, K. W., Roupsard, O., Veenendaal, E., Viovy, N., Williams, C., Woodward, F. I., and Pa-pale, D.: Terrestrial Gross Carbon Dioxide Uptake: Global Dis-tribution and Covariation with Climate, Science, 329, 834–838, https://doi.org/10.1126/Science.1184984, 2010.
![Figure 4. Evaluation of simulated summer surface maximum daily 8 h average [O 3 ] with observations for 2008–2012](https://thumb-eu.123doks.com/thumbv2/123doknet/13083460.384958/10.918.105.405.107.737/figure-evaluation-simulated-summer-surface-maximum-average-observations.webp)
![Figure 6. Changes in summer (a, b) [O 3 ] and (c, d) AOD at 550 nm induced by wildfire](https://thumb-eu.123doks.com/thumbv2/123doknet/13083460.384958/11.918.207.719.391.789/figure-changes-summer-o-aod-nm-induced-wildfire.webp)