N
DISSOLUTION KINETICS AND MECHANISMS IN QUARTZ-AND GRANITE-WATER SYSTEMS
by
WILLIAM GABRIEL WORLEY
B.S., Chemical Engineering, Rensselaer Polytechnic Institute, 1986
M.S., Chemical Engineering Practice, Massachusetts Institute of Technology, 1989
. Submitted to the Department of Chemical Engineering in Partial Fulfillment of the Requirements for the Degree of
'DOCTOR OF PHILOSOPHY at the
MASSACHUSETTS INSTITUTE OF TECHNOLOGY
May 1994
0 Massachusetts Institute of Technology 1994 All Rights Reserved
Department &Chemical Engineering
May 16, 1994 Signature of Author
Certified by
Professor Jefferson W. Tester Thesis Supervisor
AcceDted bv
__ 11- -___ __ -__
Robert E. CohenDISSOLUTION KINETICS AND MECHANISMS IN QUARTZ-AND GRANITE-WATER SYSTEMS
by
WILLIAM GABRIEL WORLEY
Submitted to the Department of Chemical Engineering on May 16, 1994, in Partial Fulfillment of the
Requirements for the Degree of
Doctor of Philosophy in Chemical Engineering
ABSTRACT
During the past 50 years, quartz dissolution kinetics and solubility measurements have been the subject of numerous investigations. Researchers have been motivated either because of their interest in understanding important natural geologic processes in the earth or because of a need to quantify dissolution rates for chemical processes above ground or for geothermal energy extraction underground using heat mining concepts. However, the reactivity of minerals in natural environments cannot be predicted from laboratory dissolution rates.
The motivation for carrying out this project was driven by engineering issues related to mineral transport in circulating hot dry rock (HDR) geothermal systems. Of critical importance to HDR is the characterization of the dissolution rate of host reservoir
rock as a function of temperature, pressure and liquid phase composition. In general, quartz is a major mineral component in HDR reservoirs in low permeability crystalline rock. Furthermore, quartz is highly reactive relative to other constituent minerals in aqueous environments at temperatures of interest to HDR geothermal energy extraction (1500 to 3000C).
Quartz dissolution rate data were collected in deionized water from 23' to 20'C and correlated with measurements from twelve previous investigations from 250 to 625'C. A simple global equation accounting for reduced global rates due to an approach to saturation satisfactorily represented experimental data spanning temperatures from 230 to 625'C obtained from crushed quartz crystals, quartz sand, and quartz slab samples. Geometric andBET-derived surface areas were equally successful in normalizing quartz dissolution rates. An Arrhenius expression describing an empirically-derived global dissolution rate constant with an average activation energy of 89 ± kJ/mol in deionized water was regressed from the set of dissolution rate data covering eleven orders of magnitude in variation from about 4 x 1-14 mol/m2 s at 250C to 1 x 10⁻³ Vm2 s at 625'C on a geometric area basis.
The quartz dissolution rates reported in literature at 250C are two to three orders of magnitude higher than predicted by the global rate equation. This discrepancy was explained based on inadequate surface preparation procedures. Dissolution rates at 25'C predicted by the global rate equation are 4 x 1-14 mol/m2s (geometric area basis) or 03 A/yr, thus long run times and extensive surface preparation are required. Experiments were carried out for 812 days at 23'C in batch bottles using sand pretreated in the spinning basket eactor, resulting in rate data that agreed with the global rate equation.
sodium ion concentration (or ionic strength). The order of sodium ion concentration was 0.26 while the hydroxide ion concentration order varied from 052 at 100'C to 062 at 200'C. The non-integer nature of these regressed parameters was attributed to regressing data based on solution species instead of the more appropriate surface species basis. Unfortunately, surface concentrations are unknown at the conditions investigated in this study, therefore, the utility of adsorption models was evaluated. Surface charge models based on electrostatic theories are not robust enough to extrapolate to higher
temperatures, therefore, classical adsorption isotherms borrowed from heterogeneous catalysis were employed to model the dissolution behavior of quartz. The saturation effect of NaCl was fit well by a first order Langmuir-Hinschelwood model.
The dissolution rate in HN03 solutions is only slightly dependent on pH, decreasing as the pH is lowered from deionized water conditions to pH 2 to 3 and perhaps increasing below pH 2 The quartz surface has minimal net charge at pH 2 to 3 at 25'C, which coincides with the minimum in the dissolution rate, suggesting that surface charge may be an important intermediate in the dissolution pathway.
The surface area basis for normalizing dissolution rates was further investigated by comparing the dissolution rate behavior of crushed quartz crystals from Hot Springs, Arkansas with Ottawa sand in NaOH solutions. The geometric surface area basis provided very good agreement between the two quartz samples, with the BET surface area basis yielding a slightly worse agreement.
The apparent activation energy for quartz dissolution is model dependent. In the past, the activation energy of quartz dissolution was stated as being pH dependent. However, this occurs because the true mechanism of quartz dissolution is not known. The effects of the hydroxide ion concentration and ionic strength on the rate of
dissolution were separated from the global dissolution rate constant using a fractional order empirical rate law. The apparent activation energy in the fractional order rate constant from 100' to 200'C in solutions varying from deionized water to hydroxide ion concentrations (from NaOH) of 0009 mol/kg H20 and sodium concentrations (from NaOH and Nad) of 0. 1 mol/kg H20 was found to be 83 ±5) kJ/mol and independent of
solution composition. The agreement between this value and the global activation energy in deionized water is fortuitous, since the effects of the hydroxide ion are embedded in the global rate constant.
The applicability of the quartz dissolution kinetics to the dissolution of the quartz phase in granite was evaluated. Previous studies suggested that the quartz phase would be dominant at'200'C. However, the dissolution of feldspars was found to be important. The dissolution rate of individual phases in granite was estimated to be one to two orders of magnitude faster than individual mineral rates. The grain boundaries or other inter-mineral phase effects may enhance the high dissolution rates in granite.
The major accomplishments in this study are: (1 a global correlation of quartz dissolution rate data in deionized water that exhibited good agreement from work from twelve investigators, revealed the difficulties in low temperature measurements, and presented a comprehensive value for the global activation energy for quartz dissolution in deionized water, 2) the effect of H+/OH-/Na+ was clearly rationalized and correlated from 100' to 200'C, 3) the effect of the surface area bases were critically analyzed by the global correlation in deionized water and by experiments performed in this study in NaOH solutions at 150'C on Ottawa sand and Hot Springs, Arkansas crushed crystals.
Thesis Supervisor: Jefferson W. Tester
This thesis is dedicated to my father; a piano tuner and organ builder by trade,
but an engineer at heart.
William Gabriel Worley, Sr. October 20, 19 1 0 - April 7 1991
ACKNOWLEDGMENTS
The completion of this thesis was made possible by the help of many individuals. I hope to thank most of them here, but I will probably forget some:
My advisor, Jeff Tester, who always had time for me (and the rest of his students), despite his very busy schedule. Jeff's enthusiasm in research was only matched by his eagerness to be a friend to his students.
Bruce Robinson and Chuck Grigsby, whose initial work on quartz dissolution provided me with a strong starting point, and whose continued conversations aided me throughout my stay here at MIT.
My thesis committee members, Professors Charles Satterfield, Preetinder Virk, and Jackie Ying, for their many helpful suggestions.
The Los Alamos National Laboratory, for providing partial financial support of the work carried out in this thesis.
Jeff Feerer, for making my life at Practice School, both as a student and as an Assistant Director, enjoyable as well as educational.
John Cremin, for willingness to teach me the finer points of machining. Without John's help, the low budget construction of the spinning basket reactors used in this thesis would not have been possible.
My many labmates over the years, who provided a fun (always) and yet productive (sometimes) environment. A special thanks to Uli, who was an easy target for screen saver pranks, to Matt, who always willing to lend a hand or an ear, and to Phil who would ask why Matt is giving me his ear.
Jay Corbett, for helping me upgrade my apparatus and for performing very tedious BET measurements.
My many friends at MIT, for providing an entertaining social environment, a very essential requirement for maintaining sanity. In particular, Dave Levy, one of the few people who would listen to my golf stories; Steve Spiegelberg a good friend even though he didn't buy enough blueberry yogurts; Krisztina Holly, for always being up for
mountain biking, and Walt Lunsmann, for giving me the opportunity to fall from a 700 foot cliff (with rope attached).
My mother, for stressing the importance of education; my father, for teaching me multiplication tricks which gave me an appreciation of mathematics and for helping me keep that 1976 Sunbird on the road; and the Garcia's, for providing me with a wonderful second family.
Peggy, who provided me with emotional support that has made my life and the
completion of this thesis a lot easier. Of course, the delivered home-cooked meals were also appreciated..
Table of Contents
List of Figures ... 9
List of Tables ... 13
Chapter 1. Introduction ... 15
1. I Background and M otivation ... 15
1.2 O rganizational Overview ... 18
Chapter 2. Review of Previous Work on Nfineral Dissolution ... 19
2.1 Experim ental Results ... 19
2. 1.1 Tem perature Effects ... 20
2.1.2 pH Effects ... 2
2.1.3 Ionic Strength Effects ... 2
2.1.4 D islocation Density Effects ... 23
2.2 D issolution Kinetics M odeling ... 24
2.2.1 Parabolic Rate Law ... 24
2.2.2 G lobal Rate Equation ... 28
2.2.3 Fractional Order Kinetics ... 35
2.3 M echanistic M odeling ... 36
2.3.1 Surface Com plexation M odels ... 36
2.3.2 Transition State Theory ... 36
2.3.3 M onte Carlo Sim ulation ... 46
2.3.4 A b Initio Quantum M echanics ... 47
2.4 Summary of Previous Work on Mineral Dissolution ... 52
Chapter 3. O bjectives and Approach ... 53
Chapter 4. Experim ental Techniques ... 55
4.1 M ineral Selection ... 55
4.2 M ineral Surface Preparation ... 55
4.2.1 Previous Techniques ... 55
4.2.1 M ethods em ployed in this study ... 57
4.3 M ineral Characterization ... 6 1 4.3.1 Previous W ork ... 61
4.3.2 Present Study ... 63
4.5 Solution Composition Analysis ... 81
4.6 Data Reduction and Propagation of Error ... 84
Chapter 5. Experimental Studies of Quartz Dissolution in Deionized Water ... 91
5.1 Background ... 91
5.2 Objectives ... 92
5.3 Experimental Results ... 92
5.4 A Dissolution Rate Correlation from 250 to 6250C ... 97
5.5 Discussion ... 106
5.5.1 Interpretation of Activation Energy for Quartz Dissolution ... 106
5.5.2 Dissolution-Active Quartz Surface Area ... 107
5.5.3 Uncertainties in Low Temperature Rate Measurements ... 109
5.5.4 Further Directions and Mechanistic Modeling Approaches ... ill Chapter 6 Experimental Studies of pH and Ionic Strength Effects on Quartz Dissolution ... 112
6.1 Background ... 112
6.2 Objectives ... 113
6.3 Correlation of Kinetic Data ... ... 113
6.4 Experimental Results ... 116
6.4.1 Effect of H+ with no salt present ... 116
6.4.2 Effect of OH- with no salt present ... 126
6.4.3 Effect of OH- at constant Na . ... 134
6.4.4 Effect of Na+ at constant OH . ... 137
6.4.5 Spinning Rate Effect on the Quartz Dissolution Rate ... 142
6.5 Regression Analysis of Quartz Dissolution Rate Data ... 144
6.6 Com parison with Previous W ork ... 149
6.7 M echanistic Im plications ... 158
Chapter 7. Experim ental Studies of Granite Dissolution ... 161
7.1 Background and M otivation ... 161
Chapter 8. Q uartz Dissolution M odeling ... 179
8.1 M odeling O bjectives and A pproach ... 179
8.2 Tem perature Dependence ... 180
8.3 Composition Dependence using Adsorption Models ... 189
8.3.1 Surface Charge M odeling ... 193
8.3.2 Langm uir Isotherm ... 204
8.3.3 Freundlich Isothen-n ... 209
Chapter 9. Conclusions ... 216
Chapter 10. A ppendices ... 220
10.1 Therm odynam ic Speciation M odel ... 220
10.2 Tabulated Experim ental D ata ... 228
10.3 N om enclature ... 230
List of Figures
Figure 1. 1 Hot Dry Rock (HDR) geothermal system concept . ... 16 Figure 21 The effect of pH on the dissolution rate of quartz . ... 22 Figure 22 Effect of surface chemical etching on the dissolution behavior of
albite ... 27 Figure 23 Solubility of quartz in pure water at the saturated solution vapor
pressure and at 1000 bar ... 34 Figure 24 Influence of surface charge on the quartz dissolution rate (from
Brady and Walther, 1989) ... 41 Figure 2.5 Potential energy surface of the hypothetical reaction AB + C - A
+ B C . ... 43 Figure 26 Assumed elementary reaction mechanism for quartz dissolution
(frorn Lasaga and Gibbs, 1990) ... 49 Figure 27 Ab initio equilibrium geometries for the H2O-H3SiOH system ... 50 Figure 41 Scanning Electron Microscope (SEM) photographs of quartz
particles before and after treatment to remove fines (present
study) ... 59 Figure 42 Dissolution behavior of pretreated Ottawa sand at 125'C
(present study) ... 60 Figure 43 Schematic of fluidized bed reactor used by Chou and Wollast
(1984,1985a) . ... 69 Figure 44 Schematic of single-pass stirred flow-cell reactor used by Holdren
and Speyer 1985, 1986) . ... 70 Figure 45 Dissolution rate data from the differential packed bed reactor
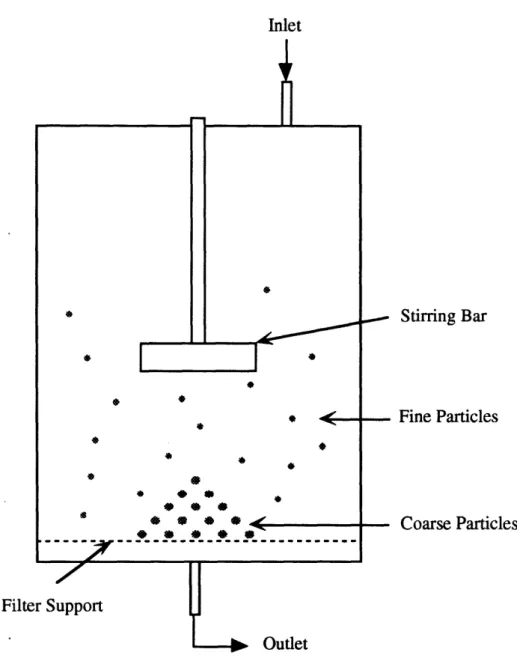
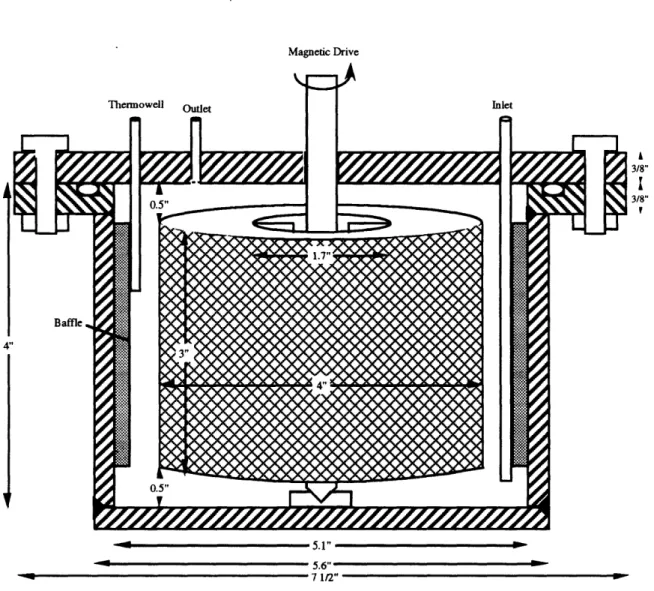
(Knauss and Wolery, 1988) . ... 71 Figure 46 Schematic of the original titanium spinning basket continuous-flow
stirred tank reactor (present study) ... 74 Figure 47 Schematic of the titanium stationary basket continuous-flow stirred
tank reactor (present study) ... 75 Figure 48 Schematic of the original titanium spinning basket continuous-flow
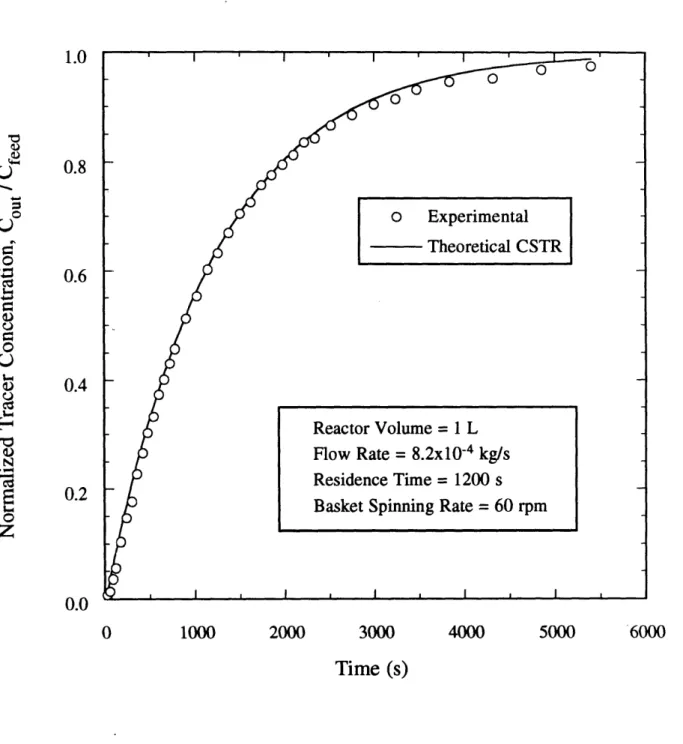
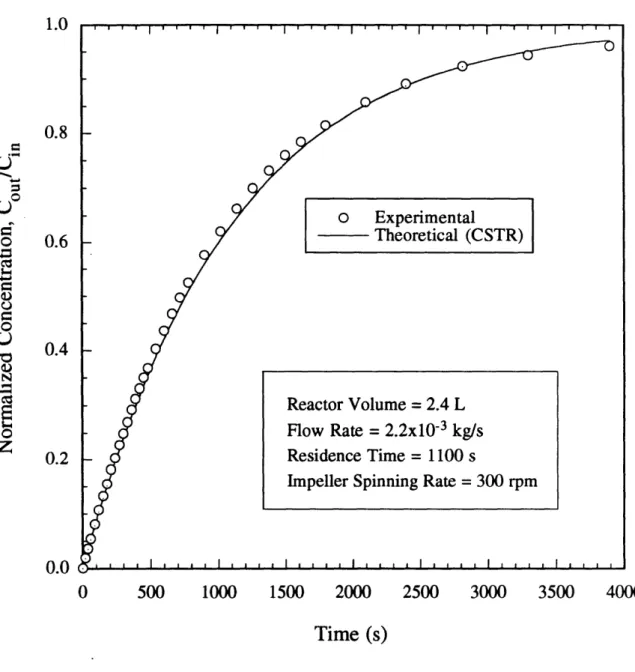
stirred tank reactor system (present study) . ... 77 Figure 49 Tracer study of residence time distribution in Spinning Basket
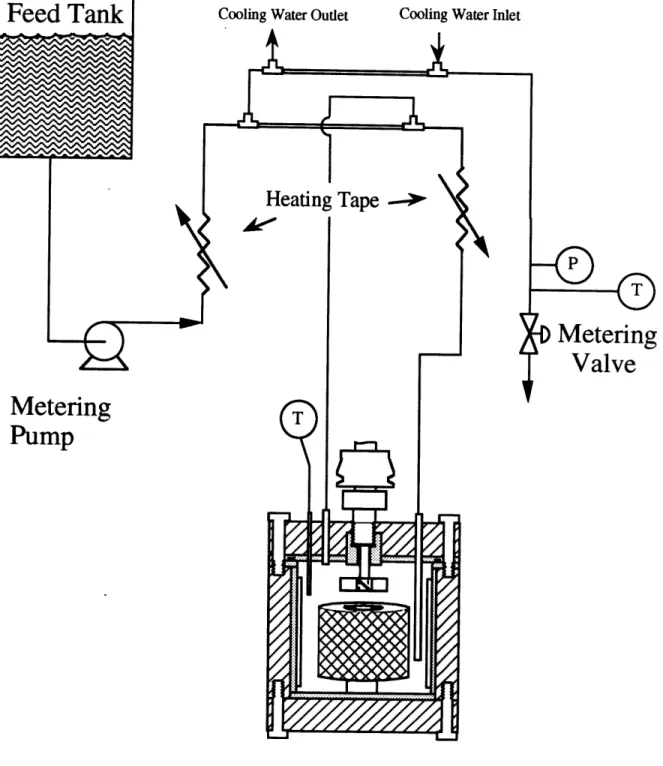
Figure 4 10 Schematic of the upgraded titanium continuous-flow stirred tank
reactor (CSTR) system (present study) . ... 80 Figure 4 1 1 Tracer study of residence time distribution in upgraded Spinning
Basket with spinning impeller (present study) . ... 82 Figure 412 Typical calibration curve for the molybdate blue method at 640
and 815 nm (present study) . ... 83 Figure 5.1 Quartz dissolution rate constant versus time at 23'C in the Batch
Bottle reactor (present study) . ... 98 Figure 52 Quartz dissolution rate constant versus time at 50'C in the Batch
Bottle reactor (present study) . ... 99 Figure 53 Quartz dissolution kinetics in pure water from 25' to 625'C using
a geometric surface area basis and Arrhenius coordinates . ... 103 Figure 54 Quartz dissolution kinetics in pure water from 25' to 300'C using
a BET-determined surface area basis and Arrhenius coordinates ... 104 Figure 61 Quartz dissolution in low pH solutions of HN03 at 100'C and
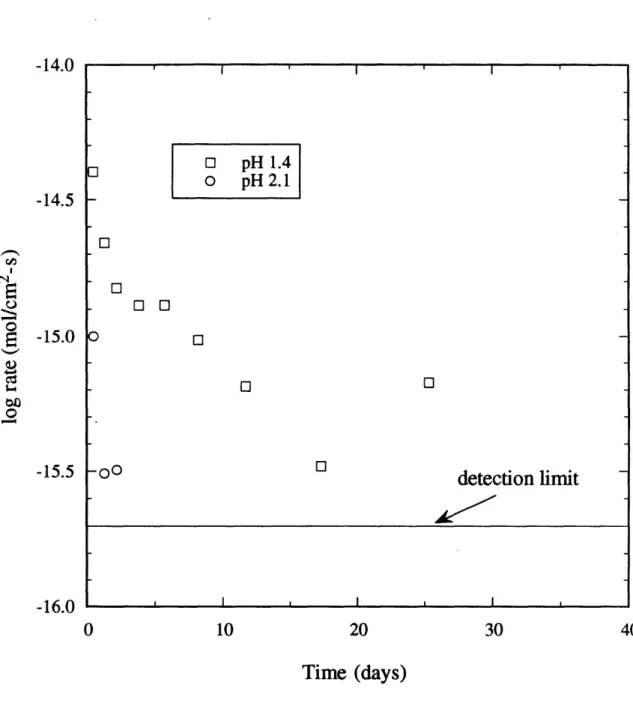
125'C (present study) ... 118 Figure 62 Long time to steady state required in deionized water at 125'C . ... 123 Figure 63 Long time to steady state required at 125'C and low pH
(present study) ... 124 Figure 64 Quartz dissolution in low pH solutions of HN03 at 175'C and
200'C (present study) ... 125 Figure 65 Quartz dissolution: The effect of added NaOH with no salts
present . ... 127 Figure 66 Quartz dissolution in deionized water at 125'C ... 131 Figure 67 A comparison between the dissolution rates of Ottawa sand and
Hot Springs, AK crystals in NaOH solutions at 1500C . ... 132 Figure 68 Quartz dissolution: The effect of OH- at constant Na+
(present study) ... 136 Figure 69 Quartz dissolution: The effect of Na+ (NaCI) at constant
OH-(present study) ... 138 Figure 6 1 0 Quartz dissolution: The effect of Na+ (Na2SO4 versus NaCl at
constant OH- (present study) . ... 141 Figure 611 Modeled log kf plotted against experimental log kf at 1500C
Figure 612 The calculation of the OH- reaction order (b) from data in NaOH
solutions from 100' to 200'C (present study) ... 148 Figure 613 The effect of ionic strength on the quartz dissolution rate in
deionized water at 200T (from Dove and Crerar, 1990) ... 150 Figure 614 The effect of KCI on the quartz dissolution rate at various m OH- at
166'C and 21 PC (from Gratz and Bird, 1993) . ... 151
Figure 615 The effect of NaCl on the dissolution rate of quartz in HCI
solutions (from Kamiya et al., 1974) ... 152 Figure 616 The apparent reaction order of OH- (b) as a function of
tem perature ... 155 Figure 617 Comparison of quartz dissolution rates from Gratz et al. 1990 at
21 PC converted to a geometric surface area basis and 200T with
the present study ... 157 Figure 618 Comparison of quartz dissolution rates from Gratz and Bird 1993)
at 166'C converted to a geometric surface area basis and 150'C
w ith the present study . ... 159 Figure 71 Composition from Run 155 (feed solution: deionized water) at
200'C as a function of tim e ... 165 Figure 72 Composition from Run 156 (feed solution: 10-4 molal NaOH at
200'C as a function of tim e ... 166 Figure 73 Scanning Electron Microscope (SEM) photographs of washed
granodiorite particles (present study) ... 169 Figure 74 Scanning Electron Microscope (SEM) photographs of reacted
granodiorite particles (present study) ... 170 Figure 74 Scanning Electron Microscope (SEM) photographs of reacted
granodiorite particles (present study) ... 171 Figure 8.1 Arrhenius plot of kf from 100' to 200'C in NaOH solutions as a
function of mOH ... 183
Figure 82 Arrhenius plot of kHI from 100' to 2000C in NaOHYNaCl
solutions assuming b is a function of temperature ... 185 Figure 83 Arrhenius plot of kHJ from 100' to 200T in NaOH/NaCl
solutions assum ing b = 0.58 ... 186 Figure 84 Arrhenius plot of kHJ from 100' to 200T in NaOH solutions at
'nOH = 7±3) x 10-3 molal assuming b is a function of
Figure 8.5 Arrhenius plot of k OH I from 100' to 2001C in NaOH solutions at
MOH-' 7±3) x 10-3 ;olal assuming b = 0.58 ... 188 Figure 86 Arrhenius plot of k OHJ from 1000 to 2000C in deionized water
solutions assuming b is a function of temperature ... 190 Figure 87 Arrhenius plot of k OHJ from 1000 to 2000C in deionized water
solutions assum ing b = 0.58 ... 191 Figure 8.8 The surface charge of amorphous silica at 25'C of Bolt 1957) as a
function of pH . ... 194 Figure 89 The surface charge of amorphous silica at 25'C of Bolt 1957) as a
function of ionic strength . ... 195 Figure 8. 10 The surface charge of quartz at 250C of Ahmed 1966) as a
function of pH . ... 199 Figure 811 The surface charge of amorphous silica at 400C of Kita et al.
(1981) as a function of pH . ... 200 Figure 812 The surface charge of amorphous silica at 25'C and 600C of
Brady 1992) and Brady and Walther 1992) as a function of pH ... 202 Figure 813 Langmuir fit of the effect of Na+ (NaCI) on 150'C quartz
dissolution rates at constant OH- (present study) . ... 206 Figure 814 Langmuir fit of the effect of Na+ (NaCI added to deionized water)
at 2000C on the quartz dissolution rate of quartz (Dove and Crerar,
1990) . ... 207 Figure 8.15 Langmuir fit of the effect of Na+ (NaCl) on 1500C quartz
dissolution rates at constant OH . ... 208 Figure 816 Langmuir fit of the effect of Na+ (Na2SO4) on 150'C quartz
dissolution rates at constant OH- (present study) . ... 210 Figure 817 Langmuir fit of the effect of OH- on 1500C quartz dissolution rates
Table 21 Apparent reaction orders for H+ and OH- dependencies on quartz
dissolution . ... 37
Table 41 Typical uncertainties in measured, estimated, and calculated parameters in the spinning basket reactor system . ... 90
Table 5.1 Experimental reactor designs and conditions from studies shown in Figures 5.3 and 5.4 . ... 93
Table 52 Mineral descriptions from studies shown in Figures 53 and 54 . ... 94
Table 53 Summary of Batch Bottle experiments (present study) ... 95
Table 54 Summary of Spinning Basket experiments (present study) ... 96
Table 5.5 Quartz dissolution rate constant data in deionized water (present study) plotted in Figures 53 and 5.4 ... 100
Table 56 Quartz dissolution rate constant data in deionized water from earlier investigations plotted in Figures 53 and 54 . ... 101
Table 56 Quartz dissolution rate constant data in deionized water from earlier investigations plotted in Figures 53 and 54 . ... 102
Table 6.1 Experimental Summary ... 117
Table 62 Experimental data investigating the effect of H+ (from HN03 on the dissolution rate of Ottawa sand . ... 119
Table 63 The effects of temperature on the pH of HNO3/H2O/H2CO3 solutions . ... 12 1 Table 64 Experimental data investigating the effect of OH- (from NaOH on the dissolution rate of Ottawa sand shown in Figure 65 . ... 128
Table 65 Experimental data at 150T investigating the effect of OH- (from NaOH) on the dissolution rate of Hot Springs, Arkansas quartz show n in Figure 6.7 ... 133
Table 66 Experimental data investigating the effect of OH- at constant Na . . ... 135
Table 67 Experimental data investigating the effect of Na+ (from NaCl on the Ottawa sand dissolution rate at constant OH- and T = 150'C show n in Figure 6.11 ... 139
Table 68 Experimental data investigating the effect of Na+ (from Na2SO4) on the Ottawa sand dissolution rate at constant OH- and T = 1500C show n in Figure 6.12 ... 140
Table 6 1 0 Apparent reaction orders for OH- dependencies on quartz
dissolution at constant ionic strength . ... 154 Table 71 Chemical composition of granodiorite used in this study ... 163 Table 72 Chemical composition of the outlet solution from the granodiorite
dissolution rate experiments at 200'C . ... 164 Table 73 Calculated steady state concentrations and run conditions for
granodiorite dissolution experiments . ... 168 Table 74 Energy Dispersive X-ray (EDX) analysis of granodiorite phases
identified in Figure 7.4 ... 172 Table 75 Estimated dissolution rates for each phase in granodiorite during
runs 155 and 156 at 200'C ... 177 Table 8.1 Previous investigations on the activation energy for
quartz dissolution . ... 182 Table 82 Previous investigations on the pH effect on the surface charge of
quartz and amorphous silica ... 197 Table 83 Previous investigations on the ionic strength effect on the surface
charge of quartz and amorphous silica ... 198 Table 10.1 Empirical constants used to calculate Henry's Law and
dissociation constants (from Maurer, 1980) . ... 222 Table 10.2 Experimental data for Batch Bottle apparatus (present study) ... 229
Chapter
Introduction
1.1 Background and Motivation
During the past 50 years, quartz dissolution kinetics and solubility measurements have been the subject of numerous investigations. Researchers have been motivated either because of their interest in understanding important natural geologic processes in the earth or because of a need to quantify dissolution rates for chemical processes above ground or for gothermal energy extraction underground using heat mining concepts. The motivation for carrying out this project was driven by engineering issues related to mineral transport in circulating hot dry rock (HDR) geothermal systems (Armstead and Tester, 1987; Charles et al., 1979; Grigsby et al., 1989; Tester et al., 1977). A schematic
diagram of a HDR system is shown in Figure 1. 1. Of critical importance to HDR is the characterization of the rate of dissolution of host reservoir rock as a function of
temperature, pressure and liquid phase composition. In general, quartz is a major mineral component in HDR reservoirs in low permeability crystalline rock. Furthermore, quartz is highly reactive relative to other constituent minerals in aqueous environments at temperatures of interest to HDR geothermal energy extraction 150' to 300'C).
More specifically, the analysis and modeling of data from HDR field tests at the Fenton Hill site in New Mexico require that dissolution kinetics be fully characterized in order to predict reservoir performances as well as to size the active reservoir on a
Hot Dry Rock (HDR) geothermal system concept. Figure 11
volumetric or areal heat sweep efficiency basis (Grigsby and Tester, 1989). Because HDR systems have small circulating fluid volumes and residence times relative to natural hydrothermal systems, dynamic changes in dissolved silica concentration can be created by switching from a normal closed-loop mode of operating to an open-loop mode. In the closed-loop mode with a modest flow of make-up water, silica concentrations approach saturation because of recirculation effects. This permits the use of geothermometry to estimate reservoir temperatures Fournier and Rowe, 1966). In the open-loop mode, however, fresh water with a low dissolved silica concentration can be flushed through the system. In this case the transport rate of silica into the reservoir fluid can be used as a chemical tracer to aid in estimating the size of the active heat transfer volume and area of the reservoir (Grigsby and Tester, 1989; Robinson et al., 1988
After a careful review of the available literature on this subject, we quickly realized that while a great amount of work had been done with quartz, results from one research group were rarely if ever compared with another group's data. Furthermore, there have been only a few investigators who even attempted to correlate their data in a systematic manner. Over the last 15 years the situation has improved with respect to experimental procedures and equipment used along with a much improved appreciation for the importance of surface preparation and characterization. These factors have all contributed to enhancing the quality of the data. However, almost without exception, even recent investigators have not compared or correlated their rate data with others on a fully quantitative basis.
The ability to predict rock-water reactions is' needed in many other fields involving the en vironment, including nuclear and chemical waste migration (Brookins,
1984; Roxburgh, 1987), acid mine drainage (Jaynes et al. 1984), and retorted oil shale leaching eerer et aL, 1986). Before these multi-phase systems can be modeled, the dissolution behavior of each mineral must be understood. Unfortunately, to date, the
reactivity of minerals in natural environments cannot be predicted from reported laboratory dissolution rates. For instance, the silica release rates from sodic feldspar observed in nature are one to three orders of magnitude slower than would be predicted from experimental data (Paces, 1973, 1983; Velbel, 1985, 1989; Swoboda-Colberg and Drever, 1992). This discrepancy has yet to be explained based on the current knowledge of mineral dissolution kinetics. Until we understand the fundamental mechanisms
governing mineral dissolution, predictions made on the basis of laboratory data alone will be unreliable. Of particular importance, for example, is the influence of pH on the kinetic pathways for quartz dissolution.
1.2 Organizational Overview
Chapter 2 is a comprehensive literature review of the previous work on the dissolution kinetics and mechanisms of mineral-water systems. Chapter 3 lists the objectives in carrying out this study. Chapter 4 describes the experimental techniques used in this project with comparison to previous experimental techniques. Chapter 4 is divided into six sections: mineral selection, mineral surface preparation, mineral surface characterization, reactor design, solution composition analysis, and data reduction propagation of error. Chapter presents the current study of quartz dissolution in deionized water and correlates it with previous studies from the literature. Chapter 6 covers the experimental studies of the pH and ionic strength effects on quartz dissolution. Chapter 7 presents the experimental studies on granite dissolution. Comparisons are made between quartz dissolution rates and the rates of Si release from the quartz phase in granite, measured as silicic acid [H4SiO4 or Si(OH)41 in solution. Chapter introduces the modeling techniques used in this study to explain the observed quartz dissolution rates and dependencies. Chapter 9 lists the major conclusions derived from this study.
Chapter 2
Review of PreviousWork on
Mineral Dissolution
2.1 Experimental Results
Traditionally, investigators gather mineral dissolution rate data by measuring the solution concentration versus time in a batch reactor or by measuring the inlet and outlet concentrations in flow reactors. The mathematics behind these approaches are shown in
Section 44. 1. Alternatively, at high temperature, a weight loss method can be used to determine how much of the mineral dissolved during the course of the experiment.
A new approach to obtaining dissolution rate kinetics was performed by Gratz and coworkers (Gratz et al., 1990; Gratz and Bird, 1993) by utilizing a "negative crystal" method. The "negative crystal" is actually a flat-bottomed etch pit with smooth crystallographic walls. Other types of etch pits were observed on the quartz surface, however their complex inner structure made analysis difficult. Instead of focusing on the transfer of material to solution, they look at the changing local topography of "negative crystals". Dissolution rates are obtained by measuring the retreat rate of the "negative crystal" walls using an optical microscope. "Negative crystals" were measured on
reflected light photographs at 240x (and higher) magnification taken after sequential runs. The "negative crystal" method has several limitations. The conditions studied must produce "negative crystals" that can be easily characterized. Gratz et al. 1990)
found that high, ionic strengths > 0.01 molal) produced "jumbo pits, etch tunnels, and a few, unusually large small pits", and low ionic strengths <0.005 molal) produced
abundant smaller pits attributed to dislocations, which interfere with the measurements of negative crystal growth. In order to yield good results, growth rates should be between 0.02 and 10 gm/hr. The lower limit is a result of time limitations, the wavelength of light, and the optics of photomicrography, while the upper limit is due to the desire to keep the heat up time short relative to the run time.
The experimental results of previous investigations on mineral dissolution kinetics are summarized in the following four sections.
2.1.1 Temperature Effects
Temperature effects on the dissolution rate of quartz (SiO2) have been studied by many investigators (Bennett, 1991; Brady and Walther, 1990; Dove and Crerar, 1990; Rimstidt and Bames, 1980; Siebert et al., 1963). Typically, data can be correlated with an Arrhenius-like expression for the global rate constant. Siebert et al. 1963) reported a global activation energy of 79 U/mol for quartz dissolution from 2050 to 3450C.
(1 U/mol = 0239 kcal/mol). Dove and Crerar 1990) and Rimstidt and Barnes 1980) reported consistent values of 71 ± 9 Uftol and 67-77 U/mol, respectively, from 100 to 3000C. Brady and Walther 1990) found that activation energies varied as a function of pH from 25' to 60T. They reported activation energies from 46 U/mol at pH 6 to 96 U/mol at pH L Bennett 1991) reported an activation energy of 73 U/mol from 250 to 700C. Gratz and Bird 1993) calculated an activation energy of 87 U/mol using the
it negative crystal" method in 0.01 molal KOH solutions from 106' to 2360C. The activation energy for quartz dissolution provides some insight into the mechanism governing the dissolution process. For example, the high reported activation energies indicate that diffusion is not the rate limiting step, thus negating any theories
proposing rate laws based on diffusion through a surface layer (see Section 22. 1). The significance of the activation energy is discussed further in Section 5.5. 1.
2.1.2 pH Effects
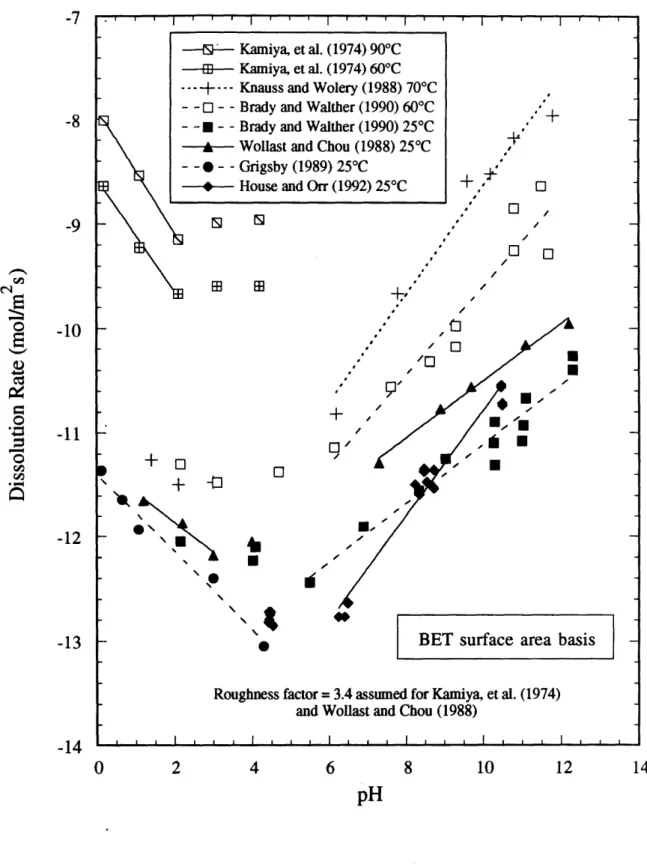
The solution pH has been shown to have a dramatic effect on the dissolution rate of quartz. Figure 21 displays this effect by plotting the logarithm of the dissolution rate constant (see Section 22.2 for definition of kf) versus pH. Dissolution rate constants derived from literature data at a single pH were not plotted in Figure 2 1, since variations between literature values can mask the true effect of pH. Wollast and Chou 1986), Knauss and Wolery 1988), and Brady and Walther 1990) show that the quartz dissolution rate is enhanced by raising the pH above approximately pH 5. The data of Kamiya et A 1974) suggest that the quartz dissolution rate is enhanced by lowering the pH below 2 while the data of Grigsby 1989) suggest that the quartz dissolution rate is enhanced by lowering the pH below 4 The data of Wollast and Chou 1986), Knauss and Wolery 1988), and Brady and Walther 1990) also shows a small pH dependency at low pH, however the magnitude of the effect is on the same order as the experimental error in the data., When the logarithm of the dissolution rate is plotted against solution pH, linear regions are observed at low pH and at high pH with a slope less than unity This observation has resulted in the concept of fractional order kinetics discussed in Section 22.3.
2.1.3 Ionic Strength Effects
Dove and Crerar (I 990) performed quartz dissolution experiments in to 0. 15 molal (mol/kg H20) solutions of NaCl, KCI, LiCl, M902, and found that in all cases the presence of electrolyte increased the rate above the values measured in deionized water. The effect was greatest for NaCl and KCI where reaction rates increased by as much as
. . . - - -
-BET surface area basis
j . . I , , , I . . . I , I , I I , , I I I I I _ j .
-I
-7
Kamiya, et al. 1974) 900C
E9 Kamiya, et al. 1974) 600C ... . ... Knauss and Wolery 1988) 700C - - - - Brady and Walther 1990) 60'C
- - - - Brady and Walther 1990) 250C a Wollast and Chou 1988) 251C - - - - Grigsby 1989) 251C
4 House and Off 1992) 250C -8 -9 r-1
0
rA N E ;:40
E0
CZ 040
I'll :Z40
CA CA . -4 C -10 -11V
.11 11-110' m " .1 I di "I 0 C 00
. 4k 4 \ N P -12 -13 410
\
0
40Roughness factor = 34 assmmed for Kamiya, et al. 1974) and Wollast and Chou 1988)
-14
10 12 14
0 2 4 6 8
pH
the previous section should be re-evaluated in terms of a more comprehensive mechanism. Figure 21 presents data from widely varying experimental procedures. Some of the experiments are performed at constant ionic strengths, some control pH using variable ionic strength buffers, while others simply add acids or bases to adjust pH. Rigorous comparison of the data presented in Figure 21 requires the knowledge of the electrolyte concentration effects on quartz dissolution. This topic will be discussed further in Section 65.
2.1.4 Dislocation Density Effects
The observation of etch pit formation on dissolving minerals led several research groups to propose the hypothesis that dissolution is controlled by reaction at discrete sites on exposed mineral surfaces Berner and Holdren, 1979; Holdren and Berner, 1979; Brantley et A, 1986). Helgeson et A 1984) suggest that the active site area should be used to normalize bulk dissolution rates. Petrovich (I 98 1) states that dislocation outcrops and kink sites are probable candidates for active sites. However, recent published work shows that dissolution rate is only mildly affected by dislocation density (Casey et A,
1988a; Cygan et A, 1989; Schott et A, 1989; Blum et A, 1990). Cygan et A 1989) explosively shocked labradorite, oligoclase, and homblende, causing the dislocation densities to increase by about three orders of magnitude. Shock-loading the minerals increased labradorite and horneblende dissolution by a factor of 4, while oligoclase was enhanced by a factor of 13. Cygan et A 1989) also found that annealing the shocked labradorite at 920'C for I hour did not result in a significant change in the dissolution rate. Blum et aL 1990) did not observe a change in the dissolution rate of synthetic quartz while the dislocation density varied by six orders of magnitude. These results
dissolution or that only a small portion of the dislocations produced by shock-loading are suitable for etch pit development.
2.2 Dissolution Kinetics Modeling
2.2.1 Parabolic Rate LawThe fundamental mechanisms of rock-water dissolution are currently unknown, and this lack of knowledge has led to frequent misinterpretations of experimental data. As recently as 198 1, dissolution rate data were fit using the empirical equation
dQ = kn t (2.1)
dt
where Q is the moles transferred per unit area (mol/m') which is a function of time, t (s), and kn is the dissolution rate constant mol/m2sn+l). n is for linear kinetics, 1/2 for parabolic kinetics, and 1 for logarithmic kinetics. These terms originate from the shape of the concentration versus time data from a batch reactor. Many researchers found that mineral dissolution data were consistent with parabolic kinetics on quartz (Clelland et aL,
1952; St6ber and Anold, 196 1) and feldspars (Helgeson, 197 1; Luce et aL, 1972; Grandstaff, 1977; White and Claassen, 1979; Lahann and Roberson, 1980; Lin and Clemency, 198 1). The rate limiting step for feldspar dissolution was hypothesized to be diffusion through a surface layer, apparently explaining the parabolic behavior
(Busenburg and Clemency, 1976; Helgeson, 197 1; Helgeson et aL, 1970; Paces, 1973; White and Claassen, 1979; Wollast, 1967).
Feldspar crystals consist of networks (as opposed to chains or sheets) of SiO4 tetrahedra with A3 substituting for Si+4 in some of the tetrahedra. Since Al only has a +3 charge, another cation, usually Na+, K, or Ca+2' is required to maintain
Chemical fon-nulas of the feldspars are usually written on the basis of oxygens, and almost all natural feldspars, fall in the ternary system,
NaAlSi3O8--KAISi3O8--CaAl2Si2O8. Parabolic kinetics could result from either diffusion across a progressively thickening, leached layer within the silicate phase (Paces, 1973), or across a growing precipitate layer forming on the silicate surface (Correns and von Engelhardt, 1938; Wollast, 1967). A leached layer could be formed if either Al or Si preferentially
dissolved from the feldspar lattice.
The parabolic behavior of dissolution rates cannot be explained solely by the leached layer theory and is more likely a result of the effects of surface preparation. Mineral particles are typically ground to small particle sizes to increase exposed surface areas, and therefore increase reaction rates. The grinding process creates sub-micron particles (fines) that adhere to the mineral surface (Holdren and Berner, 1979; Petrovich, 198 1), thus increasing the mineral surface area. However, as the fines are removed during the course of an experiment, reaction rates fall off to the bulk mineral values, producing the observed parabolic-like concentration versus time behavior. Some of the fines may have a small enough radii of curvature (of the order 0. 1 gm or less) that surface energy effects could significantly raise their equilibrium solubility due to a
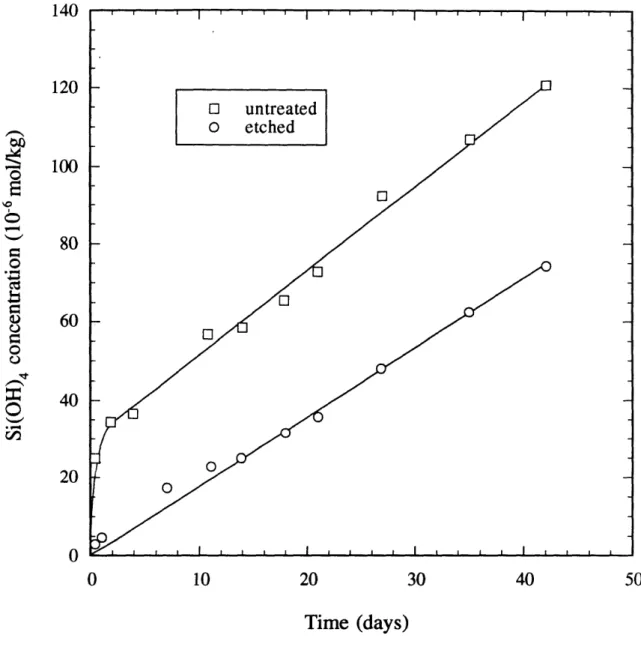
Gibbs-Thompson effect (Iler, 1979). This surface energy effect should also increase the dissolution rate constant, kf, if the principle of detailed balancing is valid [see Equation (2.7)]. If the fines adhered to the mineral surface are removed prior to the dissolution experiments, linear kinetics are observed (Holdren and Berner, 1979; Petrovich, 198 1). The albite (NaAlSi3O8) dissolution rate data of Holdren and Berner 1979) for untreated and pretreated samples are presented in Figure 22. Parabolic kinetics are observed on the untreated albite, while the albite pretreated (etched) with 5% HF 0 N H2SO4 for 20 minutes displays linear kinetics throughout the experiment. Surface preparation
140 120
/-I
OD ez0
E C) P-4 1-11 0 I'= CZb
U Q0
Q ,It 11-\x
C
C'n 100 80 60 40 20 0 0 10 20 30 40 50Time (days)
Figure 22
Effect of surface chendcal etching on the dissolution behavior of albite(data from Holdren and Berner 1979) using 5% HF 009 N H2SO4 for 20 minutes).
2.2.2 Global Rate Equation
In order to fully appreciate the manner in which dissolution rate data are
correlated, several basic thermodynamic and kinetic issues germane to the quartz-water system are worthy of discussion. Quartz dissolves congruently via a global hydrolysis pathway to form silicic acid, H4SiO4, or in its chemically equivalent form Si(OH)4 (Her,
1955,1979).
SiO2(s) + 2H20(aq) # H4SiO4 (aq) or Si(OH)4 aq) (2.2)
One postulates that reaction 2.2) is fully reversible; and that the forward reaction rate (dissolution), rf (mol/kg-s), is proportional to the active surface area, As (M2), divided by the mass of water, Mw (kg), in the system,
rf = kf As (2.3)
MW
and based on the simple principle of collision theory, the reverse reaction rate
(precipitation), rr (mol/kg-s), is linearly proportional to the product of the concentration of H4SiO4 in molality units (moles SiO4 / kg H20), MH4SiO4 , and the surface area to mass of water rtio,
As (2.4)
rr = kr jW- MH4SiO4
Strictly speaking we should define mH4sj04 as moles SiO4 / kg solution, however, for the ionic strengths used in this study, the difference is insignificant. The units for kf and
k, are mol/m2
s and
kg/m2s, respectively. The net rate of change obtained byOf MH4SiO is
subtracting Equation 2.4) from Equation 2.3),
dm
H4SiO4 As
rnet dt f f - rr = (kf - k, mH4SiO4) (2.5)
MW
At equilibrium, the forward reaction rate is exactly balanced by the reverse reaction rate, thus keeping the H4SiO4 concentration constant at its saturation value corresponding to the solubility of quartz in water at a particular temperature, pressure, pH, etc.
req = rf - rr = = kf - k, sat (2.6)
net MH4SiO4
Equation 2.6) comes directly from the principle of detailed balancing, which can be derived from the more fundamental concept of microscopic reversibility first formulated by Tolman 1924), extending ideas introduced earlier by de Donder and Nernst. More specific to systems of interest in this study, Lasaga (I 98 1) reviewed applications of detailed balancing as applied to geochernical systems.
Solving for k, in Equation 2.6) reveals the strength of the detailed balancing concept; the ability to predict the reverse rate constant from the forward or vice versa. For this case, the equilibrium or saturation conditions must also be known:
kr = kf / Msat (2.7)
H4SiO4
Substituting Equation 2.7) into Equation 2.5) yields an empirical rate equation which can be used to correlate experimental quartz dissolution rates in pure water obtained in
different laboratories over a range of operating conditions (temperature, As, and Mw, for example):
dMH4SiO4 A sat
rnet
dt
kf ' I - MH4SiO4 / MH4SiO4(2.8a)
MW
or equivalently using Equation 2.7)
dm H4SiO4 As 1( sat
rnet dt - k \ H4SiO4 MH4SiO4
(2.8b)
The calculation of rnet from rate experiments is demonstrated in Section 44. 1. The term ( - m / sat ) in Equation (2.8a) can be viewed as the degree of
H4SiO4 k14Si04
undersaturation. For dissolution, the term is positive, for precipitation it becomes negative, and at saturation it goes to zero. When mH4&04- 0, rn,,t is maximized under "free dissolution" conditions, analogous to the evaporation of a solid or liquid into a perfect vacuum. O'Connor and Greenberg 1958) derived a similar equation based on a phenomenological approach. This empirical form of the rate equation has been
successfully used by us and a large number of previous investigators over a wide temperature range 25 to 625'C) and from silicic acid concentrations from near zero to concentrations approaching the saturation value (O'Connor and Greenberg, 1958; van Lier et A, 1960; Tester et A, 1977; Rimstidt and Bames, 1980; Robinson, 1982 and others). Equation (2.8a) is essentially equivalent to Equation 33) in Rimstidt and Bames (1980), except that the rate laws derived here are based on concentration instead of activities, therefore, from Equation 2.7), kf nsat H4S 4 which is not necessarily
the forward dissolution rate is constant when the active surface area per unit fluid mass and other factors that influence kf like temperature, pH, and ionic strength are fixed. The forward rate is assumed independent of the silica concentration in the surrounding bulk solution (mH4SiO4 ). The forward rate law could have also been inferred from the reverse rate law coupled with the equilibrium conditions in Equation 2.7).
The limitations of the model embodied by Equations (2.8a) and (2.8b) must be stated clearly. First, an oversimplified view of the dissolution rate process was taken [Equation 2.2)] without any attempt to model molecular level phenomena such as the bond-breaking steps that must occur for quartz to enter the aqueous phase as silicic acid. Since the principle of detailed balancing only rigorously applies to elementary steps, the validity of Equation 2.8) should be examined more closely. Consider a general
mechanism of the type
k, k2
A # B # C (2.9)
k-1 k_2
At equilibrium one can write (see Laidler, 1965)
IC] k1k2 (2.10)
[Al eq klk-2
where [ i ] is the concentration of species i. If one makes measurements of the rate of disappearance of A at the very beginning of the reaction, before any or' C have accumulated,
k [A] (2.11)
and the first order rate constant is kI. Similarly if one starts with pure C and measures initial rates, the rate constant obtained is k-2. The ratio k / k-2 is not equal to the equilibrium constant based on the overall reaction A z_2 C shown in Equation 2 10) unless, quite fortuitously, k2 / k I = 1. This example highlights a potential problem when detailed balancing is applied to an overall reaction. In this example, if k-2 i calculated
from the equilibrium constant and an experimentally derived ki, the result would be incorrect. Although this idealized example may raise concern about the applicability of Equation 2.7) in a global mechanism for quartz dissolution, frequently complex
elementary reaction networks are dominated by a single rate limiting step which, for the case of quartz dissolution, may be adequately described by Equations 2.3) and 2.4).
Furthermore, Equations 2.3) and 2.4) are assumed rate laws with many dependencies embedded in the global rate constants (e.g. temperature, pressure, pH, ionic strength, etc.). With more detailed experimental data, individual parameter dependencies can be separated and stated explicitly, yielding a more comprehensive empirical model..
Although the derivation of Equation 2.8) does not require a molecular-level, mechanistic description of the quartz dissolution mechanism, other investigators have employed the concepts of transition state theory to justify the form of a global rate expression for quartz dissolution (Rimstidt and Barnes, 1980; Brady and Walther, 1990; Dove and Crerar, 1990). While these approaches represent noteworthy extensions of transition state theory to heterogeneous (solid-liquid) geochemical kinetic systems, they do not identify rate-controlling elementary reaction steps at a molecular level. Recent
treatments by Lasaga and Gibbs 1990) and Casey et al. 1990), using ab initio molecular orbital calculations, provide a more theoretically rigorous representation of possible transition state activated complexes. However, without direct evidence of activated
complex structure in this heterogeneous system, a heuristic empirical approach is justified and can be useful in correlating dissolution rate data over a wide temperature range.
An estimate of sat "'H4SiO4 s. needed as a function of temperature and pressure in the
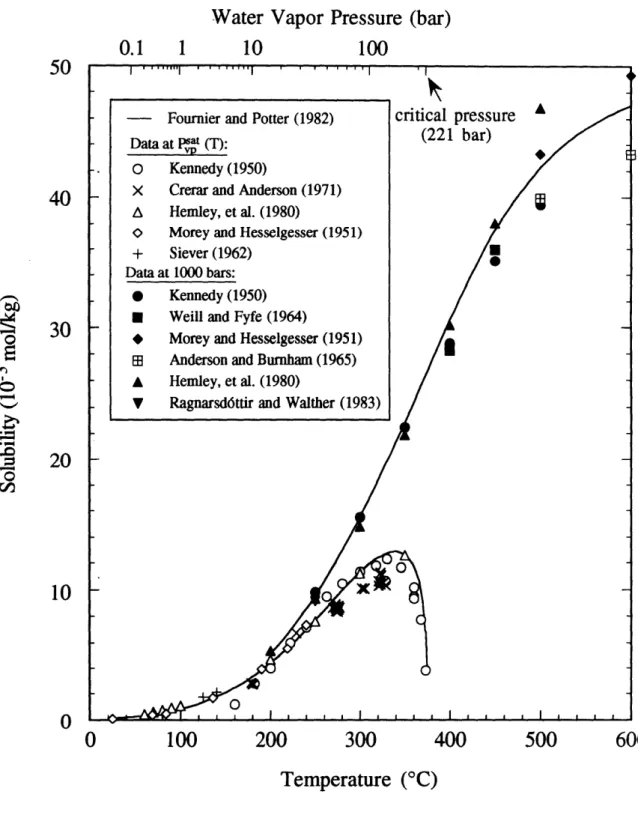
two-component, binary mixture of quartz (SiO2) and water (H20) in order to extract a rate constant for dissolution (kf). Fournier and Potter 1982) provide an excellent correlation for quartz solubility. Figure 23 compares their solubility correlation at the vapor pressure of the solution and at 1000 bar with experimental data from several
investigators (Crerar and Anderson, 197 1; Hernley et al., 1980; Kennedy, 1950; Morey et al., 1962; Ragndrsd6ttir and Walther, 1983; Siever, 1962). Data are given from 25'C to
the critical point of pure water at 374'C on the saturation curve, while they extend to 600'C at 1000 bar. The vapor pressure of pure water up to the critical point (3740C, 221 bar) is shown on the upper abscissa for reference.
The Fournier and Potter 1982) correlation for quartz solubility used in our data analysis is as follows:
log sat C1 + C2009 V ) + C3009 V) 2 (2.12)
MH4SiO4
where Ci, C2, and C3 are empirical temperature-dependent constants that have been fit to sat
data, MH4 SiO4 is the saturated molal silica concentration (mol/kg H20), and V is the specific volume -of pure water (cm3/g). The CI, C2, and C3 parameters are given by
C = - 466206 00034063 T + 2179.7 T-1 - 1 1292 x 106 T-2 + 13543 x 108 T-3
C = - .00 14180 T - 806.97
T-C = 39465 x 10-4 T
Water Vapor Pressure (bar)
0.1 I 10 10050
40
- - T- I I - ' I I . I I I I I I I 4k
Fournier and Potter 1982) critical pressure A
Data at Psat (T): (221 bar)
VD
* Kennedy(1950)
* Crerar and Anderson 1971) * Hemley, et al. 1980)
* Morey and Hesselgesser 1951) * Siever 1962)
Data at 1000 bars:
* Kennedy(1950)
* Weill and yfe 1964)
Morey and Hesselgesser (I 95 1)
EB Anderson and Burnham 1965)
* Hemley, et al. 1980)
* Ragnarsd6ttir and Walther 1983)
16 0 a I . . . . I I . . . I , . j I 3
E
9
C?0
r--4 1-1 i>" .,..4 t 0 (A 3020
100
0
100200
300400
500
600
Temperature (Q
Figure 23
Solubility of quartz in pure water at the saturated solution vapor pressure and at 1000 bar.The Fournier and Potter 1982) correlation predicts a sat value of 12 x 1-4
MH4SiO4
at 25'C, since they used Morey and Hesselgesser's 1951) value of 1.0 x 10⁻⁴ in their sat
regression. However, Rimstidt 1984) predicts a MH4SiO4 value of 1.8 x 10⁻⁴ based on the extrapolation of his data from 50' to 96T. Due to the extremely slow rates at 25T it
may be more accurate extrapolatin 9 MH4SiO4sat rather than measuring its value. Therefore, the value used in this study may be 40% low. However, since the degree of
undersaturation term in Equation (2.8a) is very close to one in most low temperature studies, uncertainty in the sat alue has a very small impact on the eror in kf.
MH4SiO4 V
2.2.3 Fractional Order Kinetics
Many researchers have observed a significant effect of solution pH on the dissolution rate of quartz. Typically, the logarithm of the dissolution rate is plotted versus pH as in Figure 2 1. The rate data are regressed by dividing the data into three pH regions. Least squares linear fits are used in the low and high pH regions, and a line of zero slope is regressed through the appropriate pH-independent points. The three pH regions, low pH, pH independent, and high pH, can also be termed, acid- (or proton-),
water- (or neutral-), and base- (or hydroxide-) catalyzed regions, respectively. In some cases, there is not enough evidence of a pH dependency at low pH, so the
pH-independent line is extended into the low pH region. The overall rate law obtained by superimposing the rates for each region is:
r = ka[aH+ ]a + kw + k [aoH- ]b (2.13)
where a is the negative of the slope in the acid-catalyzed region (or the global reaction order with respect to H), b is the slope in the base-catalyzed region (or the global
based on activities since they are derived from a regression of log rate versus pH. A more traditional approach would be to define the orders based on the concentration of H and OH- ions in solution. However, since activity coefficients in typical solutions for quartz dissolution experiments are not far from unity, the values of a and b will be similar regardless of the basis.
Regressing the low and high pH regions of the data shown in Figure 2 1, values of the apparent reaction orders, a and b, are obtained and listed in Table 2 1. The term "fractional order kinetics" is frequently used to describe experimental observations. When Equation 2.13) is applied to actual mineral dissolution rate data, apparent reaction orders for H+ and/or OH- dependencies of less than unity are calculated as given in Table 2. 1. Clearly Equation 2.13) is an empirical rate expression which does not represent a single elementary reaction, since the reaction order is not an integral value. The results in Table 21 suggest that a and b increase with increasing temperature, although the size of the error bars diminish the significance of this trend. he large error bars at low pH occur since most low pH experiments are conducted over a limited range from about pH I to 3 If only three data points are taken (as in Kamiya et al. 1974) and Wollast and Chou 1988)), the standard deviation of the slope must be multiplied by 12.7 to obtain the
95% confidence limit. The effect of pH on the quartz dissolution rate will be discussed further in Section 82.
2.3 Mechanistic Modeling
2.3.1 Surface Complexation ModelsTypically, experimentalists measure and correlate mineral dissolution rates as a function of pH, ionic strength, and temperature. However, this approach results in an empirical rate expression which contains no information about the molecular processes
Temp
(Q
a t
bt
Wollast and Chou 1988) 25 0.29 (-+0.60) 0.27 (-+0.05)
Grigsby 1989) 25 0.38 (-+0.11)
-Brady and Walther 1990) 25 - 0.29 (-+0.05)
Kamiya et A 1974) 60 0.54 (+-0.75)
-Brady and Walther 1990) 60 - 0.43 (-+0.13)
Knauss and Wolery 1988) 70 - 0.52 (-+0.13)
Kamiya et A ( 974) 90 0.60 (+-0.08)
-Table 2.1 Apparent reaction orders for H+ and OH- dependencies on quartz dissolution.
kinetics result from the global regression of experimental mineral dissolution rate data versus solution pH. Fleming 1986) suggests that solution pH may not be the appropriate parameter. Because dissolution actually occurs at the solid surface, the activity of H or
OH- near the surface should be more important than the bulk values given by pH or pH. The H+ and OH - ions near the surface (H + and OH -) are assumed to be in equilibrium0 0 with the surface, which is represented by SOH:
H + + SOH 0 S-OH+ 2 (2.14 a)
OH -0 SOH S-0- H20 (2.14b)
which esults in the following equilibrium relations:
(S-OH+]2
KH = CS-OH] aH (2.15a)
[S-O-]
KOH = OH a (2.15b)
OH;
where [ i ] refers to the concentration of surface species i, and ai refers to the activity of the solution species i, and Ki is the adsorption equilibrium coefficient of species i. Fleming 1986) expresses the surface species in terms of concentration by assuming that the activity coefficient of surface species are approximately equal to unity. Thus, if dissolution is catalyzed by H + or OH -, it must have the same dependency on surface0 0
The major problem now is to develop a model of solid-liquid interface and to relate the activity of the species near the surface to the bulk activities. Many approaches have been utilized to model the oxide-aqueous solution interface. Westall and Hohl (1980) describe five classes of electric double layer models:
(1) the constant capacitance model (2) the diffuse layer model
(3) the Stem model as interpreted by Bowden, Posner, and Quirk 1977) (4) the triple layer model
(5) a literal interpretation of the Stem model
These models contain varying degrees of complexity, with the more complex models having more adjustable parameters. For example, the triple layer model contains eight adjustable parameters with two of the parameters being measurable from independent experiments. ne robustness of these models has been questioned in literature (Sposito,
1983; Westall. and Hohl, 1980). Westall and Hohl 1980) found that al models represent the data equally well, but the corresponding parameters in different models are not the same. They conclude that although the models are of the correct mathematical form to fit experimental data, the do not necessarily provide an accurate physical description of the interface. Fortunately, we are not dependent on these models since quartz and silica surface data at 25'C are abundant in literature. An analysis of literature surface charge data can be found in Section 83. 1.
Several researchers have studied mineral dissolution rates as a function of surface charge (Brady and Walther, 1989; Blum and Lasaga, 1988; Stumm et aL, 1985; Wirth and Gieskes, 1979). Brady and Walther 1989) found that the rate of quartz dissolution
was fst order with respect to surface charge from pH to 12, by plotting the log (dissolution rate) versus log (surface charge). The resulting slope or order of reaction was 1.0 ± 0.3 95% confidence). Since log-log plots are sometimes deceptive, their
dissolution rate data are plotted.in Figure 24 against surface charge. A straight line through the origin gives a reasonable fit to the data implying that the rate is directly proportional to the surface charge. Wirth and Gieskes 1979) studied the dissolution kinetics of vitreous silica at three different ionic strengths. They claimed that their data
displayed second order behavior at low surface charges (pH 6 to 9 using an empirical fit of the surface charge data of Bolt 1957). Fleming 1986) developed a thermodynamic model that used the surface charge data of Bolt 1957) to fit the values of the unknown parameters in the model. With this model, Fleming 1986) analyzed Wirth and Gieskes' data 1979) and arrived at a first order dependency on surface charge. The surface charge of quartz and amorphous silica is very low at pH 6 The model used to fit the Bolt 1957) data becomes very important in determining the apparent reaction order of the surface charge.
Stumm et aL 1985) proposed the following dissolution rate law for A1203 and BeO in slightly acidic solutions (pH = 25 to 6:
rate = k [ SOH +,n (2.16)
2
where SOH+ is the surface charge, and n is the charge on the cation 2 for Be+2 and 32 for AI+3). A mechanistic explanation for this relationship was not proposed.
Carroll-Webb and Walther 1988) also studied the dissolution rate Of A1203 as a function of surface charge, and they obtained n in the acidic range (pH = I to 8) to be about . This large discrepancy for the value of n in Equation 2.16) emphasizes the uncertainty involved in its calculation, and the need for accurate surface charge and dissolution rate
20 15 11-1 rn N E ;::z
0
E N 1-4 6 r"I-,
ct 040
I=0
(A.4
a
10 5 n W -0.0 0.5 1.0 1.5 2.0 2.5Surface Charge
(I 0 I I Sio-/M2)Figure 24
Influence of surface charge on the quartz dissolution rate (from Brady and Walther, 1989).2.3.2 Transition State Theory
Transition-state theory (TST) (Evans and Polanyi, 1935; Eyring, 1935; Glasstone, 1941) has been recently utilized in an attempt to model the fundamental mechanisms of mineral dissolution (Aargaard and HeIgeson, 1982; Helgeson et a, 1984; Rimstidt and Bames, 1980). TST was proposed for a priori determination of absolute reaction rates. This is difficult in principle, since accurate potential energy surfaces are not usually known. Figure 25 shows a hypothetical potential energy surface for the reaction
AB+C - ABC
(2.17)
TST asserts that along the minimum energy path from reactants to products, there exists an activated complex or transition state, [ABC]4:, represented by an X in Figure 25. TST assumes that the reactants are in equilibrium with the activated complex, and that the forward reaction rate equals the product of the concentration and decomposition frequency of the activated complex (rate = v [ABC]4' '). The activated complex concentration can be determined by the equilibrium relation,
K4 -(ABCI+ 'YABC_ (2.18)
JABJJC - yAByc [AB][C]
where K:- is the, constant for the reactant activated complex equilibrium, I i , Yj, and i refer to the activity, activity coefficient, and concentration of species i, respectively. With the assumptions above, the reaction rate can now be put in terms of the reactant concentrations:
Potential Energy rgy path RA-B I IL 0. % RB-C AI + C
A+BC
A+B+C
rate = v [ABC] = K+ [AB] [C] (2.19)
YABC
where v is the unimolecular decomposition frequency of the activated complex, +. Using standard thermodynamic conventions, K+ is equal to exp(-AG:/RT), where AG: is the free-energy difference between activated complex and reactants in their appropriate standard states. v is equal to kBTIh, where kB is Boltzmann's constant, Tis absolute temperature, and h is Planck's constant. Since GI- = AH - T SI--, Equation 2.19) can be rewritten as:
rate _- kB T AB 7C As+: -AH+ B] [C] (2.20)
h YABC uA'I R uAIJ RT [A
where MO and AS4-' are the enthalpy and entropy difference between the activated complex and the reactants. Thus, a priod calculation of AH4: and Ae requires the knowledge of the nature and structure of the activated complex and reactants. With the proper structural information, the enthalpies or entropies of formation can be estimated using ab initio quantum mechanical calculations or by empirical approaches such as group additivity- methods. Lasaga (I 98 lb) provides a complete description of TST and its applications to geological systems.
Rimstidt and Barnes 1980) applied TST to the overall reaction for quartz dissolution with a hypothesized and somewhat unrealistic reaction mechanism:
Solid SiO2 cannot be treated like a free gaseous molecule as is frequently the case for TST applications (Eyring, 1935; Glasstone, 1941; Laidler, 1965). SiO2(s) corresponds to the molecular composition of quartz, which is actually composed of a network of SiO4 tetrahedra. The release of Si into solution must be modeled as a set of elementary
reactions or simplified using the rate-limiting step. However, Rimstidt and Bames 1980) selected an activated complex (+) to represent the overall global reaction, which
according to the authors, was done "to simplify further calculations." Consequently, their approach does not model the actual reaction pathway or mechanism of dissolution. When applied in this manner, the TST model is merely a convenient way of
quantitatively representing dissolution rates, and is no more mechanistically rigorous than previous empirical rate laws (see Section 22.2).
Aargaarq and Helgeson 1982) attempted to hypothesize realistic activated complexes by applying TST to feldspar dissolution kinetics. They postulated a low and an inten-nediate pH complex and Helgeson et A 1984) added a high pH complex:
• low pH < 29) : (H30)AISi3O8(H30)+
• intermediate pH 2.9 to 8) (H30)AISi3O8(H20)n
high pH > 8) [(KNa)AI(OH)nSi3O8]-'l
where, according to Helgeson et A 1984), n "represents the number of moles of interstitial H20 dipoles or hydroxyl ions in the surface configuration of atoms corresponding to the activated complex per mole of reactive feldspar."
With the above selection of reaction intermediates, the general rate law proposed by Aargaard and Helgeson 1982 is
A
where k, in mol/cm2s, is the dissolution rate constant composed of several parameters to account for non-ideal behavior and TST concepts, ai is the activity of the ith species
A
(dimensionless), and ni is the stoichiometric coefficient of reactant i in equilibrium with the activated complex (dimensionless and negative). Equation 2.22) is a simplified version of Equation 2.19), lumping the decomposition frequency, activity coefficients, and 0 into k, while allowing for complex stoichiometries in the activated complex. Helgeson et A 1984) set n in the high pH (pH A) complex to 04 to fit the available rate data. They state that n = 04 (or n'0H = 0.4) results in the following rate equation,
0.4
rate = k aH- (2.23)
where k' is k from Equation 2.22) multiplied by the activity of the feldspar surface to the 0.4 power. By using n = 04 they imply that there are 04 hydroxyl ions for every one feldspar unit in the high pH activated complex. Since only whole hydroxyl ions can interact with surface species, Equation 2.23) should be viewed as an empirical global rate equation whose parameters were simply fit to the available rate data.
Although TST is founded on fundamental principles developed by early scientists (Evans and Polanyi, 1935; Eyring, 1935; Glasstone, 1941), its application in geochemical kinetics so far has largely been used as a empirical regression tool.
2.3.3 Monte Carlo Simulation
Monte Carlo simulations have been used for many years to model the reactions that occur on crystal surfaces. Burton et aL 195 1) first used the Ising 1925) model in
their theory of crystal growth. Gilmer and Bennema 1972) proposed a "kinetic Ising model" adapted for use in Monte Carlo simulations. Typically, the surface is modeled as a cubic lattice using the "Kossel" or "solid on solid" (SOS) rule (MUller-Krumbhaar,
are (1) adatorn, 2) ledge, 3) kink, 4) step, (5) face, which are bonded to 1 2 3 4 and adjacent atomic crystal sites, respectively. The rate laws of the kinetic Ising model are based on the assumption that the coordination number alone determines the individual reactivities at different sites. For example, the activation energy of dissolving a step site is twice as large as a ledge site in the cubic described above. See Blum and Lasaga (1987) for an excellent review of the treatment of the kinetic Ising model in Monte Carlo simulations for geochernical applications.
Wehrli 1988) studied the interdependence of surface morphology and the dissolution kinetics of minerals. Starting with a perfectly flat surface, these simulations monitor the increase in roughness at an idealized mineral-water interface. These calculations give insight towards the various surface morphologies observed on
weathered minerals and why long times are sometimes required to reach steady state (i.e. steady state surface morphology) in dissolution experiments. However, the models of the dissolution process are very simplistic. For example, the total rate of dissolution is viewed as the sm of the rate of each site dissolving from the surface. In reality, a molecular species located in a face site has a extraordinarily low probability of entering the solution directly, since five bonds must be broken simultaneously. Nevertheless, Monte Carlo simulations are relatively easy to perform, yielding qualitative results stemming from the simplified reaction models assumed.
2.3.4 Ab Inido Quantum Mechanics
Ab initio quantum mechanical calculations are a potentially valuable tool towards understanding the fundamental mechanisms of rock-water interactions. For example, they may provide insights regarding the stable and transition state surface species involved in mineral dissolution and, based on a specific transition state complex structure, activation energies for mineral dissolution can be predicted. The principles