by
Christopher E. Carr
B.S. Aeronautics and Astronautics
B.S. Electrical Science and Engineering
Massachusetts Institute of Technology, 1999
Submitted to the Department of Aeronautics and Astronautics in
partial fulfillment of the requirements for the degree of
Master of Science in Aeronautics and Astronautics
at the
AERO,
MASSACHUSETTS INSTITUTE OF TECHNOLOGY
MASSACHUSMS INSTITUTEOF TECHNOLOGY
September, 2001
AUG 1 3 2002
@ Christopher E. Carr, 2001. All Rights Reserved.
LIBRARIES
The author hereby grants to MIT permission to reproduce
and to distribute publicly paper and electronic copies of
this thesis document in whole or in part.
A u th o r ...-....
.. ... ...Department of Aeronautics and Astronautics
August 10, 2001
fN\
Certified by ...
:j. .:. .e
..-
m..:...
D a a J. Newman
Associate Professor, MacVicar Faculty Fellow
Department of Aeronautics and Astronautics
Thesis Supervisor
A ccepted by ...
...
...
...
... . ....
Wallace E. Vander Velde
Professor of Aeronautics and Astronautics
Chair, Committee on Graduate Students
by
Christopher E. Carr
Submitted to the Department of Aeronautics and Astronautics on August 10, 2001, in partial fulfillment of the requirements for the
degree of Master of Science in Aeronautics and Astronautics
Abstract
Surface-based distributed architectures may help future robotic and human Mars explorers cope with broad mission goals requiring significant mobility and long deployment periods. Surface-based distributed architectures can be characterized by connectivity and performance metrics such as the mean cost of message delivery. A trade study of connectivity for a lander and sensor pod network, based on a simple trade study process for distributed systems, demonstrates that the mean cost of message delivery is sensitive to small changes in surface topography statistics. To under-stand how human explorers can best utilize distributed systems, the use of information and com-munication was studied during a three-week geologic mapping project and through an analysis of nearly sixty thousand voice communications and anecdotal data from the Apollo lunar missions. Distributed systems can help human explorers share information in real-time and better coordinate their activities: A short-range wireless networking system would allow field geologists to pursue distributed geology activities, in which geologists might discuss a geologic feature from several different perspectives simultaneously. Subsequent modeling of line-of-sight connectivity during simulated geological traverses suggests that such a system might be feasible for team-member sep-aration distances from tens to hundreds of meters. An approach to modeling the cost of node mobility is developed for human and robotic agents and used to develop the concept of the cost of system reconfiguration. Changes in the spatial configuration of distributed system elements are considered in terms of a collection of traverses from one point to another by different system ele-ments. A process for traverse planning and execution, applicable to human and robotic explorers, is developed and applied to several situations in order to understand how distributed architectures can support traverse planning, and vice-versa.
Distributed systems fundamentally enhance the exploration process by changing the way in which information is collected and disseminated by exploration agents. This additional access to infor-mation, coupled with appropriate decision-making tools, enhances self-sufficiency and autonomy and allows individual explorers to enhance their probability of survival, coordinate their activities with other explorers, and increase the value they add to the overall mission. However, the design and optimization of distributed systems is a difficult process, and the benefits of distributed archi-tectures come with the significant burden of added system complexity. Targeted deployment of distributed systems for planetary surface exploration can lead to increases in system performance, in terms of enhanced flexibility and robustness, when system complexity is adequately managed.
Thesis Supervisor: Professor Dava J. Newman
This thesis is dedicated to two dear friends who taught me so much both in their lives, and
in their deaths: James W. Wolkin (1977-1999) and Lowell H. Hovis (1929-2001).
It is only because of the many wonderful people in my life that I have completed this
jour-ney and emerged to behold the stars. I cannot possibly hope to thank all of the people who,
directly or indirectly, have contributed to this project. To anyone whose name has not
been mentioned below, I thank you.
To my advisor, Dava J. Newman: I thank you for the freedom you have given me to
pur-sue my research, and for the guidance and support you have provided over the last two
years. To my wonderful office-mate, Joe Saleh, thank you for your intellectual
contribu-tions on flexibility in system design, but more importantly, know that I am forever
indebted to you for your friendship, encouragement, and all that you have taught me over
the last year (I now keep a pencil on hand while reading). To my former office-mates
Amir, Grant, Patricia, and Heiko, thank you for your patience, advice, and friendship.
Thank you also to the other students, staff, and faculty of the Man-Vehicle Laboratory.
To my dear parents Dean and Kathy, and to my little brother Jonathan: How could anyone
ask for a better family. I promise, someday all of the years of schooling will pay off.
Dingli: Thank you for your unconditional care, friendship, and support since we first met
six years ago. Andrea: Thank you for your constant friendship, thesis advice, and poetic
voice. Aditya: Thank you for your unwavering friendship these last six years, and many
wonderful brainstorming sessions. Michal: Thank you for being a supportive friend and a
wonderful person.
I am forever indebted to John Southard and Lindsay Schoenbohm for reintroducing me to
geology, something I loved as a child but only recently began to explore again. Thanks
also to Clark Burchfiel, Kip Hodges, and all of the geology students with whom I had the
opportunity to spend a month in the Bird Spring Mountains of Nevada. I especially want
to thank Lindsay and Ben for being patient teachers of geologic mapping in the field.
I must also gratefully acknowledge support for this work by the National Science
Founda-tion Graduate Research Fellowship Program.
I have emulated the page layout of Edward R. Tufte, and encourage anyone not familiar
with his work to read the three part series including The Visual Display of Quantitative
Information. I make no claims to have faithfully executed visual displays in a manner
con-sistent with his work, but I have tried to tell a story with text and images, and hope that the
reader will take advantage of the margins to make use of whatever writing implements
seem appropriate.
Charles Babbage (1792-1871)
I have decided it was better to have written this thesis, than to have written nothing at all.
All of the aforementioned people, and many not mentioned, have collectively served as
my guide on this adventure. Thank you again for a wonderful journey. For a moment, one
must take in the view of a dark sky filled with glowing points of shining light, and then
begin again.
E quindi uscimmo a riveder le stelle.
Dante Alighieri, Inferno, Canto XXXIV, 140, c. 1307.
Biographical Note
Christopher Carr was born in 1976 in Helsinki, Finland, as a citizen of the United States.
He was raised in Seattle, Washington, and in 1995 was accepted to the Massachusetts
Institute of Technology. He graduated in 1999 with degrees in Aeronautics and
Astronau-tics, and Electrical Science and Engineering, and spent the following two summers
work-ing on a study for a Mars Sample Return mission at the Jet Propulsion Laboratory in
Pasadena, California. He returned to MIT in the fall of 1999 to continue working with the
MIT Man-Vehicle Laboratory as a graduate student in the Department of Aeronautics and
Astronautics while pursuing his doctoral degree in the Medical Engineering and Medical
Physics program in the Harvard-MIT Division of Health Sciences and Technology.
Chapter 1 Introduction ...
27
1.1 M otivation ...
27
1.2 Problem Statem ent ...
28
1.3 Research Objectives ...
29
1.4 Overview of M ethods ...
29
1.5 Contributions ...
30
1.6 Organization ...
30
1.7 References ...
31
Chapter 2 Background ...
33
2.1 Basic Definitions ...
33
2.2 Distributed System s ...
35
2.2.1 Agency ...
36
2.2.2 M ultiagent System s ... 372.2.3 Distributed Artificial Intelligence ... 38
2.2.4 M ultiagent System s for Exploration ... 39
2.2.5 Sum m ary ... 41
2.3 Analogous System s ... 42
2.3.1 Cellular Networks ... 42
2.3.2 Ad-hoc wireless networks ... 43
2.3.3 Battlefield Inform ation System s ... 44
2.4 Exploration ... 45
2.4.1 W hat is exploration? ... . . . 45
2.4.2 Im pact of Com m unications on Exploration ... 45
2.4.3 Exploration as world building ... 48
2.4.4 Characterizing Exploration Agents ... 49
2.5 Extravehicular Activity ... 49
2.6 Exploring M ars ... 51
2.6.1 The M ars Environm ent ... 51
2.6.2 Integration of Hum an and Robotic Exploration ... 54
2.7 Thesis M ethodology ... 56
2.8 References ... 57
Chapter 3 Building an Exploration System ... 65
3.1 Exploration System Structure ... 66
3.1.1 Graphs ... 66
3.1.2 Basic Graph Properties ... 67
3.1.3 Special Graphs ...
68
3.1.4 Graph Connectivity ... 69
3.1.5 Flow s and Networks ... 69
3.1.6 Graph Theory and M ulti-Agent System s ... 71
3.2 Surface M odeling and Analysis ... 71
3.2.1 Scale of Interest ... 72
3.2.2 Power Spectral Density-based Terrain Generation ... 74
3.2.3 Altitude Distribution of Topography ... 76
3.2.5 Roughness and Slope ...
78
3.2.6 Com parison of Two Digital Elevation M odels ...
79
3.2.7 Lim itations of Surface M odeling and Analysis ...
84
3.3 Analyzing Visibility and Coverage ...
85
3.3.1 Line-of-Sight Visibility Algorithm ...
86
3.3.2 Surface Coverage Algorithm ...
87
3.3.3 Accessibility Algorithm ...
88
3.3.4 Node Placem ent ...
89
3.3.5 A Visibility and Coverage Exam ple ...
91
3.3.6 Sum m ary ...
95
3.4 Trades ...
95
3.4.1 Distributed vs. N on D istributed ...
96
3.4.2 M ulti-hop versus single-hop routing ...
96
3.4.3 Layers of Abstraction ...
99
3.4.4 Node Density, Hom ogeneity, and Distribution ...
100
3.4.5 Network Services ...
101
3.4.6 Quality of Service ...
102
3.4.7 Network Stability ...
104
3.4.8 Flexibility & Robustness ...
104
3.5 Trade Study Process ...
105
3.6 A Trade Study Example: Mars Lander and a Sensor Network ... 107
3.6.1 Applying the Trade Study Process ...
107
3.6.2 Results ...
109
3.6.3 Assessing the Results ...
112
3.7 Discussion ...
114
3.7.1 M odeling M ethods and Limitations ...
114
3.7.2 Analysis M ethods and Limitations ...
115
3.7.3 Trade Study Process ...
116
3.7.4 Reducing system com plexity ...
116
3.7.5 Conclusions ...
117
3.8 References ...
117
Chapter 4 O bserving Exploration...121
4.1 Geologic M apping: The User Perspective ...
122
4.1.1 Overview ...
122
4.1.2 Background ...
122
4.1.3 M ethods ...
124
4.1.4 Results and Analysis ...
126
4.1.5 Sum m ary ...
144
4.2 Analyzing Apollo ...
145
4.2.1 Overview ...
145
4.2.2 M ethods ...
146
4.2.3 Results and Analysis ...
147
4.2.4 Sum m ary ...
163
4.3 D iscussion ...
164
4.3.1 Traverse Planning and Analysis ...
165
4.3.3 D ata Collection during Exploration ...
167
4.3.4 Inform ation Delivery During Exploration ...
168
4.3.5 D istributed System s and Hum an Exploration ...
168
4.3.6 Recom m endations ...
169
4.3.7 Conclusion ...
170
4.4 References ...
170
Chapter 5 Supporting and Quantifying Exploration ...
175
5.1 The Traverse ...
176
5.1.1 The Traverse Concept ...
176
5.1.2 Quantifying Traverse Operations ...
176
5.1.3 M etabolic Cost M odeling ...
177
5.1.4 Nondim ensional Cost of Transport ...
180
5.1.5 Cost of Transport for Robotic Agents ...
180
5.1.6 Com puting the M inim um Cost Traverse ...
182
5.1.7 Cost of System Reconfiguration ...
182
5.1.8 Traverse Cost, Value, and Constraints ...
183
5.2 Traverse Heuristics ...
183
5.2.1 W hen are Heuristics useful? ...
... ... ...184
5.2.2 Heuristics for Traverse Planning ...
185
5.2.3 Lim itations of Heuristics ...
186
5.2.4 N orm ative Approach ...
186
5.3 Traverse Planning ...
187
5.3.1 Process for Traverse Planning ...
188
5.4 Exam ples ...
190
5.4.1 Geologists Trekking in the M ojave Desert ...
190
5.4.2 M odeling an Apollo Traverse ...
194
5.4.3 D istributed Field Geology ...
202
5.4.4 Rover Assem bly of a M artian Sensor Network ...
207
5.5 D iscussion ...
211
5.6 Recom m endations ...
211
5.7 Sum m ary and Conclusions ...
213
5.8 References ...
214
Appendix A
-
M athem atical Reference ...
219
5.9 Power Spectral Density Estim ation ...
219
5.9.1 Two-Dim ensional Discrete Fourier Transform ...
219
5.9.2 Two-Dim ensional Power Spectral Density ...
219
5.9.3 Radial Power Spectral Density ...
221
5.10 Entropy Principles ...
221
5.10.1 Shannon M easure of Entropy ...
221
5.10.2 Principle of M axim um Entropy ...
221
5.10.3 Principle of M inim um Cross-Entropy ...
222
5.11 References ...
224
Appendix B
-
Detailed Results of the Apollo Voice Communications Study ... 227
5.12 Introduction ...
227
5.13 Apollo 11 ...
228
5.15 Apollo 14 ...
236
5.16 Apollo 15 ...
240
5.17 Apollo 16 ...
244
5.18 Apollo 17 ...
248
5.19 Com parison Between M issions ...
252
Appendix C
-
Data Sources ...
265
5.20 Digital Elevation M odels ...
265
5.21 Apollo Biom edical Data ...
268
5.22 Apollo Audio Transcripts ...
269
5.23 References ...
269
Appendix D
-
Code Listing ...
271
5.24 Introduction ...
271
5.25 Surface Functions ...
271
5.25.1 SurfaceCom puteAutocorrelation ...
271
5.25.2 SurfaceCom puteCorrelation ...
272
5.25.3 SurfaceCom puteCoverage ...
273
5.25.4 SurfaceCom puteCoverageLOSV ...
274
5.25.5 SurfaceCom puteCoveragePoint ...
275
5.25.6 SurfaceCom puteCoveragePointLOSV ...
277
5.25.7 SurfaceCom puteCoverageVector ...
279
5.25.8 SurfaceCom puteHistogram ...
281
5.25.9 SurfaceCom puteHistogram _Cum ulative ...
282
5.25.10 SurfaceCom putePSD ...
282
5.25.11 SurfaceCom puteReachability ...
283
5.25.12 SurfaceCom puteReconfigCost ...
285
5.25.13 SurfaceCom puteSlope ...
286
5.25.14 SurfaceCom puteSubsample ...
287
5.25.15 SurfaceCom puteSupersample ...
288
5.25.16 SurfaceCom puteTravelDir ...
289
5.25.17 SurfaceConvertCrdToPts ...
290
5.25.18 SurfaceConvertPtsToCrd ...
291
5.25.19 SurfaceCreate ...
291
5.25.20 SurfaceExtractAltitudes ...
293
5.25.21 SurfaceExtractEven ...
294
5.25.22 SurfaceExtractNorm alized ...
295
5.25.23 SurfaceExtractPoints ...
296
5.25.24 SurfaceExtractProfile ...
296
5.25.25 SurfaceExtractRegion ...
297
5.25.26 SurfaceExtractSquare ...
298
5.25.27 SurfaceExtractValid ...
299
5.25.28 SurfaceGeoreference ...
301
5.25.29 SurfaceIm port ...
301
5.25.30 SurfaceM erge2 ...
302
5.25.31 SurfacePlot ...
303
5.25.32 SurfacePlotAdd_Scale ...
303
105.25.34 SurfacePlotM inim al_3d ...
305
5.25.35yp
...
306
5.25.36 FloodFill...307
5.26 Point Functions ...
308
5.27 Graph Functions ...
308
5.27.1 GraphComputeAdjacency ...
308
5.27.2 GraphComputeDegree ...
309
5.27.3 GraphComputeDsp ...
310
5.27.4 GraphComputeM CST ...
312
5.27.5 GraphCreateNEP ...
313
5.27.6 GraphCompute
EP los...315
5.27.7 GraphCreatePoints ...
315
5.27.8 GraphCreatePointsRestricted ...
316
5.27.9 GraphPlotEdges ...
318
5.27.10 GraphPlotPoints ...
319
5.27.11 GraphRemoveLeaves ...
319
5.28 Traverse Functions ...
320
5.28.1 TraverseComputeDistance ...
320
5.28.2 TraverseComputeM etabolicCost ...
322
5.28.3 TraverseCompute_ M inCost ...
323
5.28.4 TraverseComputeRoverCost ...
327
5.28.5 TraverseExpand ...
329
5.28.6 TraverseFromPoints ...
330
5.28.7 TraverseImport ...
331
5.28.8 TraverseInterpolate ...
331
5.28.9 TraverseInterpolateSegment ...
332
5.28.10 TraversePlotOnSurface ...
333
5.28.11 TraverseProject ...
334
5.29 Power Spectral Density Functions ...
335
5.29.1g
...
335
5.29.2 PSD _ComputeAvgCrossDiag ...
336
5.29.3 PSDComputeAvgDiag
...
337
5.29.4g_
...
338
5.29.5 PSDComputeRadial
...
339
5.29.6 PSD ExtractLine..
...
...
...
340
5.29.7 PSDPlot
e..._R. adi.... ...
...
341
5.29.8 PSDPlot _M inim al ...
342
5.29.9 PSDPlotRadial...
...
343
5.29.10 PSDPlotRadialM inimal ...
... 343
5.29.11 Synth Spect ... ...
...
344
5.29.12 FFTAxis ... ...
...
345
5.30 M iscellaneous Functions...
...
346
5.30.1 BivariateNorm al ...
346
5.30.2 BivariateNorm alEllipse ...
347
5.30.3 Colorm apCreate ...
348
115.30.5 D efaultV al ...
349
5.30.6 StdDevRange ...
350
5.30.7 V erbose ...
350
5.31 Rover Exam ple ...
351
5.31.1 RoverExam ple ...
351
5.31.2 Exam ple Sim ulation Listing for Failure ...
356
5.31.3 Exam ple Sim ulation Listing for Success ...
356
Bibliography ...
361
Figure 1-1. Mission architecture characterization is critical during space mission design
and during mission operations at the system- and element-level. ... 27
Figure 1-2. Architectures must be characterized at the system and element level, trades must be conducted, and operational concepts must be developed in order to demonstrate how distributed systems might achieve flexibility and robustness...29
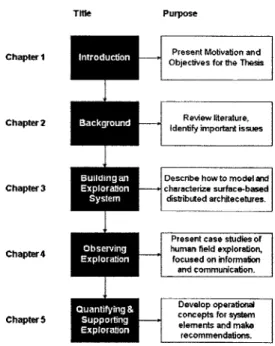
Figure 1-3. High Level Thesis Road-map... 30
Figure 2-1. Systems engineering includes the process of mapping a set of customer needs to a set of functional requirements, and mapping that set of functional requirements to a set of design param eters... 34
Figure 2-2. A generic agent is some entity that interacts with an environment using sensors an d effectors...36
Figure 2-3. Schematically, behavior is determined by three factors, including the environ-ment, tasks or goals, and factors inherent to the organism or agent...37
Figure 2-4. An abstracted view of a multiagent system where agents are represented as nodes or vertices in a graph, and interaction opportunities between agents are represent-ed as represent-edges in the graph. ... 39
Figure 2-5. A reconstruction of astronaut activities near the Apollo 16 Lunar Module and the Apollo Lunar Surface Experiments Package deployment area...47
Figure 2-6. The number of extravehicular activities in the US and Russian space programs from 1965-2000 are compared to the number of extravehicular activities for a single hu-m an hu-m ission to M ars... 50
Figure 2-7. The global topography of Mars as measured by the Mars Global Surveyor Mars Orbiting Laser Altim eter (M OLA). ... 52
Figure 2-8. A time lapse sequence from June 17, 2001 to July 14, 2001 shows the rapid development of a global-scale dust storm for opposite hemispheres of Mars...53
Figure 3-1. The process developed and applied in this chapter assists in the characterization of distributed architecture operations given a set of requirements, a model of an envi-ronm ent, and an operational m odel... 65
Figure 3-2. Example of a simple graph G={N,E}. ... 66
Figure 3-3. Structure of an augmented graph GPC=
{
N,E,P,C ... 67Figure 3-4. Example of an augmented graph G={N,E,P,C}. ... 67
Figure 3-5. A P4 path and a C4 cycle on a simple graph G={N,E}. ... 68
Figure 3-6. (A) depicts a small tree. (B) depicts a forest of three trees. ... 68
Figure 3-7. Cartesian surface m odel. ... 72
Figure 3-8. Relationship between surface arc distance and the height above the surface re-quired for line of sight visibility to the opposite side of the surface, plotted for Earth, M ars, the M oon, and Europa. ... 72 Figure 3-9. Mars exploration surface mobility activities and supporting data as a function
of scale len gth . ... 7 3
cratered terrain (Region A) and of an area in the northern lowlands (Region B). Slopes
indicate pow er law exponents...
75
Figure 3-11. These generated height fields are colored by altitude, and the power law
scal-ing exponent is shown in the lower right corner of each height field...75
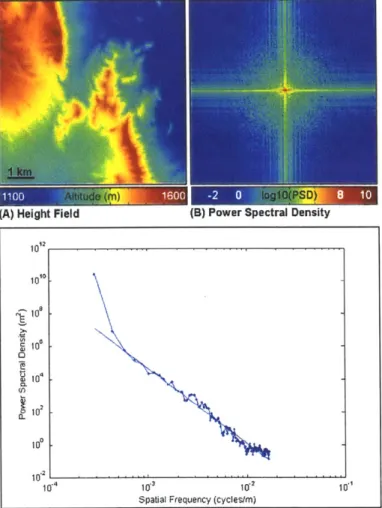
Figure 3-12. Height field representation and unnormalized power spectral density of a real
su rface ...
7 6
Figure 3-13. Altitude histogram for real and generated terrain as a function of the power
law scaling exponent...
77
Figure 3-14. A plot of mean cross-entropy between the altitude distributions of the real
height field and generated height fields as a function of the power law...77
Figure 3-15. Visual illustration of weighted centered-difference slope algorithm for
surfac-es reprsurfac-esented by grids of evenly spaced points...79
Figure 3-16. Altitude characteristics of two digital elevation models. ...
80
Figure 3-17. Representative normalized radial power spectral densities for the Crater Lake
and Cottonwood digital elevation models ...
80
Figure 3-18. Altitude histograms of the Crater Lake and Cottonwood digital elevation
m o dels ...
8 1
Figure 3-19. Height-height correlation functions in the E-W and N-S directions for the
Cra-ter Lake (A) and Cottonwood (B) digital elevation models. ...
81
Figure 3-20. Height autocorrelation functions in the E-W and N-S directions for the Crater
Lake (A) and Cottonwood (B) digital elevation models...82
Figure 3-21. Slope characteristics of the Crater Lake and Cottonwood digital elevation
m o dels ...
82
Figure 3-22. Slope histograms of the Crater Lake and Cottonwood digital elevation models
demonstrate that the proportion of cells with a given slope could potentially be
approx-imated by a linear function in log-log space...
83
Figure 3-23. Slopes above 1,
5,
15, and 30 degrees are visually depicted for the
Cotton-wood (A) and Crater Lake (B) digital elevation models. ...
83
Figure 3-24. Line-of-sight visibility serves as a highly simplified channel model for
repre-senting opportunities for communication: a typical channel model structure (A), as
compared to the line-of-sight visibility channel model structure (B). ...
85
Figure 3-25. To compute line-of-sight visibility between two nodes on or near the surface
of a height field, one can define a parameterized curve... ...
86
Figure 3-26. In (A), line-of-sight visibility does not exist between the two nodes (one node
is partially hidden). In (B), the altitude of each node has been increased, and line of
sight visibility exists between the two nodes...
86
Figure 3-27. Surface coverage using a binary coverage algorithm is shown for a node at a
height above a surface of (A) 1 meter, (B) 5 meters, and (C) 50 meters...87
Figure 3-28. Surface coverage is computed here for a collection of nodes that together form
a path on a surface. ...
88
Figure 3-29. A few possible architectures for delivery of a surface-based distributed
Figure 3-30. Power law scaling exponent (beta) significantly affects the degree distribution
of a surface-based distributed system ...
92
Figure 3-31. Node density significantly affects the degree distribution of a surface-based
distributed system . ...
93
Figure 3-32. Power law scaling exponent (beta) significantly affects surface coverage of a
surface-based distributed system. ...
94
Figure 3-33. Multi-hop and single-hop transmission power can be compared by computing
the power required to transmit a message from node A to node B using a single hop or
via n sequential hops...
96
Figure 3-34. Decision ratio for multi-hop or single-hop transmission is plotted as a function
of the number of hops of the multi-hop transmission path and the transmission and
re-ception probabilities...
98
Figure 3-35. Network layers and adjustable parameters that drive network efficiency. ..99
Figure 3-36. Two digital elevation models were created of the eastern region of the Mojave
N ational Preserve, C alifornia...107
Figure 3-37. Assumed lander landing-site dispersions for the Soda Lake and Kelso Dunes
digital elevation m odels...108
Figure 3-38. Node connectivity for the sensor pods network for the Soda Lake "landing
site ." ...
1 10
Figure 3-39. Mean power cost of message delivery from nodes to the lander for the Soda
L ake "landing site." ...
110
Figure 3-40. Node connectivity for the sensor pods network for the Kelso Dunes "landing
site ." ...
1 1 1
Figure 3-41. Mean power cost of message delivery from nodes to the lander for the Kelso
D unes "landing site." ...
111
Figure 3-42. Sample network topologies for the Soda Lake (A) and Kelso Dunes (B)
"land-in g sites." ...
113
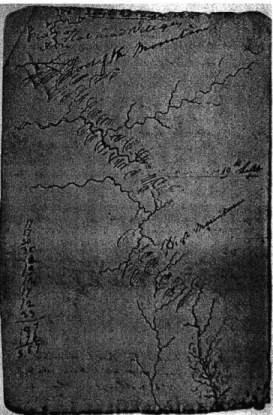
Figure 4-1. A map from Clark's journal showing the course and camping locations of
Lewis and Clark from September 18-20, 1805 during their 1804-1806 expedition across
the L ouisiana Purchase. ...
121
Figure 4-2. The geologic mapping project focused on mapping the north-west portion of
the Bird Spring Mountains and the Bird Spring Thrust...122
Figure 4-3. Approximate field areas in the Bird Spring Mountains for the three mapping
teams are shown in relation to the group campsite...124
Figure 4-4. The author is shown here in the field while conducting a preliminary recording
w ith the pulse-oxim eter sensor. ...
125
Figure 4-5. Altitude residuals are plotted for 435 waypoints, computed from the difference
between waypoint estimated altitude and altitude according to the Cottonwood digital
elevation m odel...127
Figure 4-6. Waypoints collected during geologic mapping activities are plotted on a region
of the Cottonwood, Nevada, digital elevation model. ...
127
Figure 4-8. Traverses for mapping days 12, 13, 18, 22, 23. A final summary plot (A) shows
all of the traverses...130
Figure 4-9. Traverse distance is plotted as a function of the day of the geologic mapping
p roject. ...
13 1
Figure 4-10. Altitude gained (total distance ascended) is plotted as a function of the day of
the geologic m apping project...131
Figure 4-11. Distance ascended per distance traversed is plotted as a function of the day of
geologic mapping activities for which traverses were defined...132
Figure 4-12. Traverses are plotted on a slope map of the field area. ...
132
Figure 4-13. Surface slopes encountered during the eleven traverses were computed by
spatially sampling or temporally sampling interpolated traverses and projecting them
onto a slope m ap of the field area...133
Figure 4-14. Surface slopes encountered during days 4 and 12 are compared to surface
slopes encountered during the other traverses...133
Figure 4-15. Surface slopes encountered during days 4 and 12 are compared to surface
slopes encountered during the other traverses. ...
134
Figure 4-16. These cliffs in the North-West corner of mapping area A represent some of
the steepest slopes in the Bird Spring Mountains. ...
134
Figure 4-17. Inverse-distance based visibility analysis for traverses 2, 4, 5, 6, 9...135
Figure 4-18. Visibility analysis for traverses 12, 13, 18, 22, and 23. (A) shows a combined
analysis of all the traverses. ...
136
Figure 4-19. A histogram of the mean velocities between traverse waypoints shows that
88% of travel between waypoints was at a mean velocity of 0.5 m/s or slower (95%
con-fidence boundaries for each proportion, assuming constant velocities between traverse
w aypoints, are indicated as green dots). ...
137
Figure 4-20. A histogram of mean metabolic power between traverse waypoints was
com-puted, based on the author's mass of approximately 80 kg, and an assumed additional
13 kg for clothes, backpack, and equipment (daily weight of clothes and equipment was
not m easured)...138
Figure 4-21. Estimated total energy requirements for each traverse can be computed by
in-tegrating the estimated metabolic power for each traverse...138
Figure 4-22. Estimated mean metabolic power between adjacent waypoints for all eleven
traverses. ...
13 9
Figure 4-23. Conceptual illustration of a metabolic power design envelope for future space
suit design . ...
139
Figure 4-24. A reachability map (A) for the field area has been computed using a slope
re-striction of slopes less than or equal to five degrees, with an initial location given by a
point in the central valley of the field area. ...
140
Figure 4-25. Altitude (top), climb rate (middle), and heart rate (bottom) are plotted as a
function of time during a simultaneous recording of position and heart rate during the
day 10 traverse. ...
140
proportion function was estimated as a sum of two exponential functions with time
con-stants of 20 m inutes and 300 m inutes...141
Figure 4-27. Group communication during geologic mapping is illustrated here in a
con-ceptual, subjective sketch. ...
142
Figure 4-28. A sketch was made by the author one evening in camp during a group
discus-sion of potential geologic structures observed in the field. ...
143
Figure 4-29. A database of voice communications during the lunar surface portions of the
Apollo missions was created from [Jones, 2000]. ...
146
Figure 4-30. The voice communications database was queried, data was exported, and data
analyses was performed using the software tool MATLAB. ...
146
Figure 4-31. Voice communication initiations for Apollo 17 lunar surface exploration by
mission role as a function of mission elapsed time. ...
148
Figure 4-32. Proportion of voice communications as a function of mission role for all of
the A pollo lunar surface m issions...149
Figure 4-33. Time intervals between voice communications for Apollo 14 lunar surface
ex-ploration by m ission role. ...
150
Figure 4-34. Mean time intervals between voice communications for different mission
ro le s...15
1
Figure 4-35. Voice communications durations (upper bounds) for Apollo 14 lunar surface
exploration by m ission role...152
Figure 4-36. Mean voice communication durations for different mission roles for all
Apol-lo lunar surface m issions...153
Figure 4-37. Mean voice communication rates during the Apollo lunar surface missions,
including overall rate and rates during extravehicular activity and non-extravehicular
activ ity ...
154
Figure 4-38. Mean communication rates during extravehicular activity and
non-extrave-hicular activity during Apollo 11, 12, and 14... ...
155
Figure 4-39. Mean communication rates during extravehicular activity and
non-extrave-hicular activity during Apollo 15, 16, and 17...156
Figure 4-40. Metabolic cost of lunar surface astronauts during the second extravehicular
activity of A pollo 14...157
Figure 4-41. Digital elevation model of the Apollo 14 traverse area. ...
160
Figure 4-42. A digital elevation model of the Apollo 14 traverse area demonstrates the
po-sition of geologic stations C-prime and C1 relative to the Lunar Module. ... 161
Figure 4-43. Visibility of the lunar surface from geological station C-prime (top) and
sta-tion C 1 (bottom )...162
Figure 4-44. Use of this device, called a gnomon, reduced the photo-documentation
work-load of Apollo lunar surface astronauts. ...
167
Figure 5-1. During surface exploration missions, day-to-day operations are typically
bro-ken dow n into "traverse" operations...175
Figure 5-2. The traverse can be viewed as an encapsulation of tasks and activities in a
Figure 5-3. Oxygen uptake, a measure of metabolic cost, for three subjects walking at 0.5
m/s under partial gravity conditions, simulated using a submersible treadmill...177
Figure 5-4. Effect of surface slope and velocity on energy expenditure during locomotion
in simulated lunar gravity for pressure suited subjects (25.5 kN/m2)...179
Figure 5-5. Effect of surface slope and velocity on energy expenditure in Ig and lunar
grav-ity environments as predicted by the load-carrying model, based on an 80 kg individual
carrying a 40 kg load. ...
179
Figure 5-6. Effect of surface condition on energy expenditure during locomotion in
simu-lated lunar gravity for pressure suited subjects (25.5 kN/m2)...180
Figure 5-7. Unnormalized cost of transport (W-hr) for the Apollo Lunar Roving Vehicle.
Cumulative energy consumption is plotted as a function of distance traversed...181
Figure 5-8. Surface slopes traversed by the Lunar Roving Vehicle during the three Apollo
15 extravehicular activities (EVA s)...181
Figure 5-9. Graph representation of the least cost traverse problem: Given a set of paths
between points A and B, and a cost function C(i,j) for each edge eij in the graph, find
the m inim um cost path from A to B . ...
182
Figure 5-10. "Minimum cost" traverses from Soda Dry Lake to the base of Old Dad
Moun-tain in the M ojave D esert. ...
192
Figure 5-11. The "minimum cost" traverse algorithm generates points on or near the
min-imum cost traverse, computes costs between nearby points, and finds the minimal cost
path to each point. ...
193
Figure 5-12. Western region of the Apollo 14 second traverse. From [Jones, 2001];
graph-ical reconstruction by Lennie W augh. ...
195
Figure 5-13. Eastern region of the Apollo 14 second traverse. From [Jones, 2001];
graph-ical reconstruction by Lennie W augh. ...
196
Figure 5-14. Planned (A) and actual (B) traverses for the Apollo 14 second extravehicular
activity. Prohibited areas (based on a slope constraint of [0 15] degrees) are shown in
b lack . ...
19 7
Figure 5-15. Surface visibility along the planned (A) and actual (B) long traverse during
A p ollo 14 . ...
19 8
Figure 5-16. Slope distributions for the planned and actual Apollo 14 long traverses
...
199
Figure 5-17. Slope distributions for the planned and actual Apollo 14 long traverses... 199
Figure 5-18. Visibility analysis from a new possible Cone Crater sampling site ... 201
Figure 5-19. Comparison of the preferred direction of travel heuristic (short blue lines) and
actual field geology traverses (black lines) in the Bird Spring Mountains, Nevada..203
Figure 5-20. Mean number of reachable nodes (from the perspective of a given node)
av-eraged over all traverse positions and trials for a given dispersion distribution...205
Figure 5-21. Mean cost of message delivery for a given dispersion distribution. ... 206
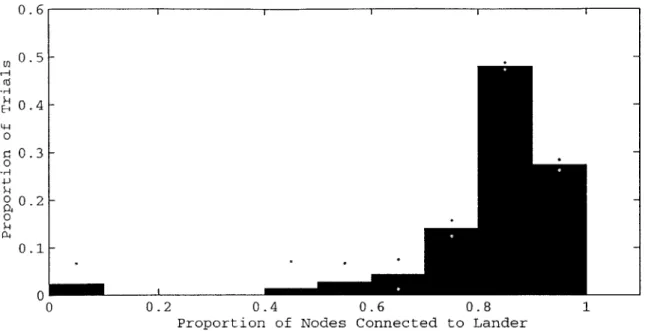
Figure 5-22. Number of disconnected nodes for a given dispersion distribution. ... 206
Figure 5-23. The Rover's mission: deploy a distributed surface communications and
Figure 5-24. Simplified pseudocode version of the Rover traverse planning and execution
strateg y . ...
20 9
Figure 5-25. An example of a successful traverse planning attempt (red line) by the Rover
from its current location to the target. Note that this plan does not take into account the
required line-of-sight visibility constraint. The white areas indicate slope-restricted
ar-eas (>20 degree slopes). ...
210
Figure 5-26. An execution trace of a failed traverse attempt by the Rover. ... 210
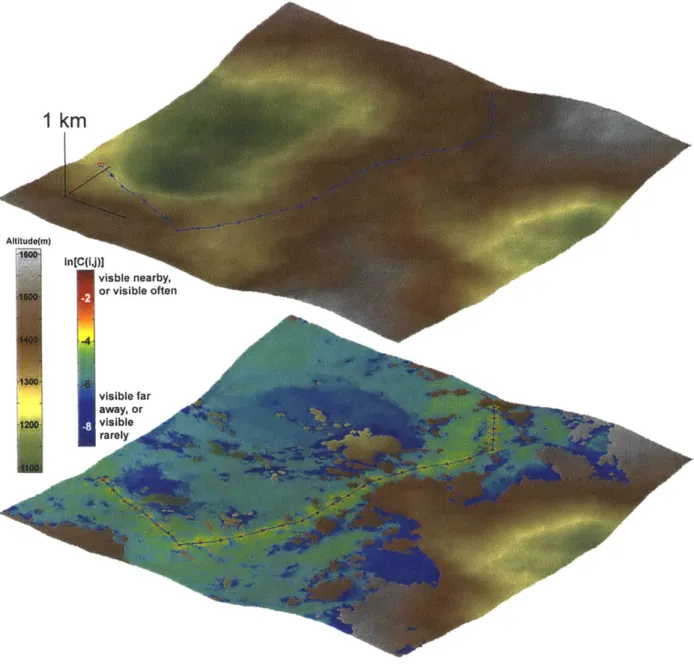
Figure 5-27. Surface coverage of the data wand sensing and communication network and
remote site link as successfully deployed by the Rover. Dark lines represent
line-of-sight visibility between data wands (points). ...
211
Figure 5-28. The data wand sensing and communication network and remote site link as
successfully deployed by the Rover, overlaid on the Crater Lake digital elevation
mod-el. Dark lines represent line-of-sight visibility between data wands (points). ... 211
Figure A-1. Radial power spectral densities computed for different representations of the
same height field, including a sub-region, a sub-sampled version of the height field, and
a super-sam pled version of the height field. ...
220
Figure A-2. Four methods of estimating a representative radial power spectral density
pro-file for a non-radially-symmetric power spectral density. ...
221
Figure A-3. A plot of m ean cross-entropy... ...
223
Figure B-1. Voice communication initiations for Apollo 11 lunar surface exploration by
mission role as a function of mission elapsed time. ...
228
Figure B-2. Time intervals between voice communications for Apollo 11 lunar surface
ex-ploration by m ission role. ...
229
Figure B-3. Voice communications durations (upper bounds) for Apollo 11 lunar surface
exploration by m ission role...230
Figure B-4. Voice communication initiations for Apollo 12 lunar surface exploration by
mission role as a function of mission elapsed time. ...
232
Figure B-5. Time intervals between voice communications for Apollo 12 lunar surface
ex-ploration by m ission role. ...
233
Figure B-6. Voice communications durations (upper bounds) for Apollo 12 lunar surface
exploration by m ission role...234
Figure B-7. Voice communication initiations for Apollo 14 lunar surface exploration by
mission role as a function of mission elapsed time. ...
236
Figure B-8. Time intervals between voice communications for Apollo 14 lunar surface
ex-ploration by m ission role. ...
237
Figure B-9. Voice communications durations (upper bounds) for Apollo 14 lunar surface
exploration by m ission role...238
Figure B-10. Voice communication initiations for Apollo 15 lunar surface exploration by
mission role as a function of mission elapsed time. ...
240
Figure B-11. Time intervals between voice communications for Apollo 15 lunar surface
exploration by m ission role...241
exploration by m ission role...242
Figure B-13. Voice communication initiations for Apollo 16 lunar surface exploration by
mission role as a function of mission elapsed time. ...
244
Figure B-14. Time intervals between voice communications for Apollo 16 lunar surface
exploration by m ission role...245
Figure B-15. Voice communications durations (upper bounds) for Apollo 16 lunar surface
exploration by m ission role...246
Figure B-16. Voice communication initiations for Apollo 17 lunar surface exploration by
mission role as a function of mission elapsed time. ...
248
Figure B-17. Time intervals between voice communications for Apollo 17 lunar surface
exploration by m ission role...249
Figure B-18. Voice communications durations (upper bounds) for Apollo 17 lunar surface
exploration by m ission role...250
Figure B-19. Mean communication rates during extravehicular activity and
non-extrave-hicular activity during Apollo 11, 12, and 14... ...
254
Figure B-20. Mean communication rates during extravehicular activity and
non-extrave-hicular activity during Apollo 15, 16, and 17...255
Figure B-21. Proportion of voice communications as a function of mission role for all of
the A pollo lunar surface m issions. ...
256
Figure B-22. Proportion of voice communications as a function of communication duration
for all of the Apollo lunar surface missions. ...
256
Figure B-23. Proportion of voice communications as a function of communication duration
for the Commanders of the Apollo lunar surface missions. ...
257
Figure B-24. Proportion of voice communications as a function of communication duration
for the Lunar Module Pilots of the Apollo lunar surface missions. ... 257
Figure B-25. Proportion of voice communications as a function of communication duration
for the CapComs of the Apollo lunar surface missions. ...
258
Figure B-26. Proportion of voice communications as a function of communication duration
for the "CapComis" of the Apollo lunar surface missions. ...
258
Figure B-27. Proportion of voice communications as a function of communication duration
for the "CapCom2s" of the Apollo lunar surface missions. ...
259
Figure B-28. Proportion of voice communications as a function of communication duration
for "O thers"...259
Figure B-29. Mean time intervals between voice communications for different mission
roles as a function of the Apollo lunar surface mission...260
Figure B-30. Mean voice communication durations for different mission roles as a function
of the Apollo lunar surface m ission...261
Figure C-1. Selecting altitude control points for the Apollo 14 digital elevation model
based on highly sampled ten meter contours intervals produced a poor quality digital
elevation m odel. ...
266
Figure C-2. Selecting altitude control points for the Apollo 14 digital elevation model
quality digital elevation m odel. ...
267
Figure C-3. A linear fit of the radial power spectral density of the Apollo 14 digital
eleva-tion model gives a power law scaling exponent of 4.86. ...
268
Figure C-4. Metabolic expenditures for the two lunar surface astronauts during the Apollo
14 extravehicular activities.. ...
269
TABLE 2-1. Environment Properties for Multiagent Systems...
TA BLE 2-2.
Properties of the real w orld ...
TABLE 2-3. Comparison of Bulk Parameters for Earth and Mars ...
TA BLE 3-1. G raph connectivity m etrics...
TABLE 3-2. Surface curvature for Earth, Mars, the Moon, and Europa...
TA BLE 4-1. A ctivity A llocation by D ays ...
TABLE 4-2. Data Collection Equipment ...
TABLE 4-3. Digital Elevation Model Coordinates for the Region of Study ...
TABLE 4-4. Voice Communications Database Records...
TABLE 5-1. Comparison of Design Methodologies ...
TABLE 5-2. Comparison of Metabolic Cost Results ...
TABLE B-1. Voice Communication Analysis (Apollo 11) ...
TABLE B-2. Time Interval Statistics (Apollo 11) ...
TABLE B-3. Communication Duration Statistics (Apollo 11) ...
TABLE B-4. Voice Communication Analysis (Apollo 12) ...
TABLE B-5. Time Interval Statistics (Apollo 12) ...
TABLE B-6. Communication Duration Statistics (Apollo 12) ...
TABLE B-7. Voice Communication Analysis (Apollo 14) ...
TABLE B-8. Time Interval Statistics (Apollo 14) ...
TABLE B-9. Communication Duration Statistics (Apollo 14) ...
TABLE B-10. Voice Communication Analysis (Apollo 15) ...
TABLE
TABLE
TABLE
TABLE
TABLE
TABLE
TABLE
TABLE
TABLE
TABLE
TABLE
B-11.
B-12.
B-13.
B-14.
B-15.
B-16.
B-17.
B-18.
B-19.
B-20.
B-21.
Time Interval Statistics (Apollo 15) ...
Communication Duration Statistics (Apollo 15) ...
Voice Communication Analysis (Apollo 16) ...
Time Interval Statistics (Apollo 16) ...
Communication Duration Statistics (Apollo 16) ...
Voice Communication Analysis (Apollo 17) ...
Time Interval Statistics (Apollo 17) ...
Communication Duration Statistics (Apollo 17) ...
Surface Mission Mean Communication Rates...
Sleep-Corrected Mean Communication Rates...
EVA and Non-EVA Mission Durations ...
TABLE B-22. EVA and Non-EVA Mean Communication Rates ...
TABLE C-1. Digital Elevation Model (DEM) Sources ...
38
41
51
69
72
124
125
126
147
184
200
231
231
231
235
235
235
239
239
239
243
243
243
247
247
247
251
251
251
252
252
253
253
265
23The first human step on the Martian surface:
Inevitable Descent, by Pat Rawlings.
On a historic day, in the not-so-distant future, a human will set foot upon the surface of the planet Mars as part of a combined human and robotic effort to explore the Red Planet. We will go to Mars for many reasons. We will look for evidence of the possibility of present or past life on Mars, perform geological surveys, and look for subsurface water and other resources necessary for long-term human survival in the Martian envi-ronment. We will characterize the atmospheric, surface, and subsurface environments of the planet. We will develop hypotheses about the past history of Mars, and compare its history to that of the Earth. Ultimately, the exploration of Mars may result in the growth of a second branch of humanity, not (I am sure) as an expression of escapism, but as an expression of what it means to be human. We will go to Mars, and in doing so we will better understand what it means to be human and what it means to inhabit the beautiful planet called Earth. Many will argue as to whether humans should be sent to explore the harsh environments of space. It is clear that humans and robots have differing talents, but that humans can provide one thing that no current robot can approach: a human perspective and a human description of the experience of exploration. Humans on the Martian surface will observe, record, express, and communicate their experiences to the rest of humanity, not in competition with robotic explorers of the Red Planet, but as complementary elements of a cooperative venture. Observation, interpretation, and communication may be accomplished via autono-mous robots or via remote operation of robots, but is also likely to involve a significant amount of direct contact with the Martian surface in the form of extravehicular activity.
This thesis attempts to apply the concept of distributed architectures to the challenges of planetary sur-face exploration, and to demonstrate some of the capabilities of distributed architectures for the sursur-face exploration of Mars. It was my intent to demonstrate that similar modeling approaches can be used to model both human and machine components of a distributed system, and to emphasize the interactions between distributed system elements. If I have opened more doors than I have closed, but managed to close one or two, then I have succeeded in accomplishing what I set out to do: to tell a compelling story, supported in part
by my research. It is the author's hope that future human planetary surface exploration will extend far
beyond the Earth, Moon, and Mars. While the human and robotic exploration of Mars is the primary focus of this thesis, I hope that some of the material presented herein may find an application to future human plane-tary surface exploration well beyond the red dust of our nearest neighbor.
It is ironic that artist Pat Rawlings' depiction of the first human footstep on the Martian surface contains the word "inevitable." The human exploration of Mars, and any part of the universe, is anything but inevita-ble. The human and robotic exploration of space has been, and will continue to be, achieved only through the will and hard work of individuals with the curiosity and vision to persevere in times of light and dark to enrich and improve the human condition.
Ad astra.
Christopher E. Carr May 11, 2001 Earth
Will be to arrive where we started And know the place for the first time.
In keeping with the immortal words of T.S. Eliot, this thesis begins with its destination:
Surface-based distributed architectures, and the elements of which they are composed, can be characterized by a quantifiable set of performance metrics including cost of transport of system elements and connectivity metrics. However; the design and optimization of distributed systems is a difficult process, and the benefits of distrib-uted architectures come with the significant burden of added system complexity. Targeted deployment of distributed systems for plane-tary surface exploration can lead to increases in system perfor-mance, in terms of enhanced flexibility and robustness, when system complexity is adequately managed.
System architecture includes not only the structure of a system and its elements, but must also include the structure of the environment and the process required to build and operate the system [Rechtin,
1991]. Figure 1-1 illustrates the dual role of system architecture
characterization in mission design and operations for planetary sur-face exploration missions. Understanding the advantages and
disad-vantages of distributed architectures for Mars surface exploration requires methods for characterization of distributed architectures: the rest of the thesis develops some methods of characterizing dis-tributed architectures for surface exploration, and demonstrates how distributed architectures can be utilized to achieve self-suffi-ciency, autonomy, and group collaboration and coordination.
1.1 Motivation
A system for future human and robotic exploration of the Martian
surface needs the capability to cope with challenges imposed by broad mission goals, a minimum surface stay in some mission
architectures of more than 600 days [Hoffman et al., 1997], and the dynamic character and lack of knowledge of the Martian environ-ment. Current planning for future exploration of Mars is hampered
by:
* disproportionately little focus on the surface exploration phase
in previous human Mars mission architectures,
e a lack of planetary extravehicular activity experience,
Mission
Design System-Level Operations TraverseOperations
FIGURE 1-1. Mission architecture
characterization is critical during space mission design and during mission
operations at the system- and element-level. During surface exploration missions, day-to-day operations are typically broken down into "traverse" operations, in which one or more elements of a system cooperate to achieve a limited subset of overall mission goals while working within the constraints of a set of (typically heuristic) rules called "flight rules."
* under utilization of existing technologies and data to the art and science of exploration, and
" the lack of an evolutionary pathway that bridges the gap from
robotic exploration to joint human-robotic exploration, and that incorporates cooperative strategies for future human and robotic explorers.
This thesis attempts to address these deficiencies by describing the exploration of the Martian surface as a distributed architecture of interacting elements both human and robotic. This description incorporates elements from theories of distributed systems, includ-ing multi-agent systems and distributed artificial intelligence. Anal-ysis of previous extravehicular activity on the lunar surface and the author's personal experiences of field geology are also described,
and a unified approach for traverse planning and execution for human and robotic explorers on the Martian surface is proposed. Mechanisms for how distributed architectures can be used to sup-port extravehicular activity planning and execution on the Martian
surface are proposed and explored.
1.2 Problem Statement
The primary goal of system engineering is to ensure that "the sys-tem is designed, built, and operated so that it accomplishes its pur-pose in the most cost-effective way possible, considering
performance, cost, schedule, and risk [NASA SP-6105, 1995]." In the context of systems engineering, the crucial questions for this research effort are:
" Why utilize a distributed architecture for Mars surface
explora-tion? What are the major trades for distributed architectures for Mars surface exploration?
e What element-level and system-level metrics are appropriate for characterizing the element-level and system-level performance of a distributed architecture for Mars surface exploration?
e What determines the behavior of individual elements of the
dis-tributed system, and how can the individual and collective behaviors of those elements be optimized to achieve mission goals?
e Specifically, how can a distributed architecture for Mars surface
exploration support the planning and execution of extravehicu-lar activity, and the collection, interpretation, and dissemination of information?
The primary driving question of this thesis can be stated as: How can distributed architectures increase the likelihood of mis-sion success by enhancing the flexibility and robustness of a human and/or robotic Mars surface exploration mission?
Figure 1-2 illustrates some of the major system architecting activi-ties required to evaluate how distributed architectures can lead to
flexible and robust systems. While cost is an important factor in the systems architecting and systems engineering processes, it will not be a major focus of this work.
1.3 Research Objectives
The research objectives of this thesis are:
* to define major trades for distributed architectures for Mars sur-face exploration and demonstrate under what conditions these
architectures might be desirable over alternatives,
* to develop a set of desirable features of distributed architectures for Mars surface exploration and to illustrate how some of these features might be achieved.
e to develop an basic operational concepts of how humans may explore the Martian surface by evaluating available data from the lunar surface operations portion of the Apollo missions and by developing an understanding of field geology through partic-ipation in a month-long field geologic mapping project,
e to demonstrate, through simple examples and models, how a
distributed architecture for Mars surface exploration can enhance traverse planning and execution for elements of distrib-uted systems, and
e to make recommendations for potential development of distrib-uted architectures for Mars surface exploration and for further work.
The overall success criteria of these objectives is whether the col-lective results prove useful in evaluating system design alternatives for Martian surface exploration or demonstrating useful mecha-nisms for supporting future human and robotic explorers.
1.4 Overview of Methods
Several methods were utilized to examine the multiple facets of the research objectives:
* A review of the existing literature was conducted.
System Engineering
Characterize Evaluate Implemert
Proposed ---- Sytmyse
Architectures System System
System Architecting
Develop Operational
Concepts
System Flexibility and Robustness
FIGURE 1-2. Architectures must be characterized at the system and element level, trades must be conducted, and
operational concepts must be developed in
order to demonstrate how distributed systems might achieve flexibility and robustness. Characterize 0 System Perform Trade Characte4rize Studies Elements