HAL Id: hal-00329431
https://hal.archives-ouvertes.fr/hal-00329431
Submitted on 14 Oct 2005
HAL is a multi-disciplinary open access
archive for the deposit and dissemination of
sci-entific research documents, whether they are
pub-lished or not. The documents may come from
teaching and research institutions in France or
abroad, or from public or private research centers.
L’archive ouverte pluridisciplinaire HAL, est
destinée au dépôt et à la diffusion de documents
scientifiques de niveau recherche, publiés ou non,
émanant des établissements d’enseignement et de
recherche français ou étrangers, des laboratoires
publics ou privés.
Comparison of DMSP cross-track ion drifts and
SuperDARN line-of-sight velocities
R. A. Drayton, A. V. Koustov, M. R. Hairston, J.-P. Villain
To cite this version:
R. A. Drayton, A. V. Koustov, M. R. Hairston, J.-P. Villain. Comparison of DMSP cross-track ion
drifts and SuperDARN line-of-sight velocities. Annales Geophysicae, European Geosciences Union,
2005, 23 (7), pp.2479-2486. �hal-00329431�
SRef-ID: 1432-0576/ag/2005-23-2479 © European Geosciences Union 2005
Annales
Geophysicae
Comparison of DMSP cross-track ion drifts and SuperDARN
line-of-sight velocities
R. A. Drayton1, A. V. Koustov2, M. R. Hairston2, and J.-P. Villain3
1Institute of Space and Atmospheric Studies, University of Saskatchewan, Saskatoon, Canada 2William B. Hanson Center for Space Sciences, University of Texas at Dallas, USA
3Centre National de la Recherche Scientifique, Orleans, F-45045, France
Received: 1 March 2005 – Revised: 1 June 2005 – Accepted: 20 June 2005 – Published: 14 October 2005
Abstract. Cross-track ion drifts measured by the DMSP
satellites are compared with line-of-sight SuperDARN HF velocities in approximately the same directions. Good over-all agreement is found for a data set comprising of 209 satel-lite passes over the field of view of nine SuperDARN radars in both the Northern and Southern Hemispheres. The slope of the best linear fit line relating the SuperDARN and DMSP velocities is of the order of 0.7 with a tendency for Super-DARN velocities to be smaller. The agreement implies that the satellite and radar data can be merged into a common set provided that spatial and temporal variations of the velocity as measured by both instruments are smooth.
Keywords. Ionosphere (Ionospheric irregularities; Plasma
convection; Auroral ionosphere)
1 Introduction
Observations of ionospheric plasma convection at high lati-tudes is important for understanding various processes occur-ring in the Earth’s magnetosphere-ionosphere system. Over the last decade, local convection measurements with inco-herent scatter radars (ISRs) and more extended observa-tions with drift meters onboard polar-orbiting satellites have been successfully complemented by global-scale observa-tions with the coherent SuperDARN HF radars. Merging data from these instruments into a single set allows one to create a more reliable high-latitude convection pattern than could be produced by any individual data set. This is evident from the fact that the above instruments typically measure convection at distinctly different magnetic latitudes and/or magnetic local times.
While considering data from various convection-monitoring instruments, one has to be sure that the data are compatible. In this respect, there are several difficulties,
Correspondence to: R. A. Drayton
(rad626@mail.usask.ca)
stemming from the different spatial and temporal resolutions of the instruments. For example, ISRs measure plasma flow in F-region areas of ∼10 km in diameter with temporal resolution of 1–5 min. The SuperDARN radars measure the line-of-sight (l-o-s) velocity with spatial and temporal resolutions of ∼45×100 km (at typical F-region ranges) and
∼7 s respectively, but the raw data are then merged into one block to produce a convection map under the assumption of a stable convection pattern over 2 min. Because of the above differences, one would inevitably encounter differences between convection estimates from instruments operating simultaneously, even for observations in the same area of the high-latitude ionosphere. Indeed, recent comparisons of joint SuperDARN and ISR convection observations (Milan et al., 1999; Davies et al., 1999, 2000; Xu et al., 2001; Danskin, 2003) showed overall consistency but with notice-able data spread; for some events, almost perfect agreement was reported (Davies et al., 1999; Danskin, 2003) while for others significant differences were obvious (Xu et al., 2001; Danskin, 2003). These findings are in agreement with earlier ISR-HF radar comparisons by Villain et al. (1985) and Ruohoniemi et al. (1987).
It is not clear how satellite drift meter measurements com-pare against various ground-based convection measurements, because systematic inter-comparisons have not been reported in the past. Baker et al. (1990) compared the Goose Bay l-o-s velocities with the DMSP ion drifts for one pass and showed that the radar velocities were close to the ion drifts (their Fig. 3). Xu (2003) selected 40 DMSP passes over the Saskatoon-Kapuskasing radar pair field of view and showed that both the merge (Greenwald et al., 1995) and Map Poten-tial (Ruohoniemi and Baker, 1998) techniques give convec-tion estimates in agreement with the DMSP cross-track ion drifts. Xu (2003) noticed that for large electric fields, the Su-perDARN velocities were somewhat smaller than concurrent DMSP ion drifts, but no further investigation of the reason for these differences was undertaken.
2480 R. A. Drayton et al.: DMSP ion drift and HF velocity
Clearly, an assessment of joint convection data obtained for various simultaneously operating systems would improve knowledge on the quality of the global convection pattern specification.
In this paper, we undertake a systematic assessment work on DMSP and SuperDARN convection measurements. We consider DMSP ion drifts and SuperDARN convection at the raw data level, namely we compare the cross-track DMSP ion drifts (this component is measured most reliably) and the SuperDARN l-o-s velocities. For such a comparison, we do not make any assumption on the variation of the HF velocity with the azimuth (typically it is assumed to be of the cosine type), radar data filtering and post-processing is not involved so that one would expect the best agreement, as the only rea-son for differences could be the different spatial and temporal resolutions of the instruments, provided the F-region irregu-larities do move with the ExB velocity.
2 Approach to the comparison and event selection
We consider routine SuperDARN l-o-s data gathered in the standard mode of operation at various locations in the North-ern and SouthNorth-ern Hemispheres and DMSP ion drift data av-eraged over 4 s. We remind the reader that in the standard mode each SuperDARN radar scans sequentially through 16 beam directions over either 1 or 2 min with a dwelling time in each beam position of 3 or 7 s. For each beam position, echo power, Doppler velocity and spectral width are pro-duced in 75 radar cells 45 km apart, starting from a range of 180 km. The procedures for determining these parameters were described by Villain et al. (1987). Only measurements for which the echo power was more than 3 dB were consid-ered in this study; most echoes were significantly stronger than this threshold. We only considered echoes with a spec-tral width of less than 500 m/s. In addition, echoes with an uncertainty in velocity determination of more than 150 m/s were not considered. An error in the velocity fit was accepted as the uncertainty of its determination. Such restrictions to the data set helped to eliminate untypical echoes.
For the DMSP data, we considered 4-s averaged cross-track ion drift component values measured by the ion drift meter (IDM) onboard the satellite. The IDM is designed to work in predominately O+plasma. When the percentage of H+or He+in the plasma increases above 15%, the IDM is compromised and the data are not reliable. For this reason, each 4-s averaged data point is assigned a quality tag of 1 (measurement is reliable), 2 (measurement is questionable, use with caution), 3 (measurement is poor), or 4 (measure-ment quality is undetermined). Quality tag assign(measure-ment is based on the presence of data within a 4 s interval, plasma density, and the portion of O+in the plasma. Data points as-signed a poor quality tag were discarded in this analysis. For some events, a number of points with the quality flag speci-fied as “undetermined” were still accepted if the spatial vari-ation of the ion drift along the satellite track was smooth so that these points seemed to be very consistent with the ones
of good quality. We also did not consider those events for which there was a transition of the DMSP drift polarity along the pass near the area of comparison because for such cases the velocity differences can easily be explained by different spatial resolutions of the instruments. Originally, we allowed various degrees of misalignment between the DMSP cross-track direction and the SuperDARN radar beam, but the fi-nal statistics included only those measurements for which the difference was less than 5◦.
Although the DMSP satellites are on polar orbits and the SuperDARN radars operate continuously, the identification of joint satellite/radar events is not an easy task. In the stan-dard mode of operation, every SuperDARN radar scan starts exactly at the beginning of each minute (one minute scan) or at the beginning of every two minute interval (two minute scan). Certainly, one would not have a perfect match of radar and satellite measurements in terms of time. We selected the criterion for the proximity of the radar and satellite measure-ments in terms of time as the time difference between the measurements to be less than one (two) minute; this is con-sistent with 1–(2-)min inherent resolution of the SuperDARN convection maps.
One would certainly not expect a perfect match of the DMSP and radar measurements in terms of space. The DMSP satellite sampled every ∼7.5 km/s×4 s=30 km while the size of a radar cell at a range of ∼1440 km from the radar, which is the average slant range for the l-o-s velocities considered in this comparison, is ∼45 km×80 km. The slant range is the distance from the radar to the center of the radar cell. It was assumed that the echo height was 300 km. To compare the radar and satellite data, the following procedure was implemented. First, the DMSP ion drift data were as-signed to corresponding footprints of the satellite at a height of 300 km. For mapping along the magnetic field lines, the IGRF model was used. Then, for every selected radar cell with echo power stronger than 3 dB and spectral width less than 500 m/s, the DMSP points separated from the center of the radar cell by not more than 45 km were identified. Typ-ically, at least 3 DMSP points were available. These were averaged to obtain the DMSP ion drift, and the standard de-viation of measurements was considered as an estimate of the uncertainty of the DMSP ion drift. Only points with a stan-dard deviation less than 150 m/s were considered. The se-lected separation of 45 km is comparable with the azimuthal extent of a radar beam. The above assumptions imply that the DMSP data were actually averaged over 12–16 s versus 3 or 7 s for SuperDARN, the data can be up to 2 min apart in terms of time, and the effective spatial resolution of the instruments is comparable.
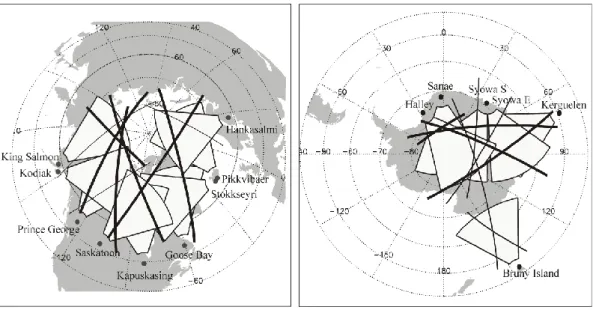
There was another factor significantly limiting the num-ber of joint DMSP – SuperDARN events. Typically, the satellites do not exactly cross the radars’ beams perpendicu-larly. Figure 1 gives an example of DMSP F15 tracks in both hemispheres (mapped down to 300 km) and the SuperDARN radars’ FoVs between ranges of 400 km and 2800 km (at a height of 300 km). Passes potentially useful for the compari-son with radar observations are shown by thick lines. Clearly,
Fig. 1. SuperDARN radars’ field of views between 400 and 2800 km in (a) Northern and (b) Southern Hemispheres and footprints (at a
height of 300 km) of DMSP F15 satellites. The trajectories represented by thick lines are potentially useful for cross-track ion drift velocity comparison with SuperDARN line-of-sight velocities.
the Kapuskasing and Goose Bay radars in the Northern Hemisphere and the Kerguelen and Tiger radars in the South-ern Hemisphere can not be considered for comparison. In this study we considered 9 radars: Hankasalmi, Pykkvibaer, Stokkseyri, Saskatoon and Kodiak in the Northern Hemi-sphere and Halley, Sanae, Syowa-South, Syowa-East in the Southern Hemisphere. For the Kodiak radar, the DMSP satellite passed over the radar’s field of view at two dis-tinctly different range bands of approximately 1100 km and 2300 km. We considered both ranges to explore a potentially important range effect.
Another limiting factor in building the joint database was the occurrence of SuperDARN echoes for a specific DMSP crossing. The satellites appear in the radars’ FoVs every
∼100 min but often there are no echoes or they are of poor quality. To achieve reasonable data statistics, observations over two-three years of each radar operation (1999–2002) were considered by sequential search through the Super-DARN quick-look plots. Our goal was to select about 20 passes (for each radar) with reasonable quality.
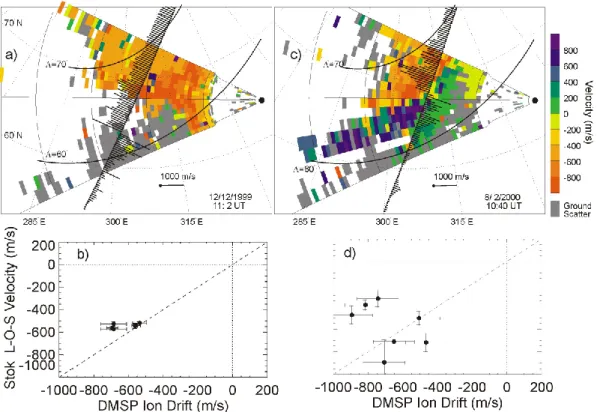
Figure 2 gives two examples of joint radar-satellite mea-surements. Here individual Stokkseyri l-o-s velocities (col-ored boxes with the color scheme presented to the right of panel (c)) measured at various cells are plotted in geo-graphic coordinates together with the DMSP F13 cross-track ion drifts over the radar’s field of view. The time shown in the diagrams indicates the beginning of the two minute pe-riod of the SuperDARN scan. In both examples, the DMSP satellite crosses the radar’s field of view at the approximate time of the scan. At 11:02 UT on 12 December 1999 the Doppler velocity varies relatively smooth in the area of com-parison, panel (a), the velocities at corresponding data points (selected as described above) are very comparable and
clus-ter around the bisector of ideal agreement, panel (b). For the event of 8 February, 2000 at 10:40 UT, the velocity map is much more patchy, and the velocities measured by the radar and satellite are not as consistent; two points are in good agreement, two other points lie below the bisector and the last three points are located above the bisector.
Figures 3 and 4 give statistical characteristics of radar echoes for which the comparison with DMSP measurements was carried out. There were echoes in most local time sectors (exception is the morning sector of 0400–0800 MLT) and magnetic latitudes 65◦–82◦in the Northern Hemisphere and 67◦–78◦in the Southern Hemisphere, Fig. 3. Typical echoes power was ∼19 dB S/N, Fig. 4a. A velocity span of 0– 1000 m/s was achieved with the mean velocity magnitude of
∼330 m/s, Fig. 4b. The typical spectral width was ∼140 m/s, Fig. 4c, and echoes were observed between ∼800 km and 2800 km with an average slant range of 1560 km, Fig. 4d. These values are typical for F-region SuperDARN echoes.
3 Comparison for the Stokkseyri radar
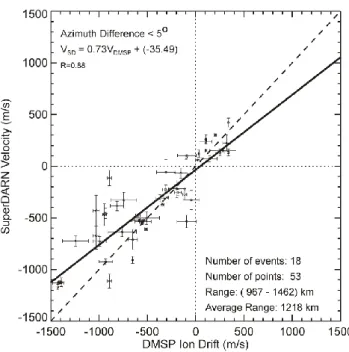
To show how the radar-satellite data compare for an indi-vidual radar, we consider Stokkseyri-DMSP observations, Fig. 5. Figure 5 is a scatter plot of the Stokkseyri l-o-s veloc-ity versus the DMSP ion drift for 18 events. Only those radar and satellite measurements were considered for which the az-imuth difference between the radar beam and the cross-track directions was less than 5◦. Here, and for other radars as well, we imposed additional restriction: we considered only those radar echoes whose velocity magnitude was larger than 50 m/s. SuperDARN echoes with low velocities often show the presence of ionospheric and ground scattered (almost
2482 R. A. Drayton et al.: DMSP ion drift and HF velocity
Fig. 2. Two examples of a SuperDARN/DMSP velocity comparison. (a) A Stokkseyri l-o-s velocity map for a 11:02 UT with over-plotted
DMSP cross-track ion drifts for the event of 12 December, 1999. (b) A scatter plot of the radar velocity versus the ion drift for the radar cells in panel (a) with a difference between the radar and satellite directions of less than 5◦and the difference in time of less than 2 min. Panels
(c) and (d) show the same, but for the event of 8 February, 2002 at 10:40 UT. In both examples, the DMSP satellite crosses the radar’s field
of view at the approximate time of the scan.
Fig. 3. Histogram distributions of the magnetic local times (panel (a)) and ACCGM magnetic latitudes (panels (b) and (c) for the
Northern and Southern Hemispheres, respectively) for SuperDARN echoes selected for a comparison with DMSP measurements.
zero velocity) signals. By excluding echoes with velocities less that 50 m/s we made sure that the signals we considered correspond to true ionospheric scatter.
A total of 53 points are available. One can see that the points are clustered around the bisector (dashed line) of per-fect agreement; some of them are located significantly away from the bisector. Importantly, the points deviate both above and below the line of perfect agreement. For two points, in
the second quadrant, the velocity polarities are different; sim-ilar points are present in other comparisons and they very likely correspond to very localized areas with completely different plasma flows and are therefore not considered in the statistics presented in Fig. 3, Fig. 4, or in determining the line of best fit. If one were to describe the scatter plot by a linear dependence, the line of the best fit (solid line) is VSD=0.73 VDMSP−35.5 (m/s) implying a tendency for the Stokkseyri l-o-s velocity to be smaller than the DMSP ion drift. However, the effect is not recognizable in the plot un-less large ion drifts VDMSP>800 m/s are considered.
4 Statistical assessment for all considered radars
In Fig. 6 we present statistics for all 9 radars by applying the same criteria as for the Stokkseyri comparison of Sect. 3. Totals of 746 points in 209 events are available. Figure 6 is consistent with the Stokkseyri results of Fig. 5; there is a rea-sonable agreement between the measurements and the points are spread around the bisector. The line of the best linear fit (solid line) is VSD=0.72 VDMSP+3.37 (m/s) which is close to the one for the Stokkseyri radar. We should say that other radars showed some variability in the slope of the best fit line; Table 1 summarizes the findings. The best agreement with DMSP was found for the Syowa-East radar, not only
Fig. 4. The histogram distributions of the SuperDARN radar (a)
echo power, (b) velocity magnitude, (c) spectral width and (d) slant range for all events selected for a comparison with DMSP.
in terms of the slope of the best fit line (S=0.87), but also in terms of the data spread characterized by the correlation coefficient R (R=0.93). The worst agreement was found for the Halley radar, both in terms of the slope (S=0.49) and the correlation coefficient R (R=0.55). Low slope of the best fit line was also found for the Sanae radar. We notice that for both these radars the comparison was performed for rel-atively low ranges of <1200 km. We assessed the quality of satellite-radar data agreement for intermediate and far radar ranges by splitting the data set into three groups, <1200 km, 1200–2000 km, and >2000 km. We found that the agreement is the best for the intermediate ranges. The Kodiak radar data alone show better agreement for high ranges of ∼2300 km as compared to low ranges of ∼1100 km.
5 Discussion
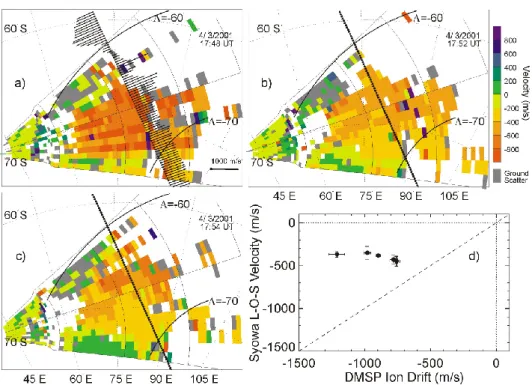
The SuperDARN/DMSP velocity comparison presented in this study shows, on a statistical basis, that in spite of dif-ferent methods of plasma flow measurements, in space and from the ground, the velocities are fairly consistent in a broad sense. There is some data spread, but it can be explained by the time differences in measurements and different spa-tial and temporal resolutions of the instruments. We have already demonstrated in Fig. 2 that the general consistency of the data is much better if the flow is spatially uniform. To illustrate the importance of the flow stability in terms of time, we present observations at Syowa East, Antarctica on 4 March, 2001, Fig. 7. Figure 7a shows the l-o-s velocity map for the scan 17:48 UT over-plotted with DMSP
veloc-Fig. 5. A scatter plot of the Stokkseyri l-o-s velocity versus the
DMSP cross-track ion drift for 18 joint events at radar ranges of
∼1000–1500 km.
Fig. 6. The same as in Fig. 5 but for 9 radars: Hankasalmi, Pikkvibaer, Stokkseyri, Saskatoon, Kodiak, Halley, Sanae, Syowa-South and Syowa–East and various radar ranges.
ity vectors. This scan was 4 min earlier than the scan for which the comparison with the DMSP data was performed (at 17:52 UT). The DMSP data were plotted on this panel for the convenience of viewing and have been omitted in panels (b) and (c). Figures 7b and c show the Sanae data for scans at 17:52 and 17:54 UT. One can notice that in the area of the comparison, the l-o-s velocities were generally smaller at
2484 R. A. Drayton et al.: DMSP ion drift and HF velocity
Table 1. Information on number of events and points available, typical ranges, and the slope of the best fit line between SuperDARN and
DMSP velocities for various radars
Radar Events Points Range (km) Slope R
Halley 32 168 517–742 0.49 0.55 Sanae 19 85 967–1147 0.48 0.79 Kodiak (Low) 20 62 832–1327 0.6 0.81 Syowa South 22 71 1012–1372 0.79 0.76 Stokkseyri 18 53 967–1462 0.73 0.88 Syowa East 21 87 967–2047 0.87 0.93 Pykkvibaer 21 64 1327–1957 0.62 0.87 Saskatoon 22 56 1732–2857 0.58 0.77 Hankasalmi 17 51 1672–2137 0.59 0.82 Kodiak (High) 17 49 1957–2542 0.74 0.83 All 209 746 517–2857 0.72 0.9
Fig. 7. (a)−(c) Syowa-East l-o-s velocity maps for 17:48, 17:52 and 17:54 UT and the DMSP cross-track ion drift observed between ∼17:49
and 17:53 UT for the event of 4 March 2001. Panel (d) is a scatter plot of the radar velocity versus DMSP ion drift for the points in panel (b) with the difference between the radar and satellite directions of less than 5◦and the difference in time of less than 2 min.
17:52 UT (more light color) and larger again at 17:54 UT, meaning that significant temporal variations of the velocity had occurred. Since the time difference between the radar and satellite measurements was of the order of 120 s, one would expect lower radar velocity than the DMSP velocity, and the poor agreement of the radar and satellite data shown in Fig. 7d is not a surprise.
Importantly, the comparison performed in this study in-cluded various radars of the SuperDARN network; the radars use the same principle of measurements, but their hardware and on site observational conditions vary. The comparison was also performed for various radar ranges so that all possi-ble modes of radio wave propagation were considered. Sig-nificant coverage of magnetic latitudes and magnetic local time sectors was achieved. All the above means that the
DMSP and SuperDARN l-o-s velocities can be merged into one data set, provided that both instruments show reasonably smooth spatial and temporal variations. Such an approach is currently under development.
We noticed a minor tendency for the SuperDARN veloci-ties to be smaller than the DMSP ion drifts. Similar conclu-sions were drawn from a comparison of SuperDARN data with incoherent scatter radar (Xu et al., 2001) and CADI ionosonde (Xu, 2003) measurements. We should say that this tendency is easier detected if velocities larger than 500– 800 m/s are considered; if one includes only DMSP velocity magnitudes <500 m/s, the slope of the best fit line is 0.80. The total amount of such points is more than the number of points with large velocities (513 points versus 233) so that the significance of the SuperDARN “underestimation” effect is difficult to evaluate. Moreover, for the fast plasma flows, the data spread is somewhat enhanced for all comparisons so that a targeted investigation of large-velocity data needs to be performed. Unfortunately, such events occur rarely, and we leave this task for a separate study.
The explanation of the tendency for SuperDARN veloc-ities to be less than DMSP ion drifts seems to be difficult. One possibility is that, while we assumed that the electric field is mapped down from the satellite height of ∼840 km to 300 km without any attenuation, this might not be correct if the small-scale electric fields are involved (Kelley, 1989). The effect can be especially significant for the events with patchy and highly variable convection patterns. Though we did not consider obvious events of this category, some mi-nor convection variations could actually originate from par-tial shielding of the high-altitude electric field. Another pos-sibility is the SuperDARN ionospheric echo contamination with the ground scattered signals. This effect cannot be iden-tified by looking at FITACF data that we used in this study; a completely new approach with data processing of the full spectra is required which is beyond the scope of the present study. We attempted to check the quality of the SuperDARN spectra for some of the events with large DMSP velocity and strong discrepancy. Unfortunately, we are not able to draw a definite conclusion. For some events, the SuperDARN au-tocorrelation functions were not of great quality (for quality of the autocorrelation function see Villain et al. (1987)). For several other events, a strong ground scatter component was found; this could have affected the l-o-s velocity. For some of the points, the quality of DMSP data was questionable, as the data quality flag changed along the path.
Another factor that might be of importance for understand-ing the larger SuperDARN-DMSP differences at high DMSP drifts is the degree of the azimuthal difference between the radar and satellite directions of measurements. This is es-pecially important for observations at large angles with re-spect to the flow, which is typical for many radars. Perhaps, this notion can be supported by deterioration of the radar-satellite data agreement at larger radar ranges of the com-parison. We found the data clustering was R=0.92 at ranges 1200–2000 km and R=0.84 at ranges >2000 km. This is gen-erally expected since the radar localization of the echoing
region deteriorates at large ranges, especially when one and half propagation mode is involved.
To explore the effect further, we attempted to relax the 5◦ misalignment requirement. The results were very similar to the one presented in Fig. 6 except the data spread was more significant. For example, for 10◦ misalignment, the line of best linear fit is VSD=0.73 VDMSP+3.05 (m/s). We should note that the error in the alignment can be both positive and negative so that one would not expect a trend of smaller Su-perDARN l-o-s velocity as compared to the DMSP ion drift, unless the statistics are too small. We feel that our statistics are large enough and the observed trends are not originated from errors in the direction calculations.
The good agreement between the DMSP ion drifts and SuperDARN F-region velocities contrasts strongly with dis-agreement of the ion drifts and SuperDARN E-region veloc-ities (Koustov et al., 2005). For the E region echoes, low ve-locities were expected from the previous VHF observations since the electrojet irregularities may travel with the velocity significantly different from ExB. For example, the irregular-ity velocirregular-ity along the flow is close to the ion-acoustic speed. Luckily, the majority of SuperDARN radars observe mostly perpendicular to the electrojet; because of this, chances to get echoes with ion-acoustic speed from the E-region are not very high, even at very short ranges of <500 km. On the other hand, we might expect some E-region contamina-tion, especially for the low-range comparisons at Halley and Sanae (ranges <1000 km). We investigated several events for the Halley radar but did not find clear signatures of the E-region contamination so that the question remains open.
The comparison presented in this paper does not mean that SuperDARN l-o-s velocity measurements can be sim-ply merged with the DMSP ion drifts to produce a joint con-vection map. Our comparison has been done for periods for which both instruments had the best chances to be compat-ible. We identified a number of other events with signifi-cant differences, including opposite polarity of the velocities. We noticed that this happens when the SuperDARN echoes are patchy or changing in time, and/or when the DMSP drift measurements showed strong variability within the radars’ FoV. For such events, the spatial and temporal averaging are the major factors leading to the discrepancies.
6 Conclusions
In this paper we showed that for more than 200 DMSP passes over nine various SuperDARN radars’ field of view the DMSP cross-track ion drift agrees reasonably well with the line-of-sight velocity of the F-region SuperDARN echoes. The slope of the best linear fit line relating the SuperDARN and DMSP velocities is of the order of 0.7 with a tendency for SuperDARN velocities to be smaller. The comparison has been performed for conditions with smooth temporal and spatial variations on the plasma flow according to both in-struments; for strong variations, more significant differences were sometimes observed. The results imply that the DMSP
2486 R. A. Drayton et al.: DMSP ion drift and HF velocity
ion drift velocities with relatively smooth profiles over the trajectory can be merged with the concurrent SuperDARN F-region velocities to produce a joint convection map.
Acknowledgements. We acknowledge the support of the national funding agencies that made possible continuous operation of the SuperDARN radars considered in this study. This work has been supported by NSERC (Canada) grant to AVK. Critical comments by M. Pinnock are appreciated.
Topical Editor M. Pinnock thanks G. Provan and another referee for their help in evaluating this paper.
References
Baker, K. B., Greenwald, R. A., Ruohoniemi, J. M., Dudeney, J. R., Pinnock, M., Newell, P. T., Greenspan, M. E., and Meng, C.-I.: Simultaneous HF-radar and DMSP observations of the cusp, Geophys. Res. Lett., 17, 1869–1872, 1990.
Danskin, D. W.: HF backscatter from the F and E regions, PhD Thesis, U of Saskatchewan, Saskatoon, Canada, 2003.
Davies, J. A., Lester, M., Milan, S. E., and Yeoman, T. K.: A com-parison of velocity measurements from the CUTLASS Finland radar and the EISCAT UHF system, Ann. Geophys., 17, 892– 903, 1999,
SRef-ID: 1432-0576/ag/1999-17-892.
Davies, J. A., Yeoman, T. K., Lester, M., and Milan, S. E.: A com-parison of F region ion velocity observations from the EISCAT Svalbard and VHF radars with irregularity drift velocity mea-surements from the CUTLASS Finland HF radar, Ann. Geo-phys., 18, 589–594, 2000,
SRef-ID: 1432-0576/ag/2000-18-589.
Greenwald, R. A., Baker, K. B., Dudeney, J. R., Pinnock, M., Jones, T. B., Thomas, E. C., Villain, J.-P., Cerisier, J.-C., Senior, C., Hanuise, C., Hunsuker, R. D., Sofko, G., Koehler, J., Nielsen, E., Pellinen, R., Walker, A. D. M., Sato, N., and Yamagishi, H.: DARN/SuperDARN: A global view of the dynamics of high-latitude convection, Space Sci. Rev., 71, 763–796, 1995.
Kelley, M. C.: The Earth’s Ionosphere, Academic Press, San Diego, California, 1989.
Koustov, A. V., Danskin, D. W., Makarevitch, R. A., and Gorin, J. D.: On the relationship between the velocity of E-region HF echoes and ExB plasma drift, Ann. Geophys., accepted, 2005. Milan, S. E., Davies, J. A., and Lester, M.: Coherent HF radar
backscatter characteristics associated with auroral forms identi-fied by incoherent radar techniques: A comparison of CUTLASS and EISCAT observations, J. Geophys. Res., 104, 22 591–22 604, 1999.
Ruohoniemi, M. and Baker, K. B.: Large-scale imaging of high-latitude convection with Super Dual Auroral Radar Network HF radar observations, J. Geophys. Res., 103, 20 797–20 811, 1998. Ruohoniemi, J. M., Greenwald, R. A., Baker, K. B., Villain, J.-P., and McCready, M. A.: Drift motions of small-scale irregularities in the high-latitude F region: An experimental comparison with plasma drift motions, J. Geophys. Res., 92, 4553–4564, 1987. Villain, J.-P., Caudal, G., and Hanuise, C.: A SAFARI-EISCAT
comparison of F region small-scale irregularities and the ion drift, Ann. Geophys., 90, 8433-8443, 1985.
Villain, J. P., Greenwald, R. A., Baker, K. B., and Ruohoniemi, J. M.: HF radar observations of E region plasma irregularities produced by oblique electron streaming, J. Geophys. Res., 92, 12 327–12 342 , 1987.
Xu, L.: SuperDARN-derived plasma convection: Comparison with other data and application to field-aligned current measurements, PhD Thesis, U of Saskatchewan, Saskatoon, Canada, 2003. Xu, L., Koustov, A. V., Thayer J., and McCready, M.: SuperDARN
convection and Sondrestrom plasma drift, Ann. Geophys., 19, 749–759, 2001,