Effect of Mass Ratio on the Vortex-Induced
Vibrations of a Long Tensioned Beam in Shear Flow
The MIT Faculty has made this article openly available. Please share
how this access benefits you. Your story matters.
Citation
Bourguet, Re#mi, Didier Lucor, and Michael S. Triantafyllou. “Effect
of Mass Ratio on the Vortex-Induced Vibrations of a Long Tensioned
Beam in Shear Flow.” ASME 2010 7th International Symposium on
Fluid-Structure Interactions, Sound Interactions, and
Flow-Induced Vibration and Noise, 1-5 August, 2010, Montreal, Quebec,
Canada, ASME, 2010. © 2010 ASME
As Published
http://dx.doi.org/10.1115/FEDSM-ICNMM2010-30096
Publisher
ASME International
Version
Final published version
Citable link
http://hdl.handle.net/1721.1/120742
Terms of Use
Article is made available in accordance with the publisher's
policy and may be subject to US copyright law. Please refer to the
publisher's site for terms of use.
Proceedings of ASME 2010 3rd Joint US-European Fluids Engineering Summer Meeting and 8th International Conference on Nanochannels, Microchannels, and Minichannels FEDSM-ICNMM 2010 August 1-5, 2010, Montreal, Quebec, Canada
FEDSM-ICNMM2010-30096
EFFECT OF MASS RATIO ON THE VORTEX-INDUCED VIBRATIONS OF A LONG
TENSIONED BEAM IN SHEAR FLOW
R ´emi Bourguet∗
Massachusetts Institute of Technology Cambridge, MA 02139, USA
Email: bourguet@mit.edu
Didier Lucor
Institut Jean le Rond d’Alembert Paris, 75252, France Email: didier.lucor@upmc.fr
Michael S. Triantafyllou
Massachusetts Institute of Technology Cambridge, MA 02139, USA
Email: mistetri@mit.edu
ABSTRACT
The flow past a cylindrical tensioned beam of aspect ra-tio 200 is predicted by direct numerical simulara-tion of the three-dimensional Navier-Stokes equations. The beam is free to oscil-late in inline and crossflow directions and submitted to a linearly sheared oncoming flow. The ratio between high and low inflow velocities is 3.67, with a maximum Reynolds number of 330. Two
structure/fluid mass ratios are considered, 6 and 3. Structure vortex-induced vibrations are characterized by mixed standing-traveling wave patterns. A reduction of mass ratio from 6 to 3 leads to purer, more pronounced traveling wave responses and larger amplitude vibrations in both directions. While multifre-quency structure vibrations are observed at m= 6, case m = 3
exhibits monofrequency responses. A large zone of synchroniza-tion between vortex shedding and structure vibrasynchroniza-tion (lock-in) is identified in the high velocity region. The topology of fluid-structure energy exchanges shows that the flow can excite the structure at lock-in and damps its vibrations in non-lock-in re-gion. Inline/crossflow motion synchronization is monitored. Sim-ilar zigzagging patterns of inline/crossflow motion phase differ-ence are put forward for both mass ratios, highlighting a pre-dominant character of counterclockwise orbits in the excitation region.
INTRODUCTION
Vortex-Induced Vibrations (VIV) of long flexible structures are an important issue in the domain of applications and
es-pecially in the context of ocean engineering where a reliable estimation of fatigue damage implies an efficient prediction of this phenomenon. Several experimental works have emphasized the high physical complexity of this fluid-structure interaction problem, even in the idealized case of an elastically mounted rigid cylinder, as reviewed in Bearman (1984); Sarpkaya (2004); Williamson & Govardhan (2004).
The present numerical study focuses on the VIV of a long cylindrical tensioned beam free to oscillate in inline and cross-flow directions in a linear shear cross-flow, during the transition to turbulence. The objectives of this work are to quantify the in-fluence of structure/fluid mass ratio on the nature of structure response and to examine its effects on lock-in phenomenon and fluid-structure energy exchanges.
Previous experimental studies concerning flexible cylinders in shear flow have underlined the possible occurrence of vibra-tions at a single or multiple frequencies (e.g. Kim et al., 1986; Vandiver et al., 1996; Trim et al., 2005). In this physical context, structure responses characterized by mixed standing-traveling wave patterns have been reported (Lucor et al., 2006; Vandiver
et al., 2009). The influence of the shear rate of the oncoming flow
on lock-in has been emphasized by Vandiver et al. (1996). It has been shown in particular that strong shear can inhibit lock-in at multiple frequencies. The importance of the mass ratio on VIV phenomenon has been highlighted by Govardhan & Williamson (2002) in the case of an elastically mounted rigid cylinder, con-cerning especially the bandwidth of lock-in. In the present study, the influence of the mass ratio is investigated in the case of a flexible cylinder in shear flow with an emphasis on its effects Proceedings of the ASME 2010 3rd Joint US-European Fluids Engineering Summer Meeting and
8th International Conference on Nanochannels, Microchannels, and Minichannels FEDSM-ICNMM2010 August 1-5, 2010, Montreal, Canada
on the above mentioned standing-traveling wave pattern and on mono-/multifrequency response development.
The physical model and numerical method are briefly de-scribed in the two first sections. The influence of mass ratio on structure response is examined in a third section and this analysis is related to fluid-structure interaction considerations in a fourth section. The main findings of this study are summarized in a fifth section.
PHYSICAL MODEL
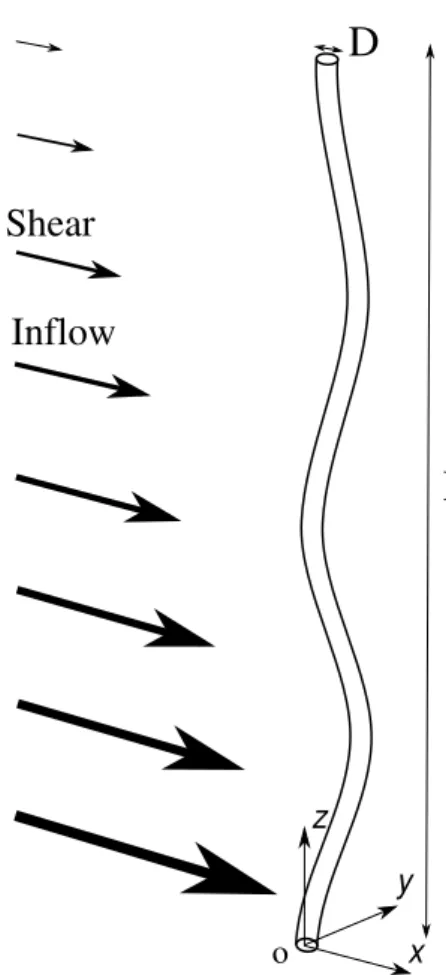
The flow past a flexible cylinder is predicted by direct nu-merical simulation of the three-dimensional Navier-Stokes equa-tions under incompressibility assumption. The structure is sub-mitted to a crossflow parallel to x axis and linearly sheared along its span (z axis) as illustrated in figure 1. All physical variables are non-dimensionalized using the cylinder diameter D and the maximum inflow velocity U , located at z= 0. These reference
quantities are used to define the Reynolds number. The ratio be-tween maximum and minimum inflow velocity is 3.67. The local
Reynolds number (Re) ranges from 330 to 90. The cylinder as-pect ratio is L/D = 200, where L is its length in equilibrium
posi-tion. The shear rate can be defined byβ= (D/Um)∂u/∂z where Umis mean oncoming flow velocity and u the local component
of flow velocity parallel to x axis,β= 0.0062 in the present case.
The cylinder is pinned at both ends and free to move in-between in x and y directions referred to as inline and crossflow direc-tions in the following. The structure dynamics is governed by a tensioned beam model that can be expressed as follows in the non-dimensional formulation proposed by Evangelinos & Karni-adakis (1999): ∂2ζ δt2 −ω 2 c ∂2ζ δz2 +ω 2 b ∂4ζ δz4 + K m ∂ζ δt = 1 2 C m, (1)
where ζ = [ζx,ζy]T with ζx and ζy, the inline and crossflow
displacements of the cylinder, and C= [Cx,Cy]T, with Cxand Cy
the total drag and lift coefficients including both pressure and viscous contributions. t denotes time variable. The mass ratio is defined by m=ρc/ρfD2whereρcis the cylinder density per
unit length andρf the fluid density. It quantifies the cylinder
mass over the displaced fluid mass. Two mass ratios, 6 and 3, are considered in this study.ωcandωbare associated with the cable
and beam terms and defined byωc2= T /m andω2
b= EI/m. T
and EI are the constant non-dimensional tension and bending stiffness of the structure, ωc andωb are also non-dimensional.
A tensioned beam withωc= 4.55 andωb= 9.09 is considered.
As shown in the following, these structural parameters lead to vibrations involving high structural modes representative of realistic configurations similar to the experimental study of Trim
et al. (2005). The structural damping is neglected (K= 0) to
x
y
z
Inflow
D
L
Shear
o
FIGURE 1. SKETCH OF THE PHYSICAL CONFIGURATION.
allow maximum amplitude oscillations.
NUMERICAL METHOD
The coupled fluid-structure system is solved by the paral-lel code Nektar that is based on the spectral/hp element method (Karniadakis & Sherwin, 2005). This version of the code em-ploys a hybrid scheme with Fourier expansion in spanwise z direction and Jacobi-Galerkin formulation on (x, y) planes. A
boundary-fitted coordinate formulation is used to take into ac-count the cylinder unsteady deformation. Details regarding time integration schemes and validation studies of the numerical method and parameters have been reported in Newman & Kar-niadakis (1997); Evangelinos & KarKar-niadakis (1999) concerning similar physical configurations. The computational domain ex-tends 50D downstream and 20D in front, above and below the cylinder. A two-dimensional grid of 2175 elements with poly-nomial order p= 7 is used on (x, y) planes. In z direction, 1024
planes (512 complex Fourier modes) are used. Fourier expansion implies spanwise periodicity of the flow and structure variables and of the imposed shear velocity profile. The technique
gested by Lucor (2004) is adopted here. A buffer region of 8% of the cylinder length (16D) where the inflow velocity profile is adjusted to respect periodicity is considered in agreement with the recommendations of Lucor et al. (2006). The buffer region is not presented in the following. Numerical tests concerning the boundary conditions, computational domain and buffer re-gion sizes have been performed in the above mentioned studies.
The analysis reported in this study is based on the monitor-ing of time series of more than 300 convective time units (t⋆U/D
with t⋆the dimensional time variable) once the permanent regime is reached, with a non-dimensional sampling frequency equal to 40.
STRUCTURE VIBRATIONS
The effect of mass ratio on structure vibrations is examined in this section. Spatio-temporal evolutions of inline and cross-flow cylinder displacements are quantified and a spectral analysis is provided to identify the influence of mass ratio on the nature of structure response. Finally, the synchronization of inline and crossflow vibrations is studied with a special attention paid to the fundamental features persisting as mass ratio changes.
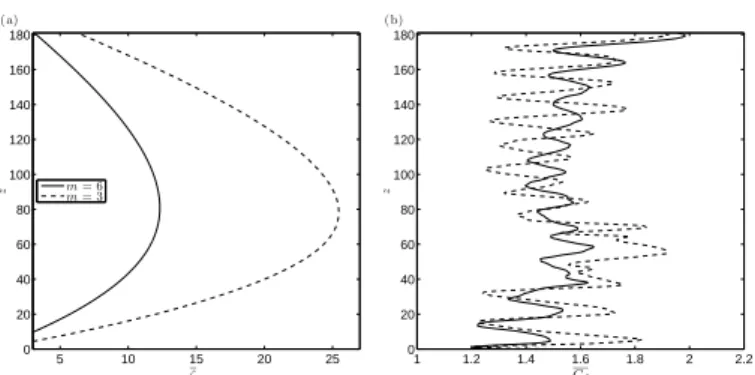
Time-averaged inline bending
The time-averaged inline displacement of the cylinder is pre-sented in Fig. 2 as well as the time-averaged drag coefficient. In this plot, the drag is normalized by the local oncoming flow ve-locity. As expected from expression (1), cylinder bending in-creases as mass ratio is reduced. In both cases, the cylinder exhibits an asymmetric deformation due to shear flow, with a maximum displacement located near z= 80. Such asymmetric
deformation has been observed experimentally by Chaplin et al. (2005) for a cylinder submitted to a stepped current, for exam-ple. Structure inline bending modifies the oncoming flow veloc-ity normal to the cylinder. More precisely, for z∈ [0, 80]
approx-imately, the relative weight of the velocity component normal to the cylinder increases as z increases, opposing the effect of shear flow. For z> 80, structure bending can reinforce the effect
of shear flow by reducing the component normal to the cylinder as z increases. The mean drag coefficient presents larger spatial fluctuations at m= 3. A larger spatial average of this coefficient
in region z∈ [0, 80] (z > 80) is observed at m = 3 (m = 6
re-spectively). The spatial evolution of the mean drag coefficient is strongly influenced by the structure response discussed in the following.
Spatio-temporal patterns
Selected time series of inline and crossflow displacements are presented along cylinder span in Fig. 3 and 4, once the per-manent regime of the coupled fluid-structure system is reached. In these plots the temporal fluctuation of inline motion ˜ζxabout
5 10 15 20 25 0 20 40 60 80 100 120 140 160 180 ζx z m = 6 m = 3 (a) 1 1.2 1.4 1.6 1.8 2 2.2 0 20 40 60 80 100 120 140 160 180 Cd z (b)
FIGURE 2. TIME-AVERAGED (a) INLINE DISPLACEMENT
AND (b) DRAG COEFFICIENT ALONG CYLINDER SPAN.
its mean deformation is considered. From a general and qual-itative point of view, structure responses are characterized by a mixed combination of standing and traveling waves. The travel-ing character of the vibrations seems more pronounced in inline direction and preferentially oriented from high oncoming flow velocity region to low velocity region (increasing z). A strong standing wave character dominates the region near z= 0 in both
directions and for both mass ratios until approximately z= 40.
It can be observed that in inline direction, this standing wave pattern is reinforced in this region at m= 3, which can be related
to the above mentioned increased inline bending of the cylin-der (Fig. 2 (a)). Beyond this region, stronger traveling wave responses develop. Reducing the mass ratio leads to purer travel-ing wave responses. This point is examined quantitatively in the following. It should be noticed that at m= 6, structure reponses
exhibit significant temporal irregularities that almost vanish at
m= 3. This is related to the occurrence of multifrequency
vibra-tions as discussed in next section.
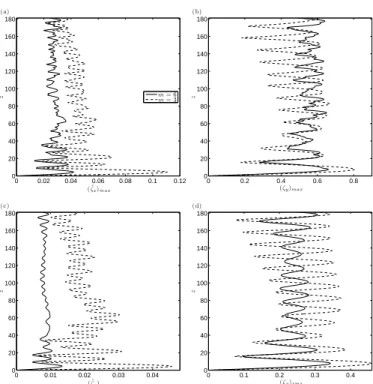
Statistics
Maximum and Root Mean Square (RMS) values of the dis-placements along cylinder span are plotted in Fig. 5. The in-fluence of the standing wave character of structure responses is visible in all cases as illustrated by the alternance of nodes and anti-nodes. However, the fact that RMS values of displacements at nodes are not zero emphasizes the effect of traveling wave pattern. Except in the first spanwise cell, it appears that anti-node amplitudes remain relatively constant along cylinder span, in spite of the shear flow.
The reduction of mass ratio from 6 to 3 leads to larger vi-bration amplitudes in both directions in average (RMS values). The maximum amplitudes of crossflow vibrations are however very close which illustrates the irregular character of structure re-sponse at m= 6. In addition, it is interesting to notice that
ampli-tudes between adjacent node and anti-node is generally smaller
at m= 6. Successive changes of predominant excited structural
Time z 0 5 10 15 20 25 30 35 40 45 50 0 20 40 60 80 100 120 140 160 180 ˜ ζx −0.025 −0.02 −0.015 −0.01 −0.005 0 0.005 0.01 0.015 0.02 0.025 (a) Time z 0 5 10 15 20 25 30 35 40 45 50 0 20 40 60 80 100 120 140 160 180 ˜ ζx −0.06 −0.04 −0.02 0 0.02 0.04 0.06 (b)
FIGURE 3. TEMPORAL EVOLUTION OF INLINE
DISPLACE-MENT FLUCTUATION ALONG CYLINDER SPAN FOR (a) m= 6 AND (b) m= 3. Time z 0 5 10 15 20 25 30 35 40 45 50 0 20 40 60 80 100 120 140 160 180 ζy −0.6 −0.4 −0.2 0 0.2 0.4 0.6 (a) Time z 0 5 10 15 20 25 30 35 40 45 50 0 20 40 60 80 100 120 140 160 180 ζy −0.6 −0.4 −0.2 0 0.2 0.4 0.6 (b)
FIGURE 4. TEMPORAL EVOLUTION OF CROSSFLOW
DIS-PLACEMENT ALONG CYLINDER SPAN FOR (a) m= 6 AND (b) m= 3. 0 0.02 0.04 0.06 0.08 0.1 0.12 0 20 40 60 80 100 120 140 160 180 ( ˜ζx)m ax z m = 6 m = 3 (a) 0 0.2 0.4 0.6 0.8 0 20 40 60 80 100 120 140 160 180 (ζy)m ax z (b) 0 0.01 0.02 0.03 0.04 0 20 40 60 80 100 120 140 160 180 ( ˜ζx)r m s z (c) 0 0.1 0.2 0.3 0.4 0 20 40 60 80 100 120 140 160 180 (ζy)r m s z (d)
FIGURE 5. (a,b) MAXIMUM AMPLITUDE AND (c,d) RMS
VALUE OF (a,c) INLINE DISPLACEMENT FLUCTUATION AND (b,d) CROSSFLOW DISPLACEMENT ALONG CYLINDER SPAN.
in the following on the basis of spectral analysis.
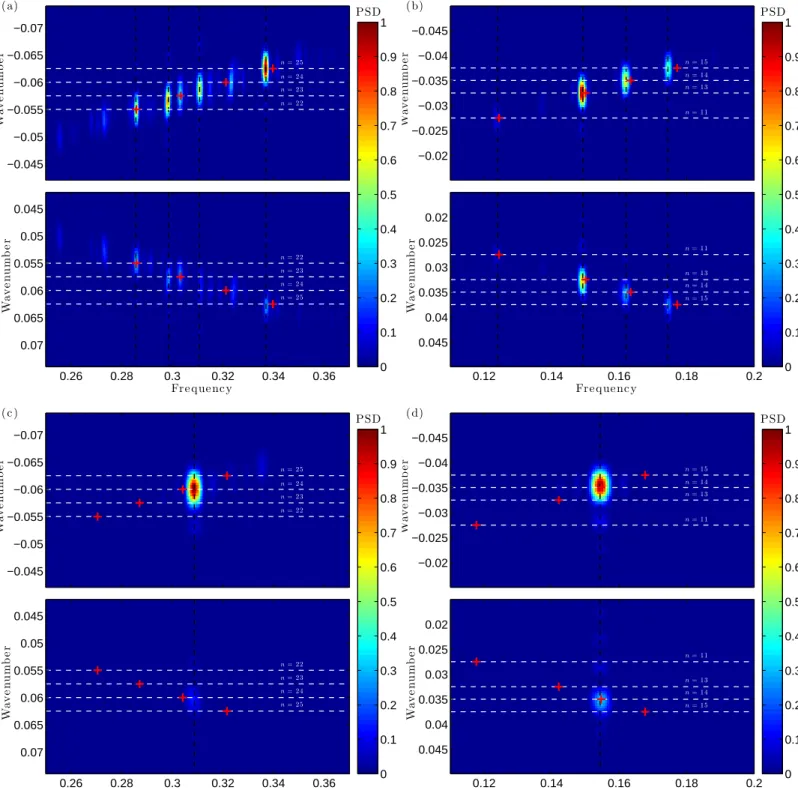
Spectral analysis
Spatio-temporal spectral analysis is carried out to clarify the nature of structure vibrations and the influence of mass ratio. This is achieved by a two-dimensional FFT of the spatio-temporal evolution of structure responses which are zero padded to reach a frequency resolution of 5× 10⁻⁴in both time and space. In Fig. 6, Power Spectral Densities (PSD) of inline and crossflow motions are plotted as functions of frequency and spatial wavenumber. Positive frequencies are presented and thus negative wavenumbers (upper part of each plot) are associated with traveling waves moving towards low velocity region while positive wavenumbers (lower part of each plot) represent traveling moving towards high velocity region. PSD are normalized by the maximum observed on both domains (positive and negative wavenumbers) to illustrate the traveling or standing character of the response. Sine Fourier modes
(sin(πnzD/L) for the nth mode) are often used to describe
structure response (e.g. Chaplin et al., 2005; Lie & Kaasen, 2006). The discretization of structure variables is based on this decomposition in the present numerical method (Evangelinos & Karniadakis, 1999) and thus it seems natural to associated the predominant spatial wavenumbers with the corresponding sine modes. Selected sine Fourier modes are indicated by white
horizontal dashed lines in Fig. 6.
From a general point of view a fundamental difference be-tween the two configurations is that multifrequency responses are observed in both directions at m= 6 while case m = 3
ex-hibits monofrequency responses. Predominant excited modes correspond to n∈ {22, 23, 24, 25} in inline direction and n ∈ {13, 14, 15} in crossflow direction at m = 6 and n = 24 in
in-line direction and n= 14 in crossflow direction at m = 3. These
mode numbers are close to those measured experimentally by Trim et al. (2005) and Lie & Kaasen (2006), where cases of multi-frequency responses have been reported in shear flow.
At a given vibration frequency it appears that only one peak emerges on spatial spectrum at the same wavenumber on both negative and positive sides, i.e. only one structural mode is ex-cited at a given frequency. The natural frequency fnnat of the tensioned beam associated with the nth structural mode can be evaluated as follows, in vacuum:
fnnat= kn 2π q ω2 c+ωb2k2n, with kn=π nD L . (2)
This spectrum can be modified to take into account of the immer-sion of the cylinder into the fluid:
fnmod= fnat
n
r m
m+π4Cm
, (3)
where Cm is the added mass coefficient induced by the flow.
In the absence of dynamical effects Cm is equal to 1. The
corresponding modified frequencies are indicated by red crosses in Fig. 6. While this modified spectrum seems to provide a reasonable approximation of the effective excited frequencies in some cases, significant discrepancies appear in other cases emphasizing the strong influence of dynamical effects.
The relative weights of negative and positive wavenumber peaks for the same frequency provide information concerning the standing/traveling character of the corresponding mode. In all cases, negative peak dominate, denoting predominant travel-ing wake movtravel-ing from high velicty region to low velocity region (increasing z). It can be observed that the ratio between negative and positive peak amplitudes for a given frequency is generally larger at m= 3. This is in agreement with the previous remark
concerning the occurrence of purer, reinforced traveling waves at
m= 3.
As a first step, vibrations have been investigated indepen-dently in each direction. The synchronization between inline and crossflow motions is studied in next section.
Inline/crossflow synchronization
Recently, Vandiver et al. (2009) and Modarres-Sadeghi
et al. (2010) have emphasized, on the basis of experimental
mea-surements involving flexible cylinders in shear flows, a possible link between inline/crossflow motion synchronization and the distribution of excitation and damping regions along the span. This link is examined here with an emphasis on mass ratio effect. The instantaneous phases of inline and crossflow vibrations (φx and φy respectively) are determined by means of Hilbert
transform. Adopting an approach similar to Huera-Huarte & Bearman (2009), the phase differenceΦxy is evaluated as
fol-lows:
Φxy= [pφx− qφy, mod 360o], (4)
where p and q are two integer numbers defining the level of synchronization studied. Considering the conclusions of the pre-vious spectral analysis, the couple(p, q) = (1, 2) is chosen here.
Values ofΦxyin the range 0o− 180o(180o− 360orespectively)
correspond to “figure eight” orbits where the cylinder moves upstream (dowstream respectively) when reaching crossflow oscillation maxima. These two types of trajectories are referred to as counterclockwise and clockwise respectively, as suggested by Dahl et al. (2007).
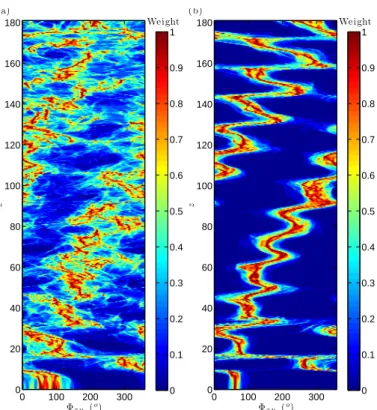
Histograms ofΦxyare evaluated from the whole vibration
time series. Figure 7 shows at each spanwise location, the relative weights of phase difference angles. The contributions are normalized by the maximum weight. A predominant phase difference can be clearly identified in most cases.
The main effect induced by mass ratio modification is re-lated to the mono- or multifrequency character of the vibrations: case m= 6 exhibits a noisier phase difference pattern since
multi-moded responses occur in both directions, with possible synchro-nization lag. However, spanwise distribution of phase difference presents strong similarities in both cases and is characterized by a zigzagging pattern drifting regularly towards high phase an-gles as z increases. In case of pure standing waves, a discontinu-ous phase difference with regular jumps between clockwise and counterclockwise orbits would be observed while a case of pure traveling waves could exhibit constant phase difference. The above mentioned zizagging pattern is a composition of these two idealized cases. The fact that counterclockwise motion domi-nates the high velocity region for the two studied mass ratios is in agreement with the experimental observations of Modarres-Sadeghi et al. (2010).
W a v e n u m b e r −0.07 −0.065 −0.06 −0.055 −0.05 −0.045 PSD 0 0.1 0.2 0.3 0.4 0.5 0.6 0.7 0.8 0.9 1 Fre que nc y W a v e n u m b e r 0.26 0.28 0.3 0.32 0.34 0.36 0.045 0.05 0.055 0.06 0.065 0.07 n = 22 n = 23 n = 24 n = 25 (a) n = 22 n = 25 n = 24 n = 23 W a v e n u m b e r −0.045 −0.04 −0.035 −0.03 −0.025 −0.02 PSD 0 0.1 0.2 0.3 0.4 0.5 0.6 0.7 0.8 0.9 1 Fre que nc y W a v e n u m b e r 0.12 0.14 0.16 0.18 0.2 0.02 0.025 0.03 0.035 0.04 0.045 n = 13 n = 14 n = 15 n = 11 (b) n = 13 n = 14 n = 15 n = 11 W a v e n u m b e r −0.07 −0.065 −0.06 −0.055 −0.05 −0.045 PSD 0 0.1 0.2 0.3 0.4 0.5 0.6 0.7 0.8 0.9 1 Fre que nc y W a v e n u m b e r 0.26 0.28 0.3 0.32 0.34 0.36 0.045 0.05 0.055 0.06 0.065 0.07 n = 22 n = 23 n = 24 n = 25 (c ) n = 22 n = 25 n = 24 n = 23 W a v e n u m b e r −0.045 −0.04 −0.035 −0.03 −0.025 −0.02 PSD 0 0.1 0.2 0.3 0.4 0.5 0.6 0.7 0.8 0.9 1 Fre que nc y W a v e n u m b e r 0.12 0.14 0.16 0.18 0.2 0.02 0.025 0.03 0.035 0.04 0.045 n = 13 n = 14 n = 15 n = 11 (d) n = 13 n = 14 n = 15 n = 11
FIGURE 6. SPATIO-TEMPORAL SPECTRAL ANALYSIS OF (a,c) INLINE DISPLACEMENT FLUCTUATION AND (b,d) CROSSFLOW
DISPLACEMENT FOR (a,b) m= 6 AND (c,d) m = 3. BLACK VERTICAL DASHED LINES INDICATE PREDOMINANT FREQUENCIES. WAVENUMBERS OF SELECTED SINE FOURIER MODES ARE INDICATED BY WHITE HORIZONTAL DASHED LINES. RED CROSSES DENOTE THE MODIFIED FREQUENCIES OF THESE MODES.
Φx y (o) z 0 100 200 300 0 20 40 60 80 100 120 140 160 180 Weight 0 0.1 0.2 0.3 0.4 0.5 0.6 0.7 0.8 0.9 1 (a) Φx y (o) z 0 100 200 300 0 20 40 60 80 100 120 140 160 180 Weight 0 0.1 0.2 0.3 0.4 0.5 0.6 0.7 0.8 0.9 1 (b)
FIGURE 7. HISTOGRAM OF INLINE/CROSSFLOW MOTION
PHASE DIFFERENCE ALONG CYLINDER SPAN FOR (a) m= 6 AND (b) m= 3.
FLUID-STRUCTURE INTERACTION
This section focuses on the influence of mass ratio on the coupled fluid-structure system. The phenomenon of lock-in in shear flow is examined with an emphasis on lock-in/non-lock-in distribution along cylinder span, before analyzing the topology of fluid-structure energy exchanges.
Lock-in
The present linear shear flow can potentially excite broad band response spectra since the natural vortex shedding fre-quency depends on the oncoming velocity. In the case of forced crossflow oscillations of rigid and flexible cylinders in shear flow, Stansby (1976) and Peltzer & Rooney (1985) have emphasized the formation of long (> 40D) spanwise cells
of constant shedding frequency equal to forcing frequency. Lock-in phenomenon consists in a synchronization between vortex shedding and structure oscillation. The partial lock-in of the wake reported in previous references perturbs the pattern observed in the case of stationary cylinders in shear flow (or stationary tapered cylinders in uniform flow) that is composed of smaller cells of constant shedding frequency separated by regular discontinuities (Noack et al., 1991).
Crossflow component of flow velocity v has been recorded over the same time interval as structure displacements along a spanwise line downstream of the cylinder at(x, y) = (20, 0)
in case m= 6 and (x, y) = (31, 0) in case m = 3. PSD of v
temporal evolution is plotted along the span in Fig. 8. Selected frequencies previously identified by spectral analysis of structure vibrations (Fig. 6) are indicated by dashed lines.
Two main spanwise regions can be distinguished in both cases. A zone of lock-in can be identified in the high velocity region, near z= 0. The rest of the span corresponds to
non-lock-in region where vortex sheddnon-lock-ing and structure vibrations are not synchronized. At m= 6, lock-in occurs at the three frequencies
associated with the predominant modes of crossflow vibration while case m= 3 exhibits lock-in at a single frequency. Lock-in
occurs over 75D at m= 6 and 77D at m = 3. However, within
high-velocity region, zones exist where no peak can be clearly identified, leading to spatial intermittencies of lock-in. At lock-in, shedding frequency can be driven relatively far from the natural shedding frequency past a stationary cylinder. Shedding frequencies normalized by the local oncoming flow velocity are in the ranges[0.149, 0.213] and [0.154, 0.222] at m = 6 and
m= 3 respectively.
Non-lock-in region is characterized by a cellular pattern rel-atively similar to the case of a stationary cylinder in shear flow as reported in (Peltzer & Rooney, 1985) with a comparable shear rate. The wake pattern (not presented here) is characterized by oblique vortex shedding that are responsible for the preferential orientation of the traveling wave responses. To satisfy the con-tinuity of spanwise vortex filaments while vortex shedding fre-qiency is discontinuous, vortex splitting events (e.g. Williamson, 1992; Piccirillo & Van Atta, 1993; Zhang et al., 1995) occur at the boundaries of each spanwise cell in Fig. 8.
Energy exchanges
Fluid-structure energy exchanges are quantified in average by means of the lift coefficient in phase with structure crossflow velocity: Clv(z) = 2 Ts R TsCy(z,t) ˙ζy(z,t)dt q 2 Ts R Ts ˙ ζ2 y(z,t)dt , (5)
where Ts is the sampling period. The present analysis focuses
on crossflow displacements since the structure mainly vibrates in this direction.
Spanwise evolution of Clvis plotted in Fig. 9 for both cases.
Zones of positive Clvare located in the high velocity region and
Fre que nc y z 0 0.05 0.1 0.15 0.2 0 20 40 60 80 100 120 140 160 180 PSD - v 0.005 0.01 0.015 0.02 0.025 0.03 0.035 0.04 (a) Fre que nc y z 0 0.05 0.1 0.15 0.2 0 20 40 60 80 100 120 140 160 180 PSD - v 0.005 0.01 0.015 0.02 0.025 0.03 0.035 0.04 0.045 0.05 (b)
FIGURE 8. PSD OF THE TEMPORAL EVOLUTION OF
CROSS-FLOW COMPONENT OF CROSS-FLOW VELOCITY ALONG A SPANWISE LINE AT (a)(x, y) = (20, 0), m = 6 AND (b) (x, y) = (31, 0), m = 3. DASHED LINES INDICATE PREDOMINANT FREQUENCIES OF STRUCTURE VIBRATION.
and structure oscillation are not synchronized, Clv remains
negative. As a consequence, the flow can excite the structure at lock-in (Clv> 0) whereas its damps structure oscillations
elsewhere (Clv< 0). Clvexhibits strong irregularities in lock-in
region in both cases and its spanwise pattern is more regular out of lock-in region, where it is negative. It can be noticed that in excitation region, counterclockwise orbits dominate the synchronization pattern between inline and crossflow vibrations (Fig. 7). −0.2 −0.1 0 0.1 0.2 0.3 0.4 0.5 0.6 0 20 40 60 80 100 120 140 160 180 Cl v z m = 6 m = 3
FIGURE 9. LIFT COEFFICIENT IN PHASE WITH VELOCITY
ALONG CYLINDER SPAN.
Some differences related to mass ratio modification can be underlined in this region. The reinforced standing wave pat-tern near the end (z< 40) at m = 3, because of the increased
bending of the structure, induces stronger modulations of Clv
that becomes negative near crossflow vibration nodes. Beyond this region, where a purer traveling wave response develops
(z∈ [40, 68]), Clvreaches higher values with reduced spanwise
variations at m= 3.
SUMMARY
The coupled fluid-structure system composed of a long flex-ible cylinder in shear flow has been simulated at a Reynolds num-ber ranging from 330 to 90.
Structure response is characterized by a mixed standing-traveling wave pattern. The influence of cylinder mass ratio on structure response has been investigated. A reduction of mass ra-tio from 6 to 3 leads to larger amplitude vibrara-tions and purer responses: purer standing waves for z< 40 and purer, more
pronounced traveling waves beyond this region. While multi-frequency structure vibrations are observed in both directions at
m= 6, case m = 3 exhibits monofrequency responses.
Spanwise extent of lock-in region is similar for both cases: vortex shedding and structure oscillation remain syn-chronized over more than 75D. The fundamental features of inline/crossflow motion synchronization are not altered by the
passage from multifrequency to monofrequency reponses: the phase difference between inline and crossflow motions exhibits a zigzagging pattern along cylinder span and counterclockwise or-bits dominate high velocity excitation region in both cases. This could emphasize a relative generality of this synchronization pat-tern for flexible cylinders in shear flow, that is corroborated by experimental observations as mentioned previously.
ACKNOWLEDGMENT
Financial support was provided by the BP-MIT Major Projects Program, and BP America Production Co.
REFERENCES
Bearman, P. W. 1984 Vortex shedding from oscillating bluff bod-ies. Annual Review of Fluid Mechanics 16, 195–222.
Chaplin, J. R., Bearman, P. W., Huera-Huarte, F. J. & Pattenden, R. J. 2005 Laboratory measurements of vortex-induced vibra-tions of a vertical tension riser in a stepped current. Journal of
Fluids and Structures 21, 3–24.
Dahl, J. M., Hover, F. S., Triantafyllou, M. S., Dong, S. & Kar-niadakis, G. E. 2007 Resonant vibrations of bluff bodies cause multivortex shedding and high frequency forces. Physical
re-view letter 99, 144503.
Evangelinos, C. & Karniadakis, G. E. 1999 Dynamics and flow structures in the turbulent wake of rigid and flexible cylin-ders subject to vortex-induced vibrations. Journal of Fluid
Me-chanics 400, 91–124.
Govardhan, R. & Williamson, C. H. K. 2002 Resonance forever: existence of a critical mass and an infinite regime of resonance in vortexinduced vibration. Journal of Fluid Mechanics 473, 147–166.
Huera-Huarte, F. J. & Bearman, P. W. 2009 Wake structures and vortex-induced vibrations of a long flexible cylinder part 1: Dynamic response. Journal of Fluids and Structures 25, 969– 990.
Karniadakis, G. E. & Sherwin, S. 2005 Spectral/hp Element
Methods for CFD. Oxford: Oxford University Press.
Kim, Y. H., Vandiver, J. K. & Holler, R. 1986 Vortex-induced vibration and drag coefficients of long cables subjected to sheared flow. ASME Journal of Energy Resources Technology
108, 77–83.
Lie, H. & Kaasen, K. E. 2006 Modal analysis of measurements from a large-scale viv model test of a riser in linearly sheared flow. Journal of Fluids and Structures 22, 557–575.
Lucor, D. 2004 Generalized polynomial chaos: applications to random oscillators and flow-structure interactions. PhD The-sis, Brown University.
Lucor, D., Mukundan, H. & Triantafyllou, M. S. 2006 Riser modal identification in CFD and full-scale experiments.
Jour-nal of Fluids and Structures 22, 905–917.
Modarres-Sadeghi, Y., Mukundan, H., Dahl, J. M., Hover, F. S. & Triantafyllou, M. S. 2010 The effect of higher harmonic forces on fatigue life of marine risers. Journal of Sound and
Vibration 329, 43–55.
Newman, D. J. & Karniadakis, G. E. 1997 A direct numerical simulation study of flow past a freely vibrating cable. Journal
of Fluid Mechanics 344, 95–136.
Noack, B. R., Ohle, F. & Eckelmann, H. 1991 On cell formation in vortex streets. Journal of Fluid Mechanics 227, 293–308. Peltzer, R. D. & Rooney, D. M. 1985 Vortex shedding in a linear
shear flow from a vibrating marine cable with attached bluff bodies. Journal of Fluids Engineering 107, 61–66.
Piccirillo, P. S. & Van Atta, C. W. 1993 An experimental study of vortex shedding behind linearly tapered cylinders at low reynolds number. Journal of Fluid Mechanics 246, 163–195. Sarpkaya, T. 2004 A critical review of the intrinsic nature of
vortex-induced vibrations. Journal of Fluids and Structures
19, 389–447.
Stansby, P. K. 1976 The locking-on of vortex shedding due to the cross-stream vibration of circular cylinders in uniform and shear flows. Journal of Fluid Mechanics 74, 641–665. Trim, A. D., Braaten, H., Lie, H. & Tognarelli, M. A. 2005
Ex-perimental investigation of vortex-induced vibration of long marine risers. Journal of Fluids and Structures 21, 335–361. Vandiver, J. K., Allen, D. & Li, L. 1996 The occurrence of
lock-in under highly sheared conditions. Journal of Fluids and
Structures 10, 555–561.
Vandiver, J. K., Jaiswal, V. & Jhingran, V. 2009 Insights on vortex-induced, traveling waves on long risers. Journal of
Flu-ids and Structures 25, 641–653.
Williamson, C. H. K. 1992 The natural and forced formation of spot-like ‘vortex dislocations’ in the transition of a wake.
Jour-nal of Fluid Mechanics 243, 393–441.
Williamson, C. H. K. & Govardhan, R. 2004 Vortex-induced vi-brations. Annual Review of Fluid Mechanics 36, 413–455. Zhang, H.-Q., Fey, U., Noack, B. R., Konig, M. & Eckelmann, H.
1995 On the transition of the cylinder wake. Physics of Fluids