Publisher’s version / Version de l'éditeur: Building Research Note, 1981-11
READ THESE TERMS AND CONDITIONS CAREFULLY BEFORE USING THIS WEBSITE.
https://nrc-publications.canada.ca/eng/copyright
Vous avez des questions? Nous pouvons vous aider. Pour communiquer directement avec un auteur, consultez la
première page de la revue dans laquelle son article a été publié afin de trouver ses coordonnées. Si vous n’arrivez pas à les repérer, communiquez avec nous à PublicationsArchive-ArchivesPublications@nrc-cnrc.gc.ca.
Questions? Contact the NRC Publications Archive team at
PublicationsArchive-ArchivesPublications@nrc-cnrc.gc.ca. If you wish to email the authors directly, please see the first page of the publication for their contact information.
NRC Publications Archive
Archives des publications du CNRC
For the publisher’s version, please access the DOI link below./ Pour consulter la version de l’éditeur, utilisez le lien DOI ci-dessous.
https://doi.org/10.4224/20377488
Access and use of this website and the material on it are subject to the Terms and Conditions set forth at
Air tightness measurements of detached houses in the Saskatoon area
Dumont, R. S.; Orr, H. W.; Figley, D. A.
https://publications-cnrc.canada.ca/fra/droits
L’accès à ce site Web et l’utilisation de son contenu sont assujettis aux conditions présentées dans le site
LISEZ CES CONDITIONS ATTENTIVEMENT AVANT D’UTILISER CE SITE WEB.
NRC Publications Record / Notice d'Archives des publications de CNRC:
https://nrc-publications.canada.ca/eng/view/object/?id=deec7357-fdee-4a5f-acdf-c6a63596f14b https://publications-cnrc.canada.ca/fra/voir/objet/?id=deec7357-fdee-4a5f-acdf-c6a63596f14b
Division of Building Research, National Research Council of Canada
fi
National Research Conseil nationalAIR TIGHTNESS MEASUREMENTS OF
DETACHED HOUSES IN THE SASKATOON AREA
R.S. Dumont,
H.W.
Orr and
D.A.
Figley
The purpose of this study was to identify the air tightness levels of a
group of houses in the Saskatoon area. Included in the tests were houses of
different ages, construction styles, and methods of achieving air tightness.
A
1979 report by ~each' presents the results of air tightness tests on
a group of new houses in the Ottawa area. The Saskatoon study included a
sample of new houses comparable in number to the Ottawa sample and thus
enabled comparison between the two studies.
The total number of houses tested in the Saskatoon Group was 176.
Categorized according to age, the niimber of conventionally constructed houses
in each group was as follows::
No. of Houses
Pre 1945
1946
-1960
In addition to the houses constructed using conventional air tightness
measures, a sample of 40 houses in which the builders had made efforts to
improve the air tightness level was included. The techniques used in the
majority of these special houses are detailed in the booklet "Energy Efficient
Housing: A Prairie
roach,"^
Which was written in collaboration with members
of the Division of Building Research of the National Research Council.
In addition to categorization by age and air tightness levels, the houses
tested were also classified according to the construction style and the
contractor.
The pressure test procedure and the apparatus used are described in
"AnExhaust Fan Apparatus for Assessing the Air Leakage Characteristics of Houses.
l t 3The test can be done on a house in a relatively short time. Typically,
in an 8-hour day, two persons could pressure test about 5 houses provided
the travel time between houses was not greater than about
20minutes
--
. . . . .- - . . . - - -.- 2
-A l l t e s t s r e p o r t e d i n t h i s Note were conducted with a l l v e n t s and chimnc?ys i n t h e houses blocked. The f a n was p o s i t i o n e d s o a s t o cause a n e g a t i v e p r e s s u r e i n t h e house r e l a t i v e t o t h e outdoor p r e s s u r e .
About t e n d a t a p o i n t s were t a k e n f o r each house. The volume flow and p r e s s u r e d i f f e r e n c e a c r o s s t h e house were used t o determine C and n i n t h e e q u a t i o n :
Q = C ( A P ) ~
where Q = volume flow (m3/s) ;
C = c o n s t a n t (m3/(s-pan));
AP = p r e s s u r e d i f f e r e n c e ( P a ) ;
n = d i m e n s i o n l e s s number.
A number o f f i g u r e s of m e r i t have been used by v a r i o u s a u t h o r s t o r a t e t h e a i r t i g h t n e s s l e v e l of houses. These c r i t e r i a have g e n e r a l l y been of t h e
f o l l o w i n g form:
(1) e q u i v a l e n t o r i f i c e a r e a ;
( 2 ) a i r flow a t a r e f e r e n c e p r e s s u r e d i f f e r e n c e ;
(3) a i r flow p e r u n i t volume a t a r e f e r e n c e p r e s s u r e d i f f e r e n c e ; and
(4) a i r flow p e r u n i t exposed above g r a d e a r e a a t a r e f e r e n c e p r e s s u r e
d i f f e r e n c e .
.
As a l l o f t h e above c r i t e r i a have some m e r i t , a d e c i s i o n had t o be made a s t o t h e c r i t e r i o n used i n t h i s n o t e . The c h o i c e used i n t h i s n o t e f o r averagi.ng t h e d a t a was t h e a i r flow p e r u n i t volume a t a p r e s s u r e d i f f e r e n c e of 50 Pa. This w i l l be r e f e r r e d t o a s t h e n50 r a t i n g , f o l l o w i n g t h e swedish4 and ~ o r w e ~ i a n ~ terminology. To a s s i s t t h o s e more f a m i l i a r w i t h d i f f e r e n t u n i t s , however, t h e v a l u e s of t h e volume, e x t e r n a l a r e a above g r a d e , t h e c o n s t a n t s Cand t h e exponent n a r e a l s o p r e s e n t e d f o r each o f t h e houses, a l o n g w i t h t h e a i r flow p e r u n i t exposed s u r f a c e a r e a a t a p r e s s u r e d i f f e r e n c e of 10 Pa, and t h e a i r flow a t 10 Pa.
1)ESCKIP'I'ION O F TIE IiOUSES TESTED
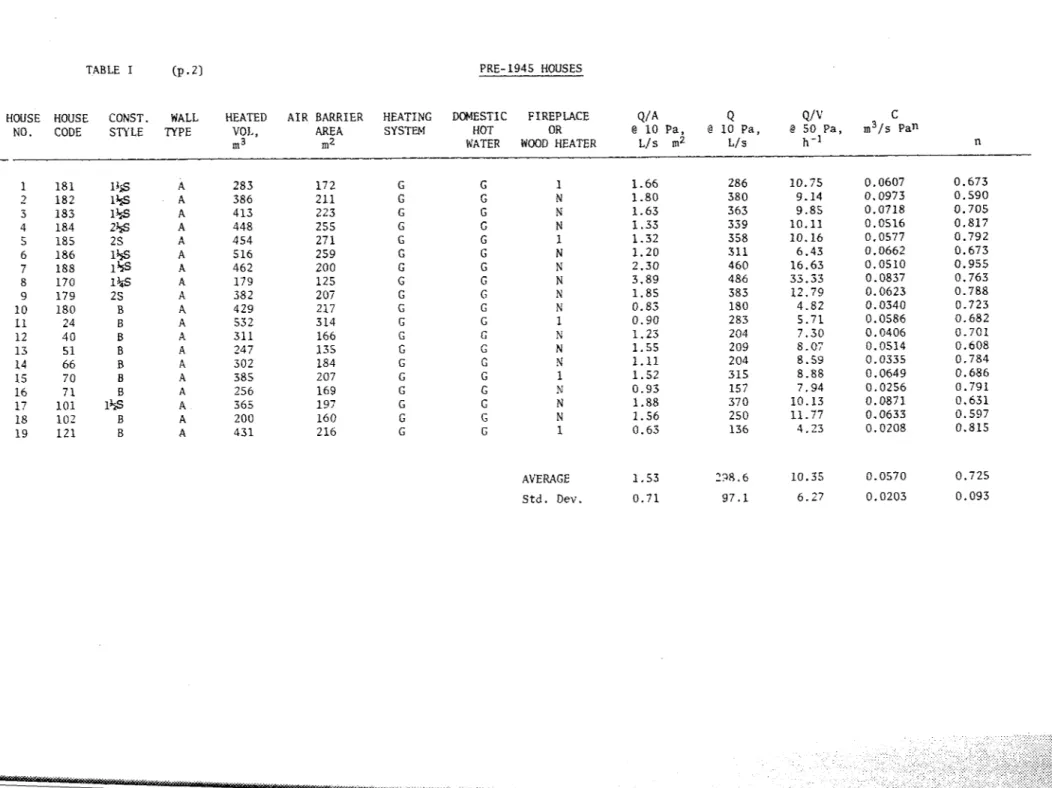
The 176 houses t e s t e d and t h e p r e s s u r e t e s t r e s u l t s a r e d e s c r i b e d i n Table I . The nsO v a l u e s range from a low o f 0.37 t o a h i g h of 33.3. A
T e s t R e s u l t s .C:
u r e 1 . Age o f houses
The age of t h e house had a marked e f f e c t on t h e p r e s s u r e t e s t r e s u l t s . For e a s e of c a t e g o r i z a . t i o n , t h e c o n v e n t i o n a l l y c o n s t r t ~ c t e d houses were d i v i d e d i n t o t h r e e a g e c a t e g o r i e s :
(1) Pre 1945; ( 2 ) 1946 - 1960;
( 3 ) 1961 - 1980;
The r e a s o n f o r u s i n g t h e t h r e e age groups was a s f o l l o w s . P r i o r t o 1945, vapour b a r r i e r s i n s h e e t form were n o t used i n houses. Following 1945, vapour b a r r i e r s i.n t h e form of waxed paper were i n t r o d u c e d .
From 1960 onward, t h e u s e o f p o l y e t h y l e n e s h e e t s f o r vapour h a r r i . e r s became a common p r a c t i c e i n Canada.
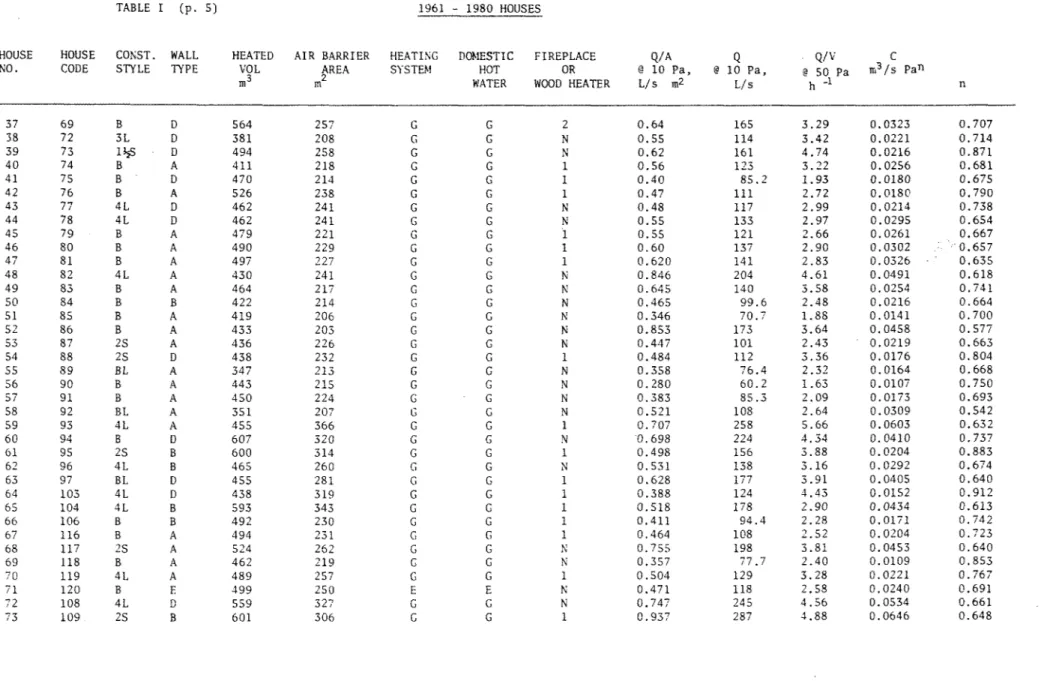
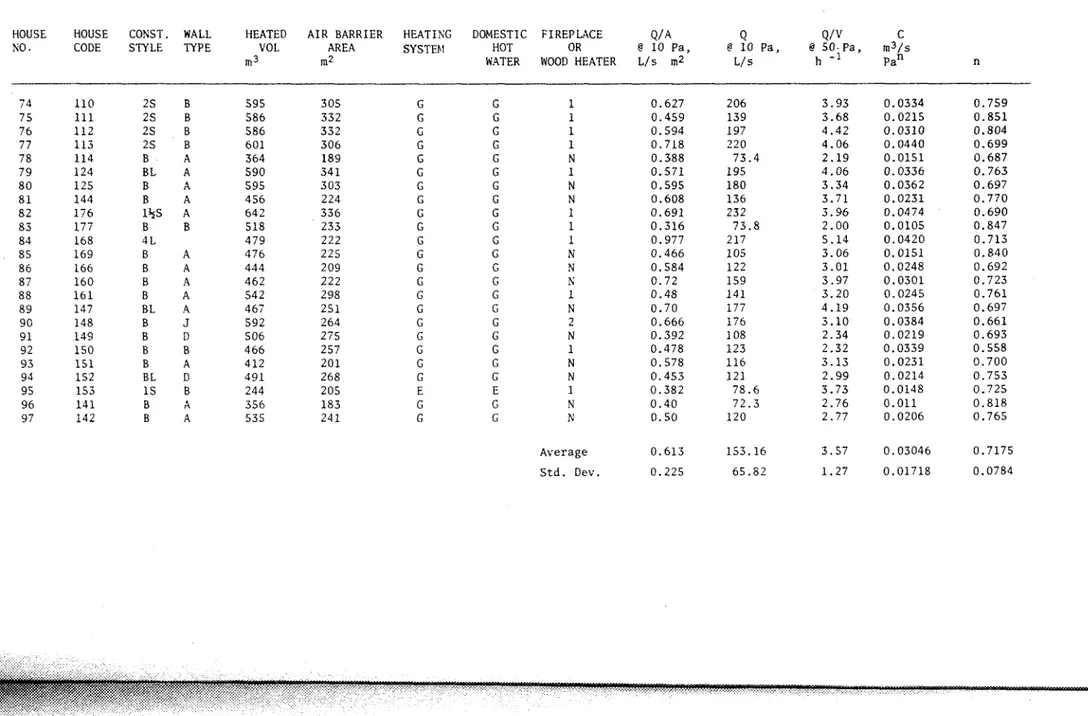
The t e s t r e s u l t s f o r t h e t h r e e age c a t e g o r i e s a r e p r e s e n t e d i n '1'al)lc 2 .
In t h e 1961 - 1980 sample, t h o s e houses which were i n t h e low-energy house c a t e g o r y were excluded. Only t h o s e houses u s i n g c o n v e n t i o n a l a i r t i g h t n e s s t e c h n i q u e s a r e i n t h i s sample.
2 . Low-Energy Houses
The low-energy house sample i n c l u d e s houses b u i l t over t h e p e r i o d 1977 t o 1980. Of t h e 40 houses, 35 were b u i l t by c o n t r a c t o r s , and t h e remainder by i n d i v i d u a l s on a " d o - i t - y o u r s e l f " b a s i s . Houses 2 0 t o 33
were i n a s p e c i a l p r o j e c t b u i l t on one s t r e e t i n a new a r e a of Saskatoon The t e s t r e s u l t s a r e p r e s e n t e d i n Table 3 .
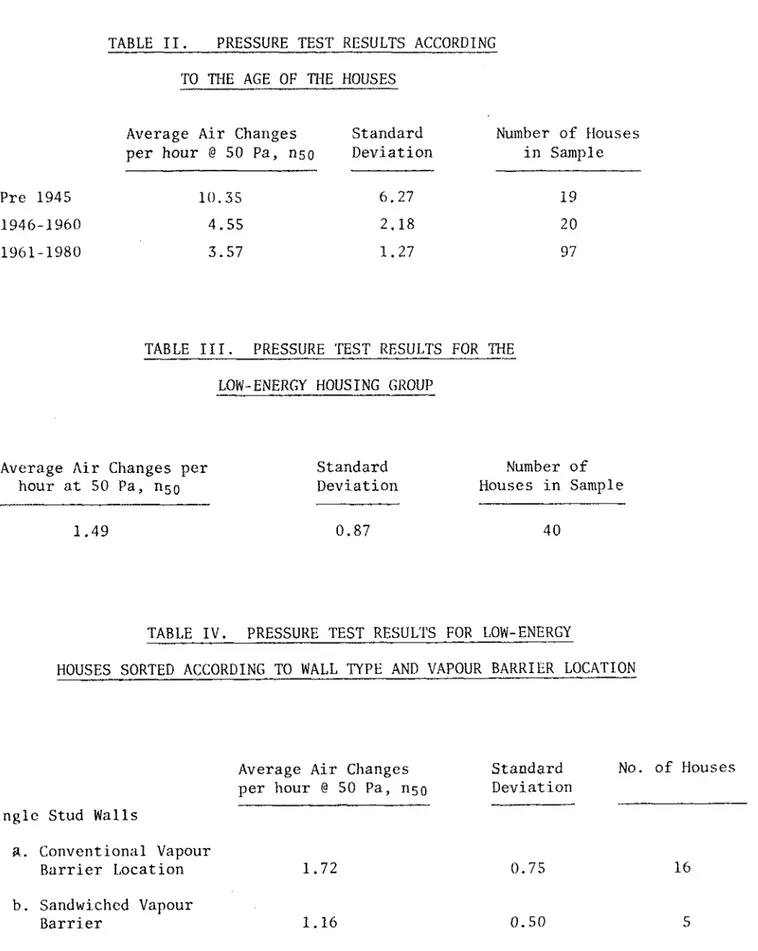
The low-energy houses were f u r t h e r subdivided i n t o c a t e g o r i e s based on t h e type of w a l l system used ( s i n g l e s t u d o r double s t u d ) and on t h e l o c a t i o n of t h e wall vapour b a r r i e r ( c o n v e n t i o n a l o r vapour b a r r i e r sandwiched). The r e s u l t s a r e p r e s e n t e d i n Table 4 .
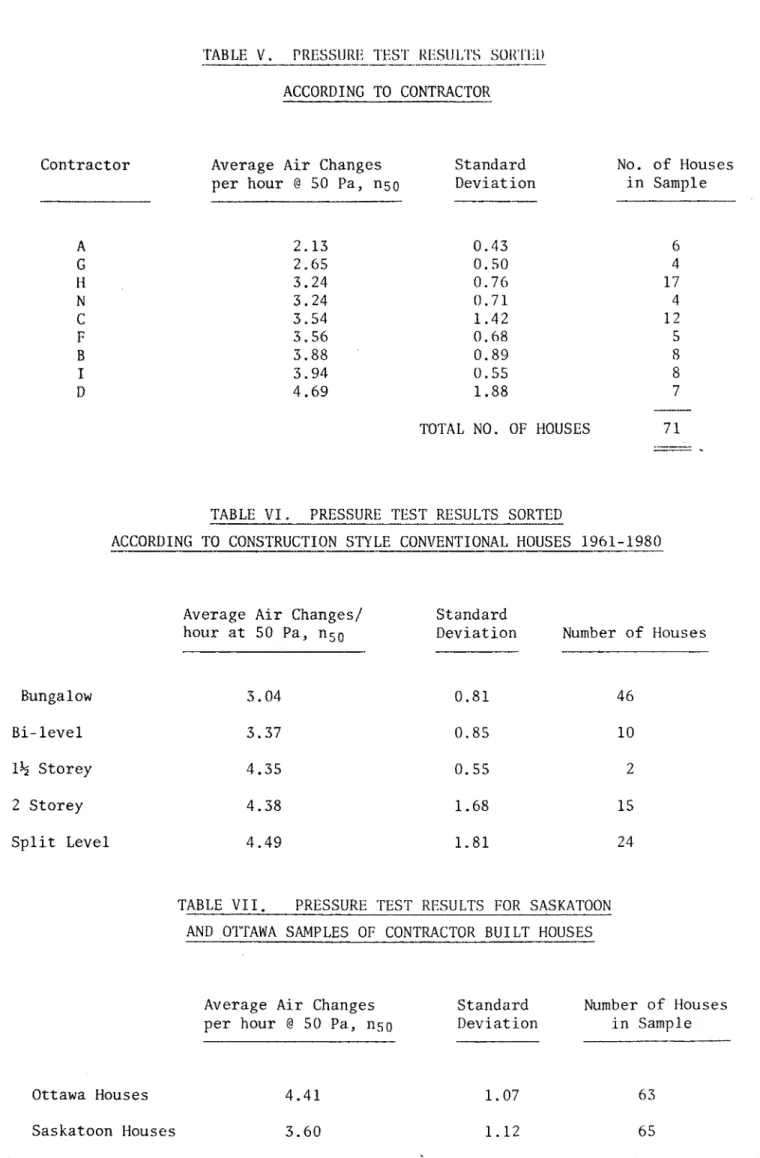
3 . E f f e c t of C o n t r a c t o r
Included i n t h e t e s t sample were houses b u i l t by d i f f e r e n t c o n t r a c t o r s . With t h e e x c e p t i o n of c o n t r a c t o r A , a l l t h e c o n t r a c t o r s were b u i l d i n g c o n v e n t i o n a l houses t h a t d i d not i n c o r p o r a t e s p e c i a l a i r t i g h t n e s s t e c h n i q u e s .
As a l r e a d y mentioned, t h e r e was a group of 14 low-energy houses b u i l t f o r a s p e c i a l p r o j e c t . Because t h e s e houses i n c o r p o r a t e d s p e c i a l a i r t i g h t n e s s t e c h n i q u e s , t h e s e houses a r e excluded from t h e c o n t r a c t o r sample. The r e s u l t s f o r t h e c o n t r a c t o r s a r e p r e s e n t e d i n Table 5 .
4 . C o n s t r u c t i o n S t y l e
To determine t h e e f f e c t of c o n s t r u c t i o n s t y l e on t h e p r e s s u r e t e s t r e s u l t s , t h e c o n v e n t i o n a l houses o f t h e 1961 t o 1980 c a t e g o r y were s o r t e d a c c o r d i n g t o t h e f o l l o w i n g d i v i s i o n of c o n s t r u c t i o n s t y l e s : bungalow, b i - l e v e l , s p l i t l e v e l , 1% s t o r e y and 2 s t o r e y . The p r e s s u r e t e s t r e s u l t s a r e p r e s e n t e d i n Table 6.
5 . Comparison w i t h Ottawa House Sample
A 1979 r e p o r t by ~ e a c h l p r e s e n t e d p r e s s u r e t e s t r e s u l t s on a sample of 63 new houses b u i l t by c o n t r a c t o r s . A comparison i s p r e s e n t e d i n Table 7 between t h e r e s u l t s found f o r t h e Ottawa sample and f o r a s i m i l a r group of houses i n Saskatoon. Because c o n t r a c t o r A i n Saskatoon was u s i n g s p e c i a l a i r t i g h t n e s s measures, h i s houses were excluded from t h e Saskatoon sample f o r t h i s comparison.
DISCUSSION
A number of o b s e r v a t i o n s can be made concerning t h e d a t a p r e s e n t e d i n t h i s Note. The e f f e c t o f a g e , a i r t i g h t n e s s measures u s e d , c o n t r a c t o r and c o n s t r u c t i o n s t y l e a r e d i s c u s s e d i n t u r n .
1. Aee o f Houses
Of a11 t h e v a r i a b l e s t h a t i n f l u e n c e d t h e a i r t i g h t n e s s o f t h e houses t e s t e d , i t was t h e a g e of t h e house t h a t was most s i g n i f i c a n t . The a g e of t h e house had a marked e f f e c t on t h e t y p e of vapour b a r r i e r u s e d , which i n t u r n a f f e c t e d t h e p r e s s u r e t e s t r e s u l t s . As can be
s e e n from Table 2 , t h e houses i n t h e p r e 1945 sample (nS0 = 10.35) were approximately 2 . 2 t i m e s a s l e a k y a s t h e sample b u i l t between 1946 and 1960 ( n50 = 4 . 5 5 ) . There was a s l i g h t improvement i n a i r t i g h t n e s s i n t h e p o s t 1960 sample (n50 = 3.57) compared with t h e 1946 - 1960 sample.
2 . Low- Energy Houses
Those houses u s i n g s p e c i a l a i r t i g h t n e s s measures had p r e s s u r e t e s t s w i t h an a v e r a g e v a l u e o f n5o = 1 . 4 9 . This r e p r e s e n t s a reductj-on o f 58% o v e r t h e v a l u e s f o r c o n v e n t i o n a l 1961 - 1980 houses n o t i n - c o r p o r a t i n g t h e s p e c i a l a i r t i g h t n e s s measures. The placement of t h e vapour b a r r i e r i n t h e w a l l a p p e a r s t o have had an i n f l u e n c e on t h e a i r t i g h t n e s s l e v e l achieved. Those houses u s i n g a sandwich t e c h n i q u e f o r t h e vapour b a r r i e r , i . e . , p l a c i n g t h e vapour b a r r i e r p a r t way through t h e w a l l e x h i b i t e d c o n s i d e r a b l y lower a i r l e a k a g e v a l u e s (n50 = 1.16 s i n g l e s t u d w a l l ; n5! = 0.93 double s t u d w a l l ) a s compared with t h o s e low cncrgy houses u s l n g a c o n v e n t i o n a l l o c a t i o n f o r t h e vapour b u r r i e r
3. Effect of Contractor
With the exception of contractor A, all of the contractors were using
conventional air tightness measures, which consist of
50um
thick polyethylene as the vapour barrier on the ceiling and walls of
the house. I11 the conventional installation, there is some attempt to
achieve continuity of the vapour barrier, but there are numerous locations
where this goal was not achieved. As can be seen fro111 Table 5, a
variation of approximately 2.2 to 1 existed between the contractor with
the lowest n50 value (2.13) and the contractor with the highest n50
v a l u e( 4 . 6 9 ) .
The present Swedish standard4 for new houses is
3air changes/
hour at
50pascals. Of the
9contractors surveyed, only
2of the
Saskatoon contractors would have met the Swedish standard.
4. Construction Stvle
The bungalow and bi-level designs, with n50 values of
3.04and 3.37,
were found to be measurably tighter than the 1%-storey, 2-storey and
split level designs, which had nsO values of 4.35, 4.38 and 4.49.
With the latter group of houses, the greater surface area above grade
is likely the major reason for the greater air leakage.
5. Comparison between Saskatoon and Ottawa
Contractor-Built Houses
--The Ottawa houses (nso
=4.41) had greater air leakage values than
the Saskatoon sample (nsO
=3.60). As Saskatoon is located
ina
colder climate area, it is not unexpected that the houses in the
Saskaevon sample were tighter.
References
1
Beach, R.K. Relative Tightness of New Housing in the Ottawa Area,
National Research Council of Canada, Divisi-on
of Building Research,
BR Note No. 149, Ottawa, 1979
2
Energy Efficient Housing: A Prairie Approach, Office of Energy
Conservation, Government of Saskatchewan, 1914 Hamilton Street,
Regina, Saskatchewan, Canada.
3 Orr,
H.W. and Figley, D.A.
AnExhaust Fan Apparatus for Assessing
the Air Leakage Characteristics of Houses, National Research Council
of Canada, Division of Building Research, BR Note No. 150, Ottawa,
1980.- 6 -
Carlsson,
B y
Elmroth, A . and Engrall, P. Airtightness and Thermal Insulation: Building Design Solutions, Swedish Council for Building Research, Stockholm, Sweden, 1980.Brunsell, J.T.
and
Urslkk, S. The airtightness of Houses, (Boligers Lufhetthet) Norwegian Building Research Institute Report No. 31, 1980. Orr,H.W.,
Design and Construction of Low Energy Houses in the Prairies. In preparation.TABLE: I.
HOUSE
CHAF!AmRISTICS Symbols : Construction Style B-
Bungalm BI,-
ni-level 2s-
T~IO
Storey1$S
-
One and one-half storeyWall A
-
38x
89mn
stud B-
38x
140 C-
38x
190 D-
38x
89+
polystyrene sheathing E-
38x
140+
polystyrene sheathing Heating S y s t m G-
G a sfir&,
forced a i r 0-
O i l f i r e d , forcedair
E-
E l e c t r i c , baseboard m e s t i c Water Heating G-
Gas E-
E l e c t r i c 3L-
Three l e v e l s p l i t 4L - Four l e v e l s p l i t 5L-
Five l e v e l s p l i t SL-
Slab on grade F-
Double stud (FS sandwiched vapour barrier ) G-
(38x
64)+
(38x
89)+
polystyrene sheathing H-
2nd skin r e t r o f i t I-
Wood t r u s s J- mg
constructionTABLE I (P - 2 ) PRE- 1945 HOUSES
HOUSE HOUSE CONST. WALL HEATED AIR BARRIER HEATING DOMESTIC FIREPLACE Ql A Q
Q/v
cNO. CODE STYLE TYPE VOI,, AREA SYSTEM HOT OR @ 1 0 Pa, @ 1 0 Pa, @ 5 0 Pa, m3/s Pan
m 3 m 2 WATER WOOD HEATER L/s m2 L/s h -I n
-
AVERAGE 1.53 138.6 10.35 0.0570 0.725
TABLE I ( P . 3 )
HCUSE HOUSE ENST. WEL HEATED AIR BARRlER
NO. CODE STYLE TYPE VZ)L AREA
rn-' m2
Average
Std. cev.
WA Q
o/v
@ 10 Pa, @ 10 Pa, @ 50 Pa,
TABLE I (pa 4 )
HXEE HOUSE CONST. WALL
m. CODE s m TYPE HEATED mL rn A I R BARRIER AREA m Q @ 1 0 Pa, L ' s
TABLE I ( p . 5) 1961 - 1 9 8 0 HOUSES HOUSE
NO.
HOUSE CODE
COKST. WALL HEATED S T Y L E TYPE VO L m A I R BARRIER $REA rn HEATISG SYSTEM DBIESTIC F I R E P L A C E HOT OR
WATER WOOD HEATER
Q/A @ 10 P a , L / s m2 Q @ 10 P a , L / s
TABLE I (p. 6) 1961 - 1980 HOUSES
HOUSE HOUSE CONST. WALL HEATED AIR BARRIER HEATIKG DOMESTIC FIREPLACE Q/A Q Q/v C KO. CODE STYLE TYPE VOL AREA SYSTEbI H O T OR @ 1 0 Pa, @ 1 0 Pa, @ 50.Pa, m 3 / s
m 3 m2 WATER WOOD HEATER L/s m2 L/ h
-'
pan nAverage Std. Dev.
TABLE I i p . 7 ) HOUSE HOUSE C O F S T . WALL HEATED
NO. CODE STYLE TYPE VO L
m 3 A I R BARRIER AREA m2 HEATING SYSTEM
LOW ENERGY HOUSES
DOMESTIC F I R E P L 4 C E
HOT OR
KATER WOOD HEATER
Average S t d . Dev Q/A @ 10 Pa, L / S m2 Q @ 10 P a , L/ s Q/V G 50 P a , h - '
-
2 . 8 3 2.20 1 . 4 2 1 . 7 8 1 . 0 0 1.88 1 . 5 7 1 . 3 8 4.72 2.96 2.60 0.59 2.79 1 . 2 5 2.20 1 . 9 3 1.64 2 . 3 0 1 . 6 5 0.62 0.77 1 . 3 1 2.19 1 . 0 4 0.37 0 . 7 4 0 . 5 3 0.76 0.76 1.14 1.09 0.54 0.45 1 . 5 3 1 . 4 4 1 . 1 8 1 . 5 2 1 . 2 8 0 . 8 3 0 . 9 9 1 . 4 9 0.87TABLE 11. PRESSURE TEST RESULTS ACCORDING TO THE AGE OF THE HOUSES
Average A i r Changes Standard p e r hour @ 50 Pa, n50 D e v i a t i o n Number o f Houses i n Sample Pre 1945 10.35 1946- 1960 4.55 1961-1980 3.57
TABLE 111. PRESSURE TEST RESULTS FOR THE
LOW- ENERGY HOUSING GROUP
Average A i r Changes p e r hour a t 50 Pa, n50 Standard D e v i a t i o n Number o f Houses i n Sample No. o f Houses S i n g l e Stud Walls
a .
Conventional Vapour B a r r i e r Locat i o n 1.72 b.
Sandwi.ched VapourDouble Stud Walls
a . Conventional Vapour B a r r i e r Locat i o n
h . Sandwiched Vapour
TABLE IV. PRESSURE TEST RESULTS FOR LOW-ENERGY
HOUSES SORTED ACCORDING TO WALL TYPE AND VAPOUR BARRIER LOCATION
Average A i r Changes p e r hour @ 50 Pa, 1150
S t a n d a r d D e v i a t i o n
TABLE V
.
PRESSURI; 7'ES'I' RL:.StJI,'I'S SOlt'l'lil) ACCORDING TO CONTRACTORC o n t r a c t o r Average A i r Changes Standard No. of Houses p e r hour @ 50 Pa, 1150 D e v i a t i o n i n Sample
- Bungalow B i - l e v e l 1% S t o r e y 2 S t o r e y S p l i t Level
TOTAL NO. OF HOUSES
TABLE VI. PRESSURE TEST RESULTS SORTED
ACCORDING TO CONSTRUCTION STYLE CONVENTIONAL HOUSES 1961-1980
Average A i r Changes/ Standard
hour a t 50 Pa, n50 D e v i a t i o n Number o f Houses
TABLE VII. PRESSURE TEST RESULTS FOR SASKATOON
AND OTTAWA SAMPLES OF CONTRACTOR BUILT HOUSES
Average A i r Changes Standard Number of Houses p e r hour @ 50 Pa, nso Deviation i n Sample
Ottawa Houses 4 . 4 1 1.07 63