Publisher’s version / Version de l'éditeur:
Journal of the Acoustical Society of America, 54, Sept 3, pp. 589-592, 1973-09-01
READ THESE TERMS AND CONDITIONS CAREFULLY BEFORE USING THIS WEBSITE. https://nrc-publications.canada.ca/eng/copyright
Vous avez des questions? Nous pouvons vous aider. Pour communiquer directement avec un auteur, consultez la
première page de la revue dans laquelle son article a été publié afin de trouver ses coordonnées. Si vous n’arrivez pas à les repérer, communiquez avec nous à [email protected].
Questions? Contact the NRC Publications Archive team at
[email protected]. If you wish to email the authors directly, please see the first page of the publication for their contact information.
NRC Publications Archive
Archives des publications du CNRC
This publication could be one of several versions: author’s original, accepted manuscript or the publisher’s version. / La version de cette publication peut être l’une des suivantes : la version prépublication de l’auteur, la version acceptée du manuscrit ou la version de l’éditeur.
Access and use of this website and the material on it are subject to the Terms and Conditions set forth at
Transmission-loss measurements using a correlation technique
Donato, R. J.
https://publications-cnrc.canada.ca/fra/droits
L’accès à ce site Web et l’utilisation de son contenu sont assujettis aux conditions présentées dans le site LISEZ CES CONDITIONS ATTENTIVEMENT AVANT D’UTILISER CE SITE WEB.
NRC Publications Record / Notice d'Archives des publications de CNRC:
https://nrc-publications.canada.ca/eng/view/object/?id=5d5d463a-a554-4fc9-a898-14fd8f9161b6 https://publications-cnrc.canada.ca/fra/voir/objet/?id=5d5d463a-a554-4fc9-a898-14fd8f9161b6
Transdssion-loss measurements using a correlation t e c h ~ q u e
R. j. Donato
,Vattonal Research Council of Canada, Division of Building Research, Ottawa, Ontario, Canada (Received 10 November i972)
T h e merits and demerits of using a time-discrimination technique to measure transmission loss through a wall
.
are discussed. The method differs from those previously reported in that a wideband analogue approach is used throughout and the discrimination is improved by the use of a pre-whitening filter before correlating.Subject Classification: 2.9.
INTRODUCTION correlator followed by an analog heterodyne analyzer. The normal method of evaluating the transmission
loss of a wall is to place the wall between two reverber- ant rooms. One room is used as the exciting enclosure and helps to ensure that a diffuse sound field strikes the wall. The other room is used as a receiving integrator and sums the energy transmitted through the wall.
Sometimes, especially in field measurements, the measurement cannot be made between isolated enclo- sures and the problem of flanking occurs. Even in the laboratory it would occasionally be useful to have an approximate estimate of the properties of a wall without the trouble of using the reverberant facility.
The problem is fundamentally one of time discrimi- nation. One method would be to use a pulse technique by amplitude modulating a carrier frequency. The main difficulty with such a technique is to obtain a reasonable- looking pulse, especially after its transmission through a highly attenuating mechanism like a wall. Most loud- speakers, for instance, tend to ring and the low-fre- quency ringing tends to mask the higher-frequency components in a pulse, especially a t higher carrier fre- quencies. The pulse quality deteriorates and makes measurements d a c u l t . The correlation approach em- ploys the same principle of time discrimination, but pulses and their attendant problems are no longer needed and the analysis can be made using a band of frequencies. Such a technique has been used by Burd1 and more recently by S ~ h o m e r . ~ I t was, in fact, this latter paper that prompted the author to report these measurements made some years ago. Interest in them at the time waned because the measurements were for discrete angles of incidence; to evaluate the transmis- sion loss as normally understood: one would have to integrate the discrete-angle results over a hemisphere.
It is in this area that the practical worth of the tech- nique becomes questionable.
Where the method described in this paper differs from Schomer's is not in the principle but in the technique. Whereas Schomer uses a digital technique throughout, with the Fourier transform of the cross-correlation function performed by computer, we use an analog
The important item is the correlator that retains analog voltage information of the correlation function for a set of time delays, and these voltages are then played sequentially and periodically through various analog processing devices.
I. THEORY
The theory has been adequately described2 and need only be outlined here. We take the time output wave- form of the sound source to be s(t) with a Fourier transform of S(w), the impulse response functions of two microphones spaced either side of the wall to be ml(t), mz(t) with transforms Ml(w), M Z (w), and the impulse function of the wall h(t) with transform H(w).
If ml is the microphone on the source side, then the correlation between microphone signals will be the correlation of s(t)*ml(t) with s(t)*ml(t), where
*
repre- sents convolution.As correlation is backward convolution, we may write for the correlation between the microphones with no wall in place
and the Fourier transform Rl(o) will be
With the wall in place we must substitute for the output of microphone mz the expression s ( ~ ) * h ( ~ ) * m z ( ~ ) . Thus
r2(7) =s(T)*~I(T)*s(-7)*h(-7)*mz(-7) (3)
and
Rz (u) = [S (w>]~MI(w)Mz* (w)H* (w). (4) Thus, from Eqs. 4 and 2,
I n the reverberation room technique we consider ener- gies and effectively measure [H(w)I2. Thus the quantity we need to measure is the modulus of the transfer function (superscript
*
is the complex conjugate).S O U R C E RECEIVE:,
v
H I G H - P A S S
to pass the correlation function through a hete analyzer with a bandwidth less than 12.5 Hz, viz
T R I G G E R
J
+
C O R R E L A T O R 590 Volume 54 Number 3 1973 D E L A Y Iconstant. For a sweep of 1 kHz, occupying 50 sec,
I I time constant was made 1 sec.
111. RESULTS
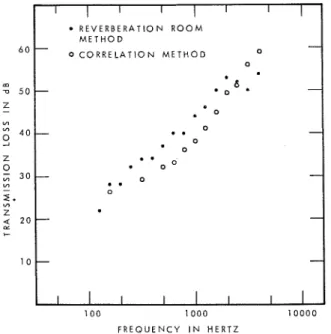
Figures 2, 3, and 4 show the transmissio
H E T E R O D Y N E
A N A L Y Z E R room results are shown for comparison. The correct
trends are present in that as the angle of incidence increases the transmission loss decreases. Only three
L O G A R I T H M I C incident angles were used, 0°, 30°, and 60'. The wall
I I
I
R E V E R B E R A T I O N R O O M M E T H O D-
-
0 C O R R E L A i l O N M E T H O D 0 e . 0-
0 . - m o o 0 - ' 6-
d O d - 0. .
- - --
-
R E C O R D E R 1was lightweight concrete and should display a critical
I I
FIG. 1. Block diagram of analyzer. frequency of about 400 Hz. The reverberation room
results show some plateau effect in the 400-Hz region but the normal incidence results, of course, do not show
11. EQUIPMENT AND EXPERIMENTAL any coincidence effect. The slope is around the theo- CONSIDERATIONS retical 20 dB/frequency decade. With angles other than Figure 1 shows a block diagram of the equipment. the seems be parts- The correlator allowed 100 points to be displayed over a 'lane wave that frequencies variable total delay range. T~ prevent aliasing with below coincidence the slope should be 20 dB/decade and signals in a band 5&5000 Hz the total delay range was above coincidence 60 dB/decade. This may be seen 10 msec. ~h~~ a 5 - m z signal may be just about re- from the classical formula for sound transmission solved. The microphone on the source side was almost loss T :
4 ft from the wall and the one on the receiving side only
6 in. The loudspeaker source was 8 ft from the wall. The (7)-'=
[
1+(vlpr)(i)2
- cos* sin4+]lwall itself was about 8 ft high with the frame adding another 6 in. all around. The frame itself stood about
1 ft off the floor. The microphones were about 5 ft
+r:)1
cos2*[l--(is
sin4*I2, below the top of the frame. Thus the flanking path fromI I
the waii top just exceeded the 10-msec correlator delay. The flanking path from below the waii was obstructed by boarding.
6 0
The effect of the wall is to reduce the high frequencies and this of course broadens the cross-correlation pulse.
To keep the correlation function crisp, a high-pass filter ; 5 0
was included in one of the inputs to the correlator. This z - prevents the correlation function from spilling into the rn
rn 4 0
flanking path signal. The correlator read-out has a
2
maximum rate of two points each millisecond. Thus the frequency content of the output is scaled down by a gfactor of 5. The correlator output display was externally triggered to repeat at 80-msec intervals. Thus the
5
=
2 0output frequency spectrum was effectively passed thrdugh a comb filter at 12.5 H z spacing. Ideally, we + should like to analyze the output waveform using
Q-
10
octave filters. In view of the frequency scaling and frequency spacing, however, we would have few com- ponents at each low-frequency setting. The results,
100 1 0 0 0 l o o 0 0
then, are critically dependent on the relative phases of
these components and could lead to erroneous con- F R E Q U E N C Y I N H E R T Z elusions. The problem could be solved partially by FIG. 2. Transmission loss a t normal incidence.
The Journal of the Acoustical Society of America 591
0
..
0F R E Q U E N C Y I N H E R T Z
FIG. 4. Transmission loss a t 60' incidence.
s a whole series of coincidence points, one for each
ncY the critical, will he presented. Of directivity with either parameter to become steeper. In e, the source is not really a point source and will all, the f 3 relation seems reasonable.
its own directivity Pattern1 possibly of the type Although the change of slope in the transmission Ja(af sin@)/af sin@ where a is a constant and @ is the curve of Figs. 3 and 4 is pronounced, the frequencies a t
angle from the axis. For each coincidence frequency the which the breaks occur do not seem to conform to their angle will change so that both @ and
f
will vary in the theoretical predictions. Considering dispersion of flex-directivity term. For the higher frequencies the angle ural waves in the plate, one would expect the coinci- will approach normal to the wall and the transmission dence frequencies for plane waves a t an angle of 30" to will vary as
f-'
from this cause. With the f 2 dependence be three times the value a t 60°. I t must be mentionedthis will make an f 3 dependence for the trmsmission that the curves have been smoothed before plotting.
law. For angles near the axis of the source both
f
and Inspection of the original data reveals peaks at 400 and sin@ vary; this will cause the relatively slowly changing 1300 Hz for the two angles. These are consistent over several records and although the records are far from smooth one could interpret these peaks to be coinci- dence effects. On the whole and in view of the point source argument, one would tend to treat any con- clusions drawn from the location of these peaks with caution.IV. CONCLUSIONS
The real test is what to do with the data obtained by this method. To compare this method with the standard method one would need to integrate over a range of angles. The main advantages would be in field mea- surements, when flanking effects would normally in- fluence the results, or in quick laboratory checks where one angle of incidence would be sufficient. To the extent that the basic technique has application, the present arrangement has some advantage over previous versions in the use of the prewhitening filter, which helps pre- serve the time discrimination, and in the large amount 6 0 m n 50 Z - m Y1 4 0 -
S
Z 0 30 m - I. Y1 z 2 20 ,- l o100 1000
'
O o o O of data that may be stored using an analog device.F R E Q U E N C Y I N H E R T Z A more pertinent criticism is that the discrete angles
FIG. 3. Transmission loss a t 30' incidence. are not really discrete; because of the point source, one
I I I I I I R E V E R B E R A T I O N R O O M M E T H O D
-
-
0 C O R R E L A T I O N M E T H O D 0 0 -.
0 6 . -.
o 0. .
- 0 ' 0. .
.
o O-
.
.
0-
o-
- --
I I I I IR . J . D O N H T O
obtains results from a range of angles. Thus one has Canada, and is published with Ihe approval of the neither the plane wave nor the diffuse field condition. I t Director of the Division.
would seem to be best to concentrate on the normal
incidence case and obtain results that should be greater N, ~ ~.cCorrelation Techniques in Studio Tesring,m ~ d , than for the diffuse field case. We find, in fact, that the Radio Electron. Eng., 387-395 (May 1964).
results are greater only a t the lower frequencies. '?. D. Schomer, "Measurement of Sound Transmission LOSS b
Combining Correlation and Fourler Techniques," i. Acoust.
ACKNOWLEDGMENT 3 " Soc. Am. 51, 1127-1 141 (1972).
Laboratory Measurement of Airborne Sound Transmission Loss of Building Partitions," ASTM Designation E90-70.
This paper is a contribution from the Division of American Society of Testing and Materials, Book of Building Research, National Research Council of standards, part 14.