Publisher’s version / Version de l'éditeur:
Vous avez des questions? Nous pouvons vous aider. Pour communiquer directement avec un auteur, consultez la première page de la revue dans laquelle son article a été publié afin de trouver ses coordonnées. Si vous n’arrivez pas à les repérer, communiquez avec nous à [email protected].
Questions? Contact the NRC Publications Archive team at
[email protected]. If you wish to email the authors directly, please see the first page of the publication for their contact information.
https://publications-cnrc.canada.ca/fra/droits
L’accès à ce site Web et l’utilisation de son contenu sont assujettis aux conditions présentées dans le site LISEZ CES CONDITIONS ATTENTIVEMENT AVANT D’UTILISER CE SITE WEB.
Journal of the Acoustical Society of America, 77, 2, pp. 557-566, 1985-02
READ THESE TERMS AND CONDITIONS CAREFULLY BEFORE USING THIS WEBSITE. https://nrc-publications.canada.ca/eng/copyright
NRC Publications Archive Record / Notice des Archives des publications du CNRC :
https://nrc-publications.canada.ca/eng/view/object/?id=75179d07-cbf2-4ea6-ab1f-31cb517a2eca https://publications-cnrc.canada.ca/fra/voir/objet/?id=75179d07-cbf2-4ea6-ab1f-31cb517a2eca
NRC Publications Archive
Archives des publications du CNRC
This publication could be one of several versions: author’s original, accepted manuscript or the publisher’s version. / La version de cette publication peut être l’une des suivantes : la version prépublication de l’auteur, la version acceptée du manuscrit ou la version de l’éditeur.
Access and use of this website and the material on it are subject to the Terms and Conditions set forth at
Sound fields near exterior building surfaces
Quirt, J. D.
T H ~
National Research Conseil national
N2ldo. 1275
1
6
Council Canada
de recherche Canada
SOUND FIELDS NEAR EXTERIOR BUILDING SURFACES
by J.D. Quirt
ANALYZED
Reprinted from
Journal of the Acoustical Society of America, Vol. 77, No. 2, February 1985
p. 557
-
566DBR Paper No. 1275
Division of Building Research
La mesure d e l a t r a n s m i s s i o n du son au t r a v e r s d e l a f a s a d e d'un b a t i m e n t e x i g e l a d g t e r m i n a t i o n d e l a p u i s s a n c e a c o u s t i q u e i n c i d e n t e . L ' i n t e r p r g t a t i o n d e s mesures du n i v e a u d e p r e s s i o n a c o u s t i q u e p r s s d'une f a ~ a d e e s t t o u t e f o i s compliquge p a r l e s p h g n o m s n e s d ' i n t e r f g r e n c e e n t r e l e s o n d e s a c o u s t i q u e s i n c i d e n t e s e t c e l l e s q u i s o n t r Q f l C c h i e s p a r l a f a s a d e . Des donnges e x p g r i m e n t a l e s e t un modele mathgmatique s i m p l e s o n t u t i l i s g s pour examiner l e s e f f e t s s y s t g m a t i q u e s l i 6 s aux r 6 f l e x i o n s p r o d u i t e s p a r u n e g r a n d e f a q a d e p l a n e e t , u l t g r i e u r e m e n t , pour G t u d i e r l e s d g v i a t i o n s p a r r a p p o r t 3 c e t t e s i t u a t i o n s i m p l e . Bien que l e motif i n i t i a l d e ces t r a v a u x a i t g t & l ' g t u d e d e s problsmes l i 6 s
3
l a mesure d e l a t r a n s m i s s i o n du son au t r a v e r s d e s f a q a d e s , d e nombreux r d s u l t a t s s o n t a p p l i c a b l e s3
d ' a u t r e s s i t u a t i o n s q u i n g c e s s i t e n t l a mesure du b r u i t p r e s d'une s u r f a c e hautement r g f l 6 c h i s s a n t e .fields
*exte:
rior
E
). Quirtional Resec zrch Cound
-
. - A;il of Cana
,?
da, Divisio ch, Ottawa
ceivea LY June 1 ~ 5 4 ; accepted tor publication ti September 1984)
, Ontario 1 Me; inci I- - -- ,f the le is, I C
asurement of sound transmission through a building facade requires determination c dent sound power. Interpretation of sound pressure level measurements near a facac nowever, complicated by interference between the incident sound waves and those reflectea Irom the facade. Experimental data and a simple mathematical model are used to examine systematic effects associated with reflections from a large flat facade and, subsequently, to investigate
I deviations from this simple situation. Although the original motivation for the work was the
investigation of problems pertinent to measurements of facade sound transmission, many of the
I
results are relevant for other applications involving measurement of noise near a highly reflectiveI surface.
ers: 43.55
At a perfectly reflecting surface, the incident and re- :ted waves have the same amplitude and phase; the result- ; pressure doubling gives a sound pressure level (SPL) 6 dB higher than that for the incident wave alone. Near the sur- face the SPL depends on the phase difference between inci- dent and reflected waves. For a band of noise where phase differences are distributed between 0" and 360", the average SPL approaches 3 dB above the incident wave SPL, an ap- proximate energy doubling from combining the sound pow- er of incident and reflected waves. The practical problem is to determine the cases in which these limits apply and, if possible, to predict (and correct for) interference effects in intermediate cases.
A simple mathematical model to predict the basic fea- tures of the sound field is outlined in Sec. I. Measurements in a hemianechoic room to verify the model are presented in Sec. 11, and Sec. I11 compares measurement and prediction adjacent to large flat building facades. Some effects of facade irregularity are examined in Sec. IV.
I. BASIC PREDICTION MODEL
A simple prediction model was used to demonstrate the potential application of the basic calculation. Despite its simplicity, it gives quite good agreement with experiment. Only a brief outline of the model is presented in Sec. I, but details of the analysis and enhancements of the basic calcula- tion to improve agreement with experiment are given in the Appendix.
The calculations use a plane-wave formulation like that applied by Waterhouse' for the analysis of sound fields at the boundaries of a reverberation room. Direct and reflected waves for a specific frequency ( f ) and angle of incidence (8 ) are treated as fully coherent. The normalized, time-averaged squared pressure at a distance x from a perfectly reflecting surface is
(p2(f,8 )) = 1
+
cos [ (277-fx/c)cos 81,
(1)where c is the speed of sound and 8 is measured relative to the normal to the surface. Contributions from different angles or frequencies are treated as incoherent and are combined by adding their mean-square pressures. Thus for a band of noise incident at angle 8 the time-averaged squared pressure is
where W( f ) is a weighting function corresponding to the spectral balance of the frequency band (such as 1/3-oct fil- tered white noise). Two weighting functions were used for the 1/3-oct calculations: either an "ideal" filter with W( f ) = 1 inside the band and 0 elsewhere, or a function based on the minimum attenuation for a 1/3-oct filter satis- fying Class I11 requirements2 of ANSI standard S 1.1 1. The third frequency weighting used in this study was required for comparison with experimental data obtained using a fast Fourier transform (FFT) spectral analyzer. The specific weighting functions and details of the numerical analysis procedure are given in the Appendix.
For analysis of the sound field from a distributed source such as highway traffic, a further averaging over the angle of incidence 8 is required. The mean-square pressure at dis- tance x from the surface is given by
where A (8 ) is the appropriate weighting as a function of an- gle. For an "ideal line source" (with only attenuation due to geometrical spreading) A (8 ) = 1; i.e., incident sound energy per angular interval is constant. For a more realistic line source excess attenuation (due to atmospheric absorption, ground effect, etc.) tends to reduce the contribution from more distant segments of the line source. To obtain an indi- cation of how this might affect the sound field near a surface, calculations were performed with both A (8) = 1 and A (8 ) = cos 8 (an arbitrary approximation of excess attenu- ation effects).
The calculation procedure outlined is properly applica- ble only for a perfectly reflecting infinite plane. Despite this,
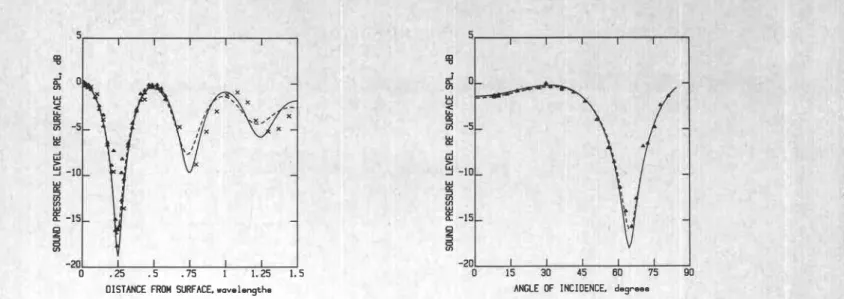
DISTANCE FROM SURFACE. wavelengths
FIG. 1. One-third octave band SPL for normal sound incidence. Experi- mental data are shown for a 2-kHz band
(A)
and 5-kHz band ( X ). The solid line is the predicted variation for an ideal filter and the dashed line the pre- diction for a filter satisfying the minimum class I11 requirement of ANSI S1.11.2agreement with experimental observations is rather good. Possible enhancements to provide even better agreement with measured results are discussed in the Appendix.
II. MEASUREMENTS IN AN ANECHOIC ENVIRONMENT
Preliminary measurements were made near a reflecting surface in an otherwise anechoic room. A 7.2- by 4.8-m (12 by 8 ft) wall of 19-mm-(3/4 in.) thick plywood was mounted at one side of the anechoic room, and a 6.4-mm- (1/4 in.) diam condenser microphone (B&K 4133) mounted through the wall, with its protective cap removed and diaphragm flush with the surface, was used to measure SPL at the sur- face. The sound source was a 25-mm- (1 in.) diam dome loud- speaker located 3 m (1 18 in.) from the microphone at the same elevation. Sound pressure near the surface was usually measured with a second B&K 4133 microphone at the same elevation; this was aimed vertically to give uniform directiv- ity in the horizontal sourcereceiver plane. For some of the measurements this microphone was replaced by one of 3.2- mm (1/8 in.) diam to assess the effect of microphone size; no significant changes were observed.
A. One-third-oct band measurements at normal incidence
The first two series of measurements used 1/3-oct band- limited white noise as the test signal and an integrating sound level meter (B&K 2218) as the detector system. The input to the sound level meter was switched between the outputs of the two microphone preamplifiers to compare SPL at the two microphone locations for each sourcereceiv- er configuration.
For the first series of measurements the source was po- sitioned to give perpendicular incidence at the surface mi- crophone. A second microphone was placed at various posi- tions along a line parallel to the source-surface microphone axis, but offset 50 mm to reduce distortion of the sound field at the surface microphone. The second microphone was cen- tered from 3-100 mm from the reflecting surface. Measure-
-2 0
-0 15 3D 45 60 75 90 ANGLE OF INCIDENCE. degrees
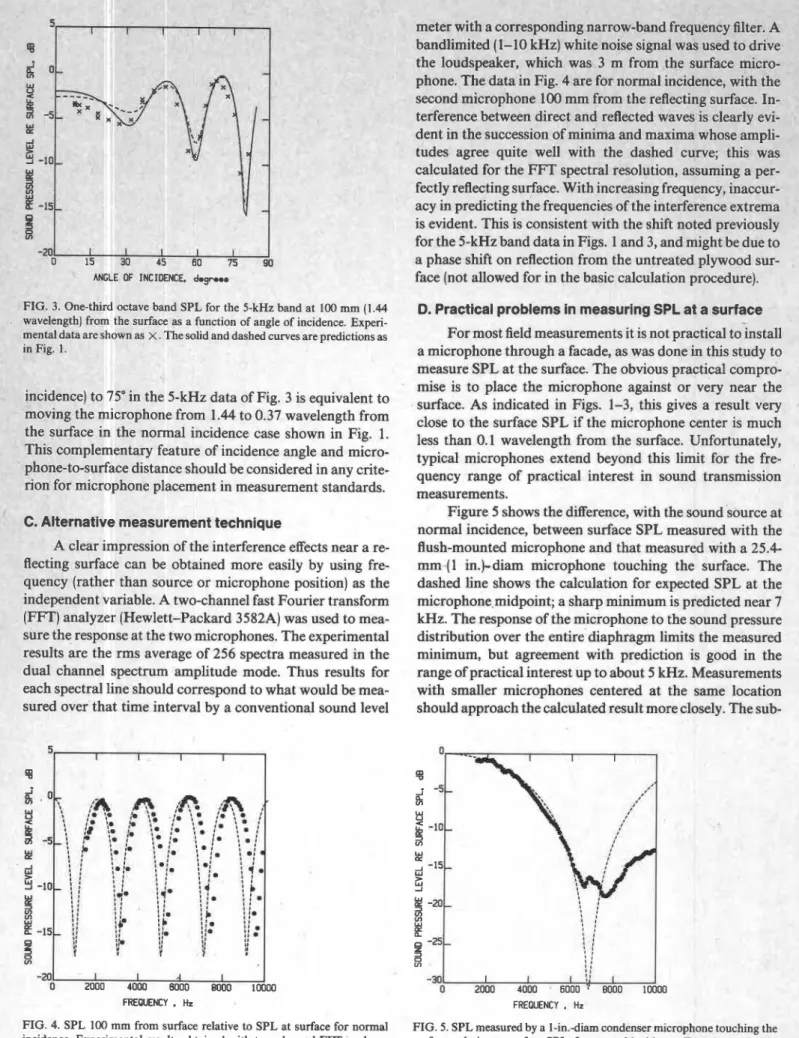
FIG. 2. One-third octave band SPL for the 2-kHz band at 100 mm wavelength) from the surface as a function of angle of incidence. EJ mental data are shown as
A.
The solid and dain Fig. 1 .
shed curve I Ire predictic
(0.5 8 rperi-
ments were made for the 1/3-oct bands at 2 and 5 kHz (Fig. 1). The solid line shows the calculated difference in SPL for an ideal 1/3-oct filter; the dashed line shows the correspond- ing calculation for a filter with the minimum attenuation
needed to satisfy class I11 requirements2 of ANSI standard
S1.ll. As expected, the experimental results generally fall between these limits. Overall agreement of measurement and prediction is good, although data for the 5-kHz band are shifted noticeably from the predicted dependence on dis- tance from the surface. The relation between incident sound power and measured sound pressure changes drastically over the range from 0.1-1 wavelength from the surface, and quite small changes in microphone position can significantlv alter the measured 1/3-oct SPL.
B. One-third-oct band measurements versus angle or incidence
This series of measurements used the same convention- al 1/3-oct instrumentation, with different microphone and source positioning. The second microphone was placed 100 mm from the surface and the loudspeaker was moved to provide angles of incidence ranging from 0" (normal inci- dence) to 70" at the surface microphone.
Data for the 1/3-oct band at 2 kHz are presented in Fig. 2; the angle of incidence for the plotted points is the angle for specular reflection to the second microphone. The predicted effects (solid and dashed lines for an ideal and minimal 1/3- oct filter, respectively, as in Fig. 1) agree very well with the experimental data. Similar experimental and predicted re- sults for the 5-kHz band are presented in Fig. 3. As with the normal incidence data in Fig. 1, the experimental data at 5 kHz are not perfectly aligned with the calculated curve.
The interference extrema occur at frequencies deter- mined by the difference between the direct and reflected paths to the second microphone. Changing the angle of inci- dence gives the same effect as changing the microphone-to- surface distance if the path length difference is the same. For
example, the change with angle of incidence from
O"
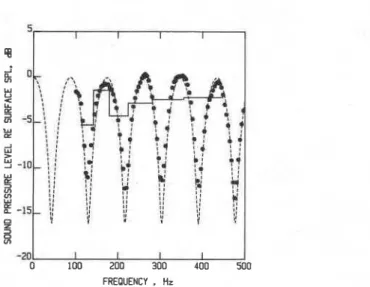
(normaler with a corresponding narrow-band r filter. A ----dlimited (1-10 kHz) white noise signal was used to drive the loudspeaker, which was 3 m from the surface micro- phone. The data in Fig. 4 are for normal incidence, with the second microphone 100 mm from the reflecting surface. In- terference between direct and re :arly evi- dent in the succession of minim2 re arnpli- tudes agree quite well with tl this was calculated for the FFT spectral resolution, assuming a per- fectly reflecting surface. With increasing frequency, inaccur- acy in predicting the frequencies of the interference extrema is evident. This is consistent with the shift noted previously for the 5-kHz band data in Figs. 1 and 3, and might be due to a phase shift on reflection from the untreated plywood sur- face (not allowed for in the basic calculation procedure). met hanl :fleeted w; and m a le dashec
-
aves is cle ;ima whor 1 curve;ANGLE OF INCIDENCE. d.gr-.e
G. 3. One-third octave band SPL for the 5-kHz band at 100 mm (1.44 velength) from the surface as a function of angle of incidence. Experi- lntal data are shown as x . The solid and dashed curves are predictions as Fig. 1.
D. Practical problems in measuring SPL at a surface
For most field measurements it is not practical to install a microphone through a facade, as was done in this study to measure SPL at the surface. The obvious practical compro- cidence) to 13- in the >-kHz data of Fig. 3 is equivalent to
oving the microphone from 1.44 to 0.37 wavelength from e surface in the normal incidence case shown in Fig. 1. his complementary feature of incidence angle and micro- lone-to-surface distance should be considered in any crite- 3n for microphone placement in measurement standards.
mise is to place the microphone against or very near the surface. As indicated in Figs. 1-3, this gives a result very close to the surface SPL if the microphone center is much less than 0.1 wavelength from the surface. Unfortunately, typical microphones extend beyond this limit for the fre- quency range of practical interest in sound transmission measurements.
1 A
PI ric
Alternative measurement technique normal incidence, between surface SPL measured with the Figure 5 shows the difference, with the sound source at
flush-mounted microphone and that measured with a 25.4- mm (1 in.)-diam microphone touching the surface. The dashed line shows the calculation for expected SPL at the microphone midpoint; a sharp minimum is predicted near 7 kHz. The response of the microphone to the sound pressure distribution over the entire diaphragm limits the measured minimum, but agreement with prediction is good in the range of practical interest up to about 5 kHz. Measurements with smaller microphones centered at the same location should approach the calculated result more closely. The sub-
C. fle
A clear impression of the interference effects near a re- ..-cting surface can be obtained more easily by using fre- quency (rather than source or microphone position) as the independent variable. A two-channel fast Fourier transform (FFT) analyzer (Hewlett-Packard 3582A) was used to mea- sure the response at the two microphones. The experimental results are the rms average of 256 spectra measured in the dual channel spectrum amplitude mode. Thus results for each spectral line should correspond to what would be mea- sured over that time interval by a conventional sound level
0 2000 4000 8000 8000 10000 FREQUENCY
.
HzFIG. 4. SPL 100 mm from surface relative to SPL at surface for normal incidence. Experimental results obtained with two-channel FFT analyzer as shown as 8. The dashed curve is the corresponding predicted variation with frequency, as discussed in the text.
-MI
I 1,
I' ,:,
0 2000 4000 6000 BOO0 10000 FREQUENCY
.
HzFIG. 5. SPL measured by a 1-in.-diam condenser microphone touching the surface, relative to surface SPL, for normal incidence. Experimental FFT data are shown as 8 and the dashed line is the corresponding predicted difference from surface SPL at the microphone midpoint.
FIG. 6. SPL measured by 0.5-in.-diam (e) and 0.25-in.-diam ( X ) condenser
microphones touching the surface, relative to surface SPL, for normal inci- dence. The dashed and solid lines are the corresponding predicted differ- ence in SPL for the microphone midpoint.
stantial deviations from the predicted curve above 7 kHz are primarily due to diffraction and microphone response char- acteristics typical of free-field condenser microphones of this size in this frequency range. There are, however, small devia- tions from predicted behavior even at lower frequencies. Similar deviations are evident in the results presented in Fig. 6 for 12.7-mm (0.5 in.) and 6.3-mm- (0.25 in.) diam micro- phones touching the surface. These deviations are believed to be due to the perturbation of the sound field at both micro- phones by diffraction and scattering from the second micro- phone and its stand; similar effects have been reported else-
here.^,^
For the frequency range of practical interest (up to 5
kHz) the experimental data are within
-
1 dB of the predict- ed results. The data in Figs. 5 and 6 (all for normal incidence) show the worst case, both for differences between measured and predicted performance and for deviation from pressure doubling at the microphone touching the surface. Increasing-201 I I I I I
0 100 200 300 400 500
FREQUENCY , Hz
FIG. 7. SPL 2 m from a facade relative to surface SPL, for normal inci- dence. Experimental FFT data are shown as @; the dashed line is the corre- sponding predicted difference. The solid curve is the 1/3-oct band differ- ence calculated from the measured FFT results.
560 J. Acoust. Soc. Am.. Vol. 77, No. 2, February 1985
the angl
- . .
e of incidence shift s the first. - -
interfere] nce minimto hlgher frequencies or, equivalently, extends the dist;
from the surface for which pressure doubling is a gooc
proximation. Thus, for example, the results for a 1-in. mi
phone with sound incident at 60" are similar to those sh in Fig. 6 for normal incidence on a 1/2-in. microphone
Ill. MEASUREMENTS NEAR FLAT FACADES
A. Influence of outdoor propagation effects
num ance
l ap-
Icro-
---
Results quite similar to those presented in Sec. I1 be observed adjacent to building facades (Fig. 7). SUI sound pressure was measured with a 12.7-mm (0.5 in.h condenser microphone (B&K type 4149) touching the face near the middle of the wall approximately 1.5 m a1 the ground surface. A loudspeaker system on the ground 25 m from the surface microphone gave a white noise signal at essentially normal incidence. A second microphone of the same type was placed 2 m from the exterior wall, in line the source. Both microphones were mounted on prean
fiers (B&K type 2619) and pointed vertically. Both had f;
windscreens; that on the surface microphone had a slia
off to permit microphone placement within
-
1 mm oisurface. The predicted difference in SPL (dashed c u n Fig. 7) was calculated for the path length difference betv the direct and reflected rays from the loundspeaker to second microphone. Reflections from the ground sur were ignored in the calculation.
: cut F the Ie in ,,nnn
.
bC11 I the face with npli- oam ---- liam sur- 3oveLocation of the experimental maxima and minima in good agreement with the predicted curves; but the mil
were not so pronounced as those in the anechoic room
,,.,
(Fig. 4), and the maxima differed noticeably from the dicted 0 dB. Measurements with different loudspeaker microphone positions at several facades gave comparabl
sults; the maxima were typically within
-
1 dB of thedicted value (much closer on average) and the mil ranged from 2-8 dB above the predicted values.
The most obvious explanation for these deviations,from prediction is interference with sound waves reflected from the ground surface. Another factor, which should be checked in outdoor propagation, is the effect of atmospheric
t~rbulence.~ The prediction model assumes perfect coher-
ence between direct and reflected waves at any frequency. At the surface microphone the direct and reflected rays should be coherent because path length difference is negligible, but turbulence could reduce coherence between the direct and reflected waves reaching the microphone 2 m from the sur- face. In frequency ranges where the result of the direct wave and that reflected from the wall is the same at the two loca-
tions (i.e., where the phase difference =360 X an integer) the
correlation between the signals from the two microphones gives a direct measure of correlation between direct and re- flected waves at the second microphone. The "coherence amplitude" was measured with the HP3582A FFT analyz-
er. For anechoic room data (Fig. 4) coherence was 2 0.995
near the interference maxima; for data like those in Fig. 7 the
coherence was 2 0.98. This reduction in coherence would
not significantly affect the results near the maxima, and even at the minima (where interference cancels the coherent com- ponents) they should have much less effect than the observed pre- ,and le re- pre- lima L Was nima d o t o
' FIG
:
EXPrl;ffe
FREUUENCY
.
Hz1
aoo iooo
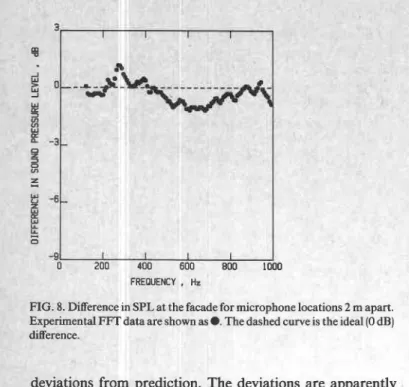
8 . Difference in SPL at the facade for microphone locations 2 m apart. erimental FFT data are shown as @. The dashed curve is the ideal (0 dB)
,-e""e
dev .om prediction. The deviations are apparently
caused by source directionality or differences at different measuring positions in the interference due to ground reflec- tions.
The effect of reflections from the ground surface can be shown more directly by examining the variation in sound pressure level over the wall surface. Figure 8 gives the mea- sured difference in SPL at two microphones 2 m apart, both touching a large flat masonry wall. Changing the micro- phone or source positions altered the dependence on fre- quency. Decreasing the microphone separation to 200 mm reduced maximum intermicrophone differences to -0.5 dB. Interchanging microphone positions inverted the measured interchannel differences, showing that these are differences in SPL at the measurement positions, with negligible distor- tion by instrumentation effects such as microphone re- sponse.
-gl 1 I I I
0 200 300 600 800 1000
FREQUENCY
.
HzFIG. 9. Difference between the "free-field" SPL (beyond a building comer) and the SPL at the building surface. Experimental data for one case (second microphone 2 m beyond comer and surface microphone 1 m from the cor- ner) are shown by @. The solid curve is the difference betwen the averages
for three positions beyond the comer and three positions on the surface. The dashed line shows the ideal (6 dB) difference expected due to pressure dou- bling at the surface.
561 J. Acoust. Soc. Am., Vol. 77, No. 2, February 1985
:
interfert. -
-
Changin~ :rice between direct and ground-re-
flected waves mlght be due to changes in path length differ- ence and/or variations in the complex reflection coefficient of the rather bumpy grass-covered surface between the loud- speaker and the wall. One obvious implication of the results is that several measuring positions are needed for accurate determination of the average sound pressure level at the sur- face of a building facade.
The data obtained using the FFT analyzer provide ex- tra insight into the relevant physical effects, but for practical applications 1/3-oct results are of primary concern. Fortu- nately, 1/3-oct spectra can be synthesized readily from the two FFT spectra to obtain the corresponding differences in 1/3-oct band SPL, as shown by the solid curve in Fig. 7. Expressing the results in 1/3-oct bands reduces the apparent interference effects; for the high-frequency bands the differ- ence in SPL approaches 3 dB, as expected, but the smaller bandwidth of the lower bands permits resolution of the inter- ference pattern and substantial deviations from the 3-dB dif- ference.
B. Comparison of surface and incident sound pressure
In addition to the practical problems of measuring the average sound pressure level at the surface, the relation between this average surface SPL and that for the incident wave must be established. Standards for measuring facade sound transmission6.' commonly assume that SPL at build- ing surfaces is 6 dB higher than that for the incident wave. Diffraction and response of the surface to the sound field could introduce deviations from this assumption. To investi- gate, measurements were made at several positions on the wall surface and beyond the corners of two different build- ings. The sound source was on the ground surface 25 m from the comer, in the plane of the second wall surface, to provide essentially normal incidence at the surface microphone and no geometric reflection at the second (free-field) micro- phone. Results with the surface microphone 1 m from the comer and the second microphone 2 m beyond the corner are given the symbol in Fig. 9; corresponding data for the other building may be seen in Fig. 6 of Ref. 8. Significant variation with frequency is evident; this depended strongly on location of the surface and free-field microphones relative to the comer. For nominally identical microphone locations the results at the two buildings exhibited different variations with frequency. The differences in results for the two build- ings indicate that systematic effects such as diffraction fringes at the comers do not dominate the observed frequen- cy dependence. Because similar effects were observed far from the comers (as in Fig. 8), it seems reasonable to at- tribute both to variations in the interference with reflections from the ground surface. The solid curve in Fig. 9 shows the effect of averaging over three microphone locations (0.5, 1, and 2 m from the comer) to determine average and free-field sound pressure levels. This averaging reduces the deviation
from the expected 6-dB difference to
-
1 dB. Combiningresults from several comers (with different ground effects) and converting to 1/3-oct bands would further reduce the deviations. On average, the assumption of pressure doubling at building surfaces appears to be quite accurate.
FREQUENCY
.
HzFIG. 10. SPL 2 m from building facade relative to surface SPL for 60" inci-
dence. Experimental FFT data are shown by 0; the dashed line is the corre-
sponding predicted difference. The solid line gives the 1/3-oct band results
synthesized from the measured FFT data.
C. Variation with angle of incidence
The variation with angle of incidence observed at the building facade showed good agreement with the basic cal- culation. Figure 10 shows the difference between SPL at the
surface and that 2 m from it for an angle of incidence of 60" at
the surface microphone. Comparing this with the data in Fig. 7 for normal incidence and the same microphone loca- tions, the increased separation of the interference extrema is obvious. As in Fig. 7, agreement with prediction is generally good, but there are deviations presumably due to ground reflections. The changing frequency dependence gives more resolution of the interference pattern in the relevant 1/3-oct bands with increasing angle of incidence (solid curves in Figs. 7 and 10). It should be emphasized that distance from the surface plays an equivalent role: For normal incidence, a microphone 1 m from the surface would give the same result as that shown in Fig. 10; with increasing angle of incidence even larger deviations from the commonly assumed energy doubling (3 dB below surface SPL) would occur in the lower 1/3-oct bands. For measurements with a moving point source, such as a truck or an airplane, the changing interfer- ence pattern (as the source passes) gives a changing relation between the sound power level of the incident wave and the sound pressure level measured near a reflecting surface. A similar problem due to the effect of ground reflections has been discussed by Yamada.9
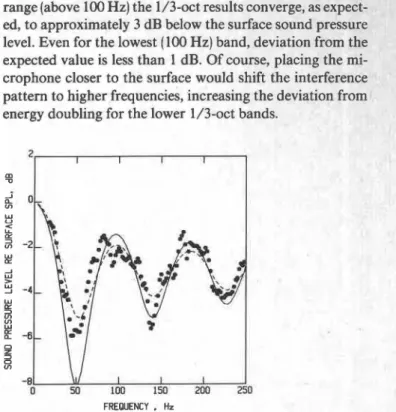
Fortunately, the most common practical problem, noise from road traffic, involves sound incident from a range of angles. Because of the systematic change in interference pattern with angle of incidence, these effects are reduced by averaging over a distribution of sources. Figure 1 1 shows the predicted and measured differences in SPL for microphones
touching and 2 m from a large flat masonry wall facing a
major highway. The calculation (dashed line in Fig. 1 1) as-
sumes a perfectly reflecting surface and an ideal line source,
with frequency weighting corresponding to the FFT data.
The equivalent curve for 1/3-oct resol~tion'~ is very similar.
Below 150 Hz the predicted and measured results in Fig. 11 show good agreement, but increasing scatter is evi-
-8 -0 100 200 300 FREQUENCY
.
Hz to surface S Experimen~..
L ~ .FIG. 11. SPL 2 m from a concrete wall relative 1PL; the soul
traffic on a nearby road parallel to the facade. tal FFT dat
shown by 0; the dashed line is the corresponding prealccea difference fi "ideal line source" as discussed in the text. The solid cun
band results synthesized from the FFT data.
re shows 1/ rce is a are
dent at higher frequencies. This is probably due to at spheric turbulence. The calculation assumes perfect co
ence between the direct and reflected waves from (
element of the line source; this is obviously not physic realistic for long-distance outdoor propagation. Unfc nately, with sound simultaneously incident from a rank, angles there is no straightforward means of measuring coherence for a single angle of incidence (which is the evant concern for the prediction model).
The solid curve in Fig. 11 presents 1/3-oct data ca lated from the FFT spectra. For the practical freque
range (above 100 Hz) the 1/3-oct results converge, as exp
ed, to approximately 3 dB below the surface sound pres: level. Even for the lowest (100 Hz) band, deviation from expected value is less than 1 dB. Of course, placing the crophone closer to the surface would shift the interfert pattern to higher frequencies, increasing the deviation f energy doubling for the lower 1/3-oct bands.
;mo- her- 2ach ; the rel- lcu- :ncy ~ect- sure I the mi- l " F P *LA"- rom FREQUENCY
.
HzFIG. 12. SPL 2 m from a wall relative to surface SPL with traffic noise from
road parallel to the facade. Experimental FFT data are shown by 0. The
dashed and solid lines are the corresponding predicted differences for an "ideal line source" and "modified line source," respectively.
from thc
Data
fc
hone posiwall are presented in Fig. 12. As in Fig. 1 1, the dashed curve was calculated for an "ideal" line source. The source curve in Fig. 12 was calculated for a modified line source (as dis- cussed in Sec. I), with an arbitrary reduction in the relative contribution from more distant elements of the line source. The experimental data fall between the two prediction curves. This is not a proper test of the modified angular weighting because the stronger interference effects due to reducing the contribution from large angles of incidence are doubtless offset here by the appreciable incoherent compo- nent in the signal (indicated by the scatter in the experimen- tal spectrum). The balance between these effects would clearly depend on both the site and atmospheric conditions; for p;actical purposes the ideal line source calculation pro- vides a reasonable (if slightly conservative) estimate of the typical interference pattern.
Similar trends were evident in 1/3-oct band data ob- tained by Hall et al.,1° except for an anomalous deviation in the 40-Hz band. The present data (for a very large, feature- less, painted masonry facade) show no anomaly around 40 Hz. It is believed that the 40-Hz anomaly and the apprecia- ble scatter from site to site in the previous study lo were due to
reflections from protruding roofs and other facade irregular- ities, as will be discussed in Sec. IV.
IV. EFFECT OF FACADE IRREGULARITY
The data presented in Sec. I11 were all obtained adja- cent to large flat masonary facades. In practice, measure- ments are often required at more complex facades where reflection from protruding elements or the low impedance of some surfaces may cause deviations from what would be observed at a uniform, highly reflecting facade. Measure- ments were made to assess the typical strength and probable cause of such deviations.
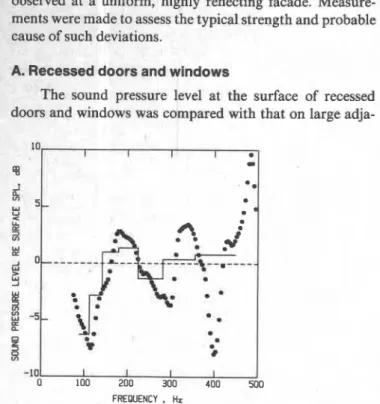
A. Recessed doors and windows
The sound pressure level at the surface of recessed doors and windows was compared with that on large adja-
I I I I
1
0 100 200 300 400 500
FREQUENCY
.
HzFIG. 13. SPL at a recessed window surface relative to SPL at an adjacent wall surface. Experimental FFT data are shown by 0; the solid curve is the corresponding 1/3-oct band SPL difference synthesized from the measured FFT data.
563 J. Acoust. Soc. Am., Vol. 77, No. 2, February 1985
FIG. 14. Experimental arrangement for controlled simulation of a recessed surface. Both microphones were in contact with the concrete wall. The glass fiber wedge at the left side of the 1 X 1 m plywood frame was added to reduce reflections from the frame to the reference microphone position at the left.
cent wall surfaces of several buildings. A typical experimen- tal result at a window surface is given in Fig. 13; similar data for measurements on a door surface have been published.' There are no obvious differences between the effects at doors and windows. The intermicrophone SPL differences were much greater than those shown in Fig. 8 for two positions on a flat facade. Changing the angle of incidence or the micro- phone position on the recessed surface strongly altered the observed frequency dependence. Averaging over 1/3-oct bands (solid curve in Fig. 13) reduced the apparent frequency dependence, but significant effects were still evident in the low-frequency bands.
Because of uncertainty about the impedance of their surfaces, the local variation in SPL adjacent to doors or win- dows might be due to either resonant response of the surface to the sound field or reflection and diffraction from the sur- rounding frame.
B. Controlled simulation of a recessed surface
To investigate the cause of the effect observed at doors and windows, another series of measurements was made, after adding a rectangular frame to an otherwise featureless masonry facade (Fig. 14). This frame was made of 38-mm (1.5 in.)-thick plywood and had interior dimensions 1 X 1 X0.2 m ( 4 0 x 4 0 ~ 8 in.). A wedge of glass fiber was added at one side to reduce reflections towards the reference position on the wall surface near the frame. The loudspeaker source was placed on the ground surface 25 m from the frame midpoint to given an angle of incidence of 0", 30", 45", or 60" at the frame.
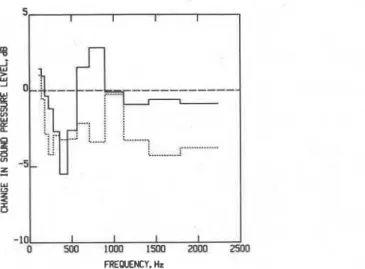
Figure 15 shows the effect of adding the frame for a microphone touching the wall surface at the frame's mid-
FIG. 15. Change in SPL at the wall surface due to added surrounding plywood frame. The dashed line shows the FFT data for normal incidence and the solid line the FFT data for 60" incidence; both were measured at the box midpoint.
point. The average effect of the frame at the reference posi- tion and the average difference between the two measure- ment positions without the frame were determined from repeated measurements with small alterations in micro- phone, source, and frame positions for each angle of inci- dence. Applying these corrections to the intermicrophone difference for positions, as illustrated in Fig. 14, gave the nominal change at the second microphone due to addition of
the surrounding frame. The two sets of data for 0" and 60"
incidence in Fig. 15 illustrate the trend to stronger frequency dependence with increasing angle of incidence. For any fre- quency, both the amplitude and the sign of the change in SPL depend on the angle of incidence. For a fixed angle of incidence, similar changes in SPL difference were observed between different positions on the wall surface within the frame area.
It seems safe to reject the possibility that addition of the frame significantly alters the response of the masonry wall surface. To investigate the possible effect of a low surface impedance, however, measurements were made with a 3-
-101 I I I I I
0 500 IWO 1500 ZWO ;5M1
FREQUENCY. Hz
FIG. 16. Change in 1/3-oct band SPL (synthesized from FFT data) at the wall surface due to added surrounding plywood frame. The solid curve is the average for eight positions on the surface inside the frame. The dashed curve is for one of these positions (165 mm from bottom, 380 mm from left).
V. SUMMARY Plexiglas
--
12 / A unted insi +LP m n n n de the fra.,-,
o..rPn 'the framc l pressure nost banc r-in.)thick panel moi
aPp~ua~~llately 20 I U ~ U T in.) from u a a u l l l j a u l a b b .
The results were almost identical to those shown in Fig.
the amplitudes of the extrema matched within
-
1 dB atheir frequencies were unchanged. These minimal than,__
and the similarity between the results in Figs. 13 and 15
suggest that the strong variation in SPL observed at the sur- face of recessed doors and windows is primarily due to inter- ference of waves reflected from the surrounding frame.
Because the sound pressure level at the surface is mc fied by this effect, sound transmission through a wind
may depend on the shape and depth of
:.
The curin Fig. 16 show the change in sound : level at
surface due to the added frame. For I Is the SPI
reduced even in the solid curve (an average lor eight pc-: tions, most on symmetry axes) and the reduction is m pronounced in the dashed curve (which was for a low s j
metry position). The number of measurement positions L---
angles of incidence were insufficient for quantitative assess- ment, but the data suggest a reduction in SPL at the surface (and hence an increase in effective sound transmission loss). This seems to be a free-field equivalent of the "niche effect" reported in reverberant room sound transmission studies.
The practical problem is to assess whether use of sound pressure levels measured at a recessed surface will sigr cantly distort the resulting 1/3-oct band sound transmiss results. The solid curve in Fig. 16 shows the effect of frame on the sound pressure level average for eight positi~ at the wall surface within the frame. If simple pressure d bling were assumed, this effect would significantly disl
the apparent spectrum of the incident wave. The data in 1
.,.
16 are for 60" incidence; for a distributed source the angular averaging should diminish the effect. The scatter evident in previously published data1' for SPL at window surfaces ex- posed to traffic noise suggests, however, that angular aveI ing does not reduce the effect to insignificance. Despite tl
common it seems prudent to avoid the
of sound pressure level measurements at a recessed surface to determine the incident sound power. Where no alternative is feasible, the average for many positions on the surface should be used. d i - low Yes the is JS1- ore rm- and iifi- ion the ons OU- ;ort 7i rr .ag- leir use
The basic problem examined in this study is the accu- rate determination of sound power incident on a facade from measurements of the sound pressure level near the surface. Owing to changing interference between direct sound waves and those reflected from the ground surface, the average of measurements at numerous positions distributed across the surface is required for an accurate measurement of incident sound power.
In addition to averaging out perturbations due to ground reflections, one must make allowance for the inter- ference effects of reflections from the building surface. To simplify measurement procedures it is clearly desirable to position the outdoor microphone(s) so that "pressure dou- bling" (SPL 6 dB higher than that for the incident wave) or "energy doubling" (SPL 3 dB higher than that for the inci- dent wave) may be assumed for the frequency range of inter-
L U di 6- I al' :ds for m
...-
Ll....--
est. Existin easuring sound tri n
+'-rough fa~au- I U U ~ ~ I L ~ ~ n t r i c t themselves to LLL-G WLI-
tions. In many practical measurement situations the 3- and dB approximations are not appropriate and explicit -1owance for the interference effects is required in determin- ing incident sound power from measured sound pressure lev- els. Fortunately, the necessary corrections can be calculated quite accurately with a simple prediction model.
A good approximation to pressure doubling is ob- served, on average, very close to flat building surfaces. As a rough guide, the deviation from pressure doubling should be negligible if the microphone does not extend beyond -0.05 wavelength from the surface. For the frequency range of
common interest (up to
-
5 kHz) the effects will not be negli-gible except for small microphones (diameter under 13 mm) essentially touching the surface. The appropriate correc- tions depend on microphone position and angle(s) of inci- dence, and can be calculated as shown in Figs. 5 and 6.
At recessed surfaces such as doors and windows, strong interference and/or diffraction effects are common. Averag- ing over many positions on the recessed surface reduces the deviations from pressure doubling, but a systematic effect (possibly analogous to the "niche effect" in sound transmis- sion between reverberant rooms) seems to be involved.
The assumption of energy doubling at 2 m from a build- ing surface is a reasonable approximation for a distributed source, such as road traffic, for 1/3-oct bands above 100 Hz. The low-frequency limit is inversely proportional to distance from the surface. For a point source, interference between the incident wave and that reflected from the surface signifi- cantly alters the relation between incident sound power and measured sound pressure level. The effects are most pro- nounced for the low-frequency 1/3-oct bands, and depend on both microphone position and angle of incidence. These effects can be calculated (and hence corrected for) with rea- sonable accuracy.
ACKNOWLEDGMENT
APPENDIX: DETAILS OF THE PREDIC' DEL
The general features of the mathematical model for pre- dicting sound pressure level near a reflecting surface are out-
lined in Sec. I. This Appendix gives details of applications of
the basic prediction model and presents enhancements to the model to allow for the finite impedance of real facades.
A. Results for a band of noise
For a band of noise, the expression for the mean-square sound pressure level in Eq. (2) was evaluated numerically from the weighted contributions for a series of frequencies distributed across the band. The 1/3-oct band calculations used 15 1 frequencies at intervals of 1/200 of the center fre- quency. Two weighting functions were used to approximate the limits for typical 1/3-oct filters: The "ideal" weighting
function is W( f ) = 1 inside the passband and 0 elsewhere;
the second limit was the minimun class I11 attenuation re- quirement2 of ANSI standard S1.ll. For this
where fm is the band midfrequency. Where the expression in
Eq. (Al) exceeds unity in the passband, the limit W( f ) = 1
was used.
The third frequency weighting used in this study was required for comparison with measurements using a Hew- lett-Packard HP3582A FFT analyzer. The experimental data were obtained in the dual channel spectrum amplitude mode from the rms average of 256 spectra. Thus the results for each spectral line should correspond to the rms sound pressure level that would be measured by a sound level meter with an appropriate frequency band filter. The "flat top passband shape" was used for the measurements; this has a time-domain window with a 10% cosine taper at its limits,
giving an effective bandwidth for each spectral line of 0.029 - -
This paper is a contribution from the Division of Build- of the spectrum bandwidth. The weighting function used in
ing Research, National Research Council of Canada, and is the calculations to provide equivalent frequency resolution
published with the approval of the Director of the Division. was
W ( f ) = 1, near the nominal frequency,
(1
f -fol
5 0.0136 f,)= 0, outside the passband,
(I
f - foJ>
0.0156 f,), (A21I
where f, is the nominal frequency of the spectral line. The evaluated numerically using an angular increment of l o for
numerical evaluation of the integrals in Eq. (2) used this angles from 0.5" to 89.5" to obtain the curves in Figs. 11 and
expression for W( f ) at 80 frequencies at intervals of 1/2500 12. Similar results for 1/3-oct frequency bands were present-
of the spectrum bandwidth. ed in an earlier paper. lo
6. Calculations for distributed sources
C. Extension to include facade absorption
For prediction of the sound field generated by distribut-
ed sources such as road traffic a further averaging over the Although real facades are highly reflective, they do ab-
angle of incidence was performed, with the angular weight- sorb sound energy, especially at low frequencies. For a local-
ingfunctionsA (0 ) given in Sec. I. Theintegrals in Eq. (3) were ly reacting surface with a real impedance (i.e., no phase shift
wherc admil
flection) t
-
---
111-. ::he effect of energy
.-.. 1 - A:-- , transfer v - 1 1 t
--:.
into the I L , r,. . . - - surfacee r a u u y mcluded, replxlng q. ( 1 j wlcn me expression
=
4
11
+
R+
2R
cos[(2~fx/c)cos 8I),
(A31 .-
: R is the reflectio: ttance /3 of the s d n coefficic ace by d to the ! specificThe specific admittancep may be related to the normal inci-
dence absorption coefficient a0 and thus to the random inci-
dence absorption coefficient a.12 For an exterior facade, ab-
sorption coefficients exceeding 0.2 are unlikely. Calculations were made for a quite absorptive surface (a from 0.04 above 1 kHz to 0.2 at frequencies below 160 Hz) and some results have already been presented.'' Quantitative details are not of great significance because of probable physical deviations from the assumptions of real surface impedance and local reaction. The qualitative features are, however, worth not- ing: Inclusion of surface absorption should affect measured sound pressure levels near a facade by less than 0.5 dB, with substantially smaller effects for the difference between sur- face SPL and that near the surface (the measurement situa- tion in this study).
In cases where the impedance of a surface is known, the modified expression for ( p2(f,8 ))could be used in the calcu- lation procedure outlined in Sec. I. Allowance for a known
phase shift 4, on reflection, by adding
4
to the argument2rfx C O S ( ~ ) / C is another possible refinement. In principle,
the surface impedance, and hence the relevant values of R
and 8, can be mea~ured.~.'~ These enhancements of the basic
calculation were not applied to this paper because the infor- mation on surface impedance would not be available in com-
mon practice and the basic calculation seen quate accuracy.
n Reverbera
ns to give ! ade-
elds," 'R. W. Waterhouse, "Interference rarterns 1 mt Sound Fi
J. ACOUS~. SOC. Am. 27,247-258 (1955).
'American National Standards Institute, ':American Standard Spe tion for Octave, Half-Octave and Third Octave Band Filter Sets," Sl. 11-R1976 (American National Standards Institute, New York, 3J. Tichy, "Some Effects of Microphone Environment on Intensity
surements," in Proceedings of International Conference on Recent,
opments in Acoustic Intensity Measurement (CETIM , Senlis, F 1981), 25-30.
4M. Zollner, "Eifluss von Stativen und Halterungen auf den Mikrof quenzgang" (Influence of stands and mountings on the frequency res of microphones), Acustica 51,268-272 (1982).
5G. A. Daigle, "Effects of Atmospheric Turbulence on the Interfere Sound Waves Above a Finite Impedance Boundary," J. Acoust. Soc 65,4549 (1979).
61S0 140/V-1978, "Acoustics-Measurements of Sound Insulatl Bulldings and of Building Elements-Part V: Field Measurements (
borne Sound Insulation of Facade Elements and Facades," I n t e r n a c r u ~ ~ ~ Standards Organization (1978).
'ASTM E966-83, "Guide for Field Measurement of Airborne Sound lat~on of Building Facades and Facade Elements" ASTM, Philadc PA (1983).
"J. D. Qu~rt, "Sound Fields Near Building Facades," Proceedings of noise 83, repnnted in Can. Acoust. 12,(2), 48-51 (1984).
91. Yamada, "Cross Spectral Method for the Estimation of Ground I
tlon Characterist~cs and Free-Field Spectrum of Noise," J. Acoust L-
Jpn. (E) 1,249-259 (1980).
'OF. L. Hall, M. J. Papakyriakou, and J. D. Quirt, "Comparison of Microphone Locations for Measuring Sound Insulation of Buildil cades," J. Sound Vib. 92(4), 559-567 (1984).
"P. T. Lewis, "A Method for Field Measurement of the Transmissio~ of Building Facades," J. Sound Vib. 33, 127-141 (1974).
"A. COPS and H. Myncke, "Determination of Sound Absorption (
cients Using a Tone Burst Technique,"Acustica 29, 287-296 (1973 13T. Yamagisawa and H. Takayama, "Coherence Coefficient Mea
System and its Application to Some Acoustic Measurements," Acoust. 16, 105-1 19 (1983). cifica- ANSI 1976).
- -
Mea- Devel- rance, nce of :. nm. ion in )f Air- *:---q I Insu- :lphia, Inter- teflec- ddoor ig Fa- n LossT h i s p a p e r , w h i l e b e i n g d i s t r i b u t e d i n r e p r i n t form by t h e D i v i s i o n of B u i l d i n g R e s e a r c h , remains t h e c o p y r i g h t of t h e o r i g i n a l p u b l i s h e r . It s h o u l d n o t be r e p r o d u c e d i n whole o r i n p a r t w i t h o u t t h e p e r m i s s i o n of t h e p u b l i s h e r . A l i s t of a l l p u b l i c a t i o n s a v a i l a b l e from t h e D i v i s i o n may be o b t a i n e d by w r i t i n g t o t h e P u b l i c a t i o n s S e c t i o n , D i v i s i o n of B u i l d i n g R e s e a r c h , N a t i o n a l R e s e a r c h C o u n c i l o f C a n a d a , O t t a w a , O n t a r i o ,