Mind the Gap: An Experimental Evaluation of Imputation of
Missing Values Techniques in Time Series
Mourad Khayati, Alberto Lerner, Zakhar Tymchenko and Philippe Cudré-Mauroux
University of Fribourg Switzerland
{firstname.lastname}@unifr.ch
ABSTRACT
Recording sensor data is seldom a perfect process. Fail-ures in power, communication or storage can leave occa-sional blocks of data missing, affecting not only real-time monitoring but also compromising the quality of near- and off-line data analysis. Several recovery (imputation) algo-rithms have been proposed to replace missing blocks. Un-fortunately, little is known about their relative performance, as existing comparisons are limited to either a small subset of relevant algorithms or to very few datasets or often both. Drawing general conclusions in this case remains a challenge. In this paper, we empirically compare twelve recovery gorithms using a novel benchmark. All but two of the al-gorithms were re-implemented in a uniform test environ-ment. The benchmark gathers ten different datasets, which collectively represent a broad range of applications. Our benchmark allows us to fairly evaluate the strengths and weaknesses of each approach, and to recommend the best technique on a use-case basis. It also allows us to identify the limitations of the current body of algorithms and suggest future research directions.
PVLDB Reference Format:
Mourad Khayati, Alberto Lerner, Zakhar Tymchenko, and Philippe Cudré-Mauroux. Mind the Gap: An Experimental Eval-uation of Imputation of Missing Values Techniques in Time Series. PVLDB, 13(5): 768-782, 2020.
DOI: https://doi.org/10.14778/3377369.3377383
1.
INTRODUCTION
With the emergence of the Internet of Things (IoT), time series data has became ubiquitous in a range of domains such as Astronomy [18, 61], Climate [27, 39], Energy [18], Environment [54], Finance [33, 58], Medicine [52], Neuro-science [65, 67], and Traffic [46, 71]. Missing values often occur when sensor time series are recorded. For instance, the Intel-Berkeley Research Lab dataset is missing about 50% of the expected measurements [5]; the University of California Irvine’s repository of time series 20% [12]. Miss-ing values frequently occur consecutively, formMiss-ing a block
This work is licensed under the Creative Commons Attribution-NonCommercial-NoDerivatives 4.0 International License. To view a copy of this license, visit http://creativecommons.org/licenses/by-nc-nd/4.0/. For any use beyond those covered by this license, obtain permission by emailing info@vldb.org. Copyright is held by the owner/author(s). Publication rights licensed to the VLDB Endowment.
Proceedings of the VLDB Endowment,Vol. 13, No. 5 ISSN 2150-8097.
DOI: https://doi.org/10.14778/3377369.3377383
in a time series. These blocks can be large, as it can take arbitrarily long time to fix a faulty sensor.
Data management systems assume no such gaps exist in the data. Even if a system can work with incomplete data (e.g., NULLs in relational databases), leaving missing val-ues untreated can cause incorrect or ill-defined results [8]. Recently, some systems have started to incorporate missing-values recovery as a native feature [1, 8, 42, 55]. We expect other systems to follow, but there is no clear way to pick the most suitable recovery algorithm for at least two reasons.
First, the algorithms use different underlying techniques to achieve a good accuracy. Some algorithms assume that the time series present a temporal continuity, given the nature of the phenomena they measure (e.g., rainfall sen-sors). These algorithms recover missing blocks by looking at an entire set of series as a matrix and by applying tech-niques based on matrix completion principles. Other algo-rithms consider that sensors which are at close proximity can present trend similarity (e.g., body movement sensors). These algorithms apply pattern matching techniques and use the observed values – the values that the sensors actu-ally measured – as a source to replace missing blocks. We lack a guide to understand which technique could yield the best accuracy and in which cases.
The second reason why it is difficult to select an algorithm is that their efficiency is hard to predict. Matrix completion and pattern matching involve different iterative computa-tions. The latter are expensive, which forces each algorithm to find compromises to achieve a reasonable efficiency. For instance, matrix completion algorithms often use a dimen-sionality reduction step, and compensate for the loss of ac-curacy by iterating over the computations until a chosen error metric reaches a threshold. While this process brings efficiency, it creates the need to pick an algorithm’s param-eters properly, e.g., which dimensionality reduction to use. One needs to ponder all these implications before selecting an algorithm and deciding how to properly parameterize it. In this paper, we present an empirical evaluation of miss-ing values recovery techniques. To the best of our knowl-edge, this is the first in-depth study discussing their ac-curacy, efficiency and parameterization. The chosen algo-rithms, summarized in Table 1, cover the full gamut of tech-niques currently available to recover large missing blocks. As these algorithms were implemented using different languages and techniques, we re-implemented them in a common lan-guage (C++) and underlying data manipulation library1. 1Source code and datasets are available online: https://
Table 1: Recovery techniques (described in more detail in Section 3).
Recovery Technique Implementation Initialization Multiple TS Type Matrix D/F Termination Original LoC Speedup
Matrix
comp.
CDRec [27, 28] interpolation batch CD dynamic Java 196 27 GROUSE [2, 72] N/A batch PCA static Python 94 10 ROSL [59] interpolation batch PCA dynamic C++ 330
-SoftImp. [43] zero batch SVD dynamic Python 92 5 SPIRIT [49, 50] N/A online PCA static Matlab 214 110
SVDImp. [64] zero batch SVD dynamic Python 91 9 SVT [7] zero batch SVD dynamic Matlab 158 21 TeNMF [44] zero batch NMF dynamic Python 78 2
TRMF [70] random batch MF static Matlab/C++ -
-P
a
tter
n DynaMMo [34] interpolation batch dynamic Matlab 208 3
STMVL [68] N/A batch static C# 768 2
TKCM [66] N/A online static C 140
-Results. We not only reproduce results from the original papers but also discover a number of new findings. Some of our most salient findings are:
There is no single-best accurate algorithm. Five distinct algorithms stand out. SoftImpute and TRMF are the most accurate algorithms on datasets exhibiting repeating trends, CDRec on time series with high variations in correlation and STMVL on highly correlated time series. Lastly, DynaMMo is adapted to datasets with irregular fluctuations.
Larger missing blocks can sometimes yield higher recov-ery accuracy. This is due to the iterative nature of some algorithms. Large missing blocks require a larger number of iterations which, in turn, yield better recovered values.
Blackouts pose an accuracy challenge. Blackouts refer to episodes where all sensors go quiet simultaneously, causing widespread and aligned missing blocks. None of the tech-niques recovered from a blackout with a high accuracy. Only CDRec and DynaMMo showed (some) acceptable results.
Small dimensionality yields the best results. Techniques relying on dimensionality reduction achieve the best per-formance when they look at a relatively small number of dimensions, i.e., when they apply large reductions.
There is a large runtime variance across solutions. The most efficient algorithms, SVDImpute and CDRec, are three orders of magnitude faster than the slowest, DynaMMo. Contributions. We summarize the contributions of this paper as follows:
• We curate a comprehensive set of large-block recovery algorithms for time series data. We adopt improve-ments to these algorithms that were suggested either in the literature or by practitioners. We also suggest some improvements on our own.
• We create, to the best of our knowledge, the first common test-bed for comparing such algorithms. We achieve this by proposing a reusable code framework, a large selection of representative time series, and mech-anisms to automate benchmarking.
• We evaluate and discuss the accuracy, efficiency, and the proper parameterization of these recovery tech-niques under a large variety of scenarios.
• We provide a detailed guide to navigating the choice of available algorithms. We also discuss scenarios where no acceptable results exist, thus opening the field to future research in this area.
Related Work. Balzano et al. [2] introduce the closest work to ours which compares large missing blocks recovery techniques for time series data. The authors focus exclu-sively on algorithms based on Principal Component Analysis (PCA) and use only synthetic datasets in their experiments. In contrast, our study includes both a more extensive set of recovery techniques and real-world time series covering a wider range of characteristics. We also include a more ex-haustive set of recovery scenarios and we open-source our benchmark.
Another relevant work is by Moritz et al. [48], which offers a comparison of a number of statistical-based methods and one algorithm that uses Kalman Filters [19]. Similarly, Xi-aoping Zhu [74] presents an analysis of four statistical-based techniques: MeanImpute [17], kNNImpute [73], Delete and Multiple Imputation. These techniques are effective only in the case of a single or a handful of missing values.
Some additional comparisons exist in which missing values recovery is used as a step in classification/clustering tasks, e.g., [40, 41, 45]. These works, however, do not discuss the quality of the recovery itself.
The original papers that introduced the recovery tech-niques we evaluate here [7, 28, 34, 43, 44, 49, 59, 64, 66, 68, 70, 72] also include empirical evaluations. Compared to our work, the scope of these experiments is limited in terms of datasets, competitors, and analysis of accuracy, runtime and parametrization.
Similarly to time series data, other types of data provide unique opportunities for recovery techniques. For instance, a number of techniques focus on graph recovery [10, 23, 35, 47, 57], image reconstruction [24, 63], or recovery of categorical data [3, 4], to mention a few. None of these algorithms made it into our study, as they are highly dependent on the specific type of data for which they were originally designed and thus, are not applicable for time series data.
Outline. The rest of this paper is organized as follows. Section 2 provides background information on the families of algorithms we evaluate. Section 3 surveys all algorithms in our test-bed, analyzes their properties, and discusses our implementation choices. Section 4 reports on the experi-mental results. Section 5 discusses our findings and makes suggestions for future work. Section 6 concludes this paper.
2.
BACKGROUND
Missing-values recovery algorithms can be classified as ei-ther matrix-based or pattern-based, according to the under-lying method they use. Matrix-based (completion) recovery
1 3 5 7 9 11 13 15 17 19 21 −4 −2 0 2 4 time (t) X1 X2 X3 MB (a) X1 X2 X3 X Original = U1 U2 U3 × U σ1 σ2 σ3 σ3 = 0 × Σ V T1 = VT V T2 = VT V T3 = VT ˜ X1 ˜X2 ˜X3 e X Approximation SVD(X) (b) MB suggestions Pattern Matches Query Pattern 3 5 5 7 13 15 (c)
Figure 1: Graphical illustration of the recovery of the missing block (MB) in X3. (a) A plot of three input time series X1,
X2 and X3 with a missing block represented by a dashed line at 14 ≤ t ≤ 16. (b) A matrix-based recovery, where SVD
decomposes the original data, exposing the matrix rank with dimensions σ1, σ2 and σ3. (c) A pattern-based recovery, where
the query pattern was matched at 3 ≤ t ≤ 5 and 5 ≤ t ≤ 7.
techniques use data analysis methods to infer the missing block. To illustrate this process, consider a set of m time series, each having n points, where one of these time series has a missing block of values. We show such a scenario in Figure 1a, without loss of generality, for m = 3 and n = 20. These time series can be represented as an n × m matrix where each time series represents a single column, shown as the left-most matrix in Figure 1b.
A matrix-based algorithm transforms the data in a way that simplifies the application of dimensionality reduction. The Singular Value Decomposition (SVD) method [60] is the most widely known technique that has been used to achieve such a goal. SVD decomposes the input matrix X into three matrices U, Σ and V, such that X = U·Σ·VT. The Σ
ma-trix exposes the number of linearly independent dimensions of the data (rank) and presents them sorted by importance, i.e., σ1 > σ2 > σ3. Reducing the original matrix can be
done by nullifying the smallest cells in the diagonal in Σ, σ3 in our example. A recovery process multiplies back the
matrices after the reduction and uses the results to fill the original missing block. The number of dimensions to reduce needs to be parametrized as it heavily impacts the accu-racy/efficiency trade-off.
This recovery process can be iterative, as we depict in Fig-ure 1b. One commonly used objective function is to mini-mize the distance between the input and the approximated matrices as calculated, for instance, using the Frobenius norm [28], the nuclear norm [7], the rank minimization [59], the root mean square error minimization [25, 26], etc. We also discuss matrix-based algorithms that rely on different techniques than SVD, such as Principal Components Anal-ysis [21], Centroid Decomposition [11], Matrix Factoriza-tion [31], and Non-Negative Matrix FactorizaFactoriza-tion [30].
In contrast, pattern-based recovery techniques assume that a high degree of similarity exists between series. When a block is missing in a base series, an algorithm would lever-age the similarity to any number of reference series. The observed values in the reference series are treated as a query pattern. Any blocks matching that pattern may reveal can-didate replacement values in the base series. For instance, in Figure 1c, X3is a base series whereas X1and X2are two
reference ones. The reference series provide two candidate replacing blocks since they match the pattern at the missing interval.
Similarly to matrix-based algorithms, pattern-based tech-niques also require parameterization. The length of the query pattern greatly impacts the accuracy/efficiency trade-off. If the pattern is too small, the technique loses accuracy, especially if the time series are not cyclic. If too big, the computational time involved in pattern manipulation prim-itives (e.g., comparison) becomes too costly.
Notations. In the following, bold upper-case letters re-fer to matrices, regular font upper-case letters rere-fer to vec-tors (rows and columns of matrices) and lower-case let-ters refer to elements of vectors/matrices. The symbol kkF
refers to the Frobenius norm of a matrix, while kk refers to the l-2 norm of a vector. Assume X is an n × m ma-trix where each column is X = [x1, . . . , xn], then kXkF =
q Pn i=1 Pm j=1(xij)2 and kXk = pPn i=1(xi)2.
A time series X = {(t1, v1), . . . , (tn, vn)} is an ordered set
of n temporal values viwhich are ordered according to their
timestamps ti. We write X = [X1|. . . |Xm] (or Xn×m) to
de-note an n×m matrix having m time series Xjas columns and
n values for each time series as rows. Time series can be uni-variate (2-dimensional) or multiuni-variate (multi-dimensional). In univariate series, a temporal value is a scalar that refers to one specific phenomenon, e.g., temperature. In multi-variate series, a value is a vector that refers to multiple phe-nomena, e.g., temperature, precipitation and humidity. We consider time series with fixed granularity and omit their timestamps, which are implicitly expressed by the position (order) of each observation.
To measure the recovery accuracy, we adopt the most commonly used measures in this field: Root Mean Square Error (RMSE) and Mean Absolute Error (MAE) between the original block and the recovered one, i.e.,
RM SE = s 1 |T | X t∈T (xt− ˜xt)2 M AE = P t∈T|xt− ˜xt| |T |
where T is the set of missing values, xtis the original value
and ˜xtis the recovered value. MAE and RMSE can present
different trends. In particular, RMSE is more sensitive to larger errors.
3.
SELECTED ALGORITHMS
Collectively, the algorithms discussed in this study bring a wide range of solutions. The “Recovery” and “Technique” columns in Table 1 characterize each algorithm by its type of initialization, by whether it supports recovery in just one or multiple series at once, by whether the recovery can be done on a streaming series or a batch one, by the underlying method on which it relies and, lastly, by whether the number of iterations to perform is fixed or not. We briefly describe each recovery algorithm below.
3.1
Matrix-Based Algorithms
SVDImpute [64] is a recovery algorithm similar to the one depicted in Figure 1b. It was originally introduced to recover missing genes in DNA micro-arrays where missing blocks are usually small. SVDImpute first initializes the missing values as zeroes. Then, it selects the k most significant columns of V (obtained through SVD) and uses a linear combination of these columns to estimate the missing values. We adopted a common improvement that allows SVDImpute to scale better: we calculate the SVD in a faster and randomized way (resp., [13, 15]). This change yielded the same accuracy up to 3 decimals.
SoftImpute [43] is an extension of the SVDImpute technique with an Expectation Maximization (EM) step. The EM extension improves accuracy, when compared to SVDImpute, and has a low impact on efficiency. The result-ing algorithm alternates between recoverresult-ing the missresult-ing val-ues and updating the SVD using the observed valval-ues. Soft-Impute adopts a soft-thresholded version of SVD – hence the name – and, unlike SVDImpute, uses the product of all three matrices produced by the decomposition.
SVT [7] is an SVD-based algorithm designed with one no-table feature: it automatically finds the optimal rank reduc-tion for a dataset, avoiding the prior calibrareduc-tion step that matrix-based algorithms usually require. It does so by ap-plying a thresholding technique to reduce the number of the singular values obtained from the decomposition. The pre-served singular values are rescaled using only the obpre-served values, and the recovery is obtained by iteratively multiply-ing back the three matrices of the decomposition.
CDRec [28, 29] is a memory-efficient algorithm designed to recover long time series and is based on a technique called Centroid Decomposition (CD) [11]. Similarly to SVD, CD decomposes an n × m input matrix X into an n × m load-ing matrix L and an m × m relevance matrix R, such that X = L · RT
. CDRec performs the recovery by first us-ing interpolation/extrapolation to initialize the missus-ing val-ues. Second, it computes the CD and keeps only the first k columns of L and R, producing Lkand Rk, respectively.
Lastly, it replaces the interpolated values by the correspond-ing elements in eX = Lk· RT. This process iterates until the
normalized Frobenius norm between the matrices before and after the update reaches a small threshold.
GROUSE [2, 72] is an algorithm that does not require ini-tializing the missing values. It uses a decomposition tech-nique we mentioned earlier, PCA [21]. PCA takes an n × m input matrix X and finds n eigenvectors (vectors of U from SVD) each of size m that correspond to the principal com-ponents. In other words, U is a new subspace that approx-imates the dimensions of the initial data. The
approxima-tion is performed by applying a gradient descent procedure to minimize an objective function, and subsequently derive the missing values. We experimented with two different ob-jective functions: one with a distance-based step size and one with a greedy step size. We kept the distance-based implementation as it yielded more stable results.
SPIRIT [49, 50] is an algorithm designed to perform streaming recovery (i.e., the missing block is at the tip of the series). It uses PCA to reduce a set of m co-evolving and correlated streams into a small number of k hidden vari-ables. These variables summarize the most important fea-tures of the original data. For each variable, SPIRIT fits one auto-regressive (AR) model on historical values and in-crementally updates it as new data arrives. Next, the model is used to predict the value of each variable, from which an estimate of the missing value is derived. Lastly, both the es-timated and the non-missing values are used to update the AR coefficients and subsequently recover the missing values. ROSL [59] is a PCA-based algorithm specialized in denois-ing corrupted data. It assumes the input matrix contains corrupted data and suggests better estimates using the ma-trix’s orthonormal subspace. This subspace uses a rank mea-sure to identify the rank representation of the data. We modified the original algorithm to consider only the (initial-ized) missing values as corrupted values.
TRMF [70] is an algorithm that learns from different types of data dependencies, making it suitable to time series ex-hibiting diverse characteristics. It is based on temporal Ma-trix Factorization (MF) [31] which takes an n × m input matrix X and seeks to approximate it using two factor ma-trices, W and H respectively of size n × r and r × m (with r ≤ min(n, m)). This process guarantees that X ≈ WH. The input time series are factorized into a so called latent temporal embeddings and an auto-regressive (AR) model is applied to derive the temporal structure of the embeddings. TeNMF [44] is an algorithm designed to leverage correla-tion across time series. It combines temporal aggregacorrela-tion techniques with a matrix decomposition technique called Non Negative Matrix Factorization (NMF) [30]. NMF is similar to the above MF technique, but it constrains W and H to non-negative elements. More specifically, TeNMF first applies NMF to obtain temporal aggregates and uses them to define a loss function. This function is modified by adding a penalty that captures the correlation across time series. TeNMF’s original implementation uses a multiplica-tive divergence-based update to compute NMF [62], which makes the recovery unstable. We use instead the Alternat-ing Least Squares update (ALS) to compute NMF [37].
3.2
Pattern-Based Algorithms
TKCM [66] is similar to the algorithm depicted in Figure 1c in that it identifies and uses repeating patterns (seasonal-ity) in the time series’ history. In TKCM’s case, the pattern search is performed in a dynamic warping fashion which al-lows for recovering time-shifted time series. Similarly to SPIRIT, TKCM is a streaming technique that operates on the set of values at the tip of the input data.
DynaMMo [34] is an algorithm that considers the similari-ties across only a few time series. It assumes that some time series present co-evolving patterns. Internally, the algorithm
1 2 3 4 5 0 0.2 0.4 0.6 0.8 1 Reduction (k) Normalized v al. RMSE CPU (a) CDRec 1 2 3 4 5 0 0.2 0.4 0.6 0.8 1 Reduction (k) Normalized v al. (b) GROUSE 1 2 3 4 5 0 0.2 0.4 0.6 0.8 1 Reduction (k) Normalized v al. (c) ROSL 1 2 3 4 5 0 0.2 0.4 0.6 0.8 1 Reduction (k) Normalized v al. (d) SoftImpute 1 2 3 4 5 0 0.2 0.4 0.6 0.8 1 Reduction (k) Normalized v al. (e) SPIRIT 1 2 3 4 5 0 0.2 0.4 0.6 0.8 1 Reduction (k) Normalized v al. (f) SVDImpute 0.2 0.4 0.6 0.8 1 0 0.2 0.4 0.6 0.8 1 Scaling of τ Normalized v al. (g) SVT 1 2 3 4 5 0 0.2 0.4 0.6 0.8 1 Reduction (k) Normalized v al. (h) TeNMF 1 2 3 4 5 0 0.2 0.4 0.6 0.8 1 Reduction (k) Normalized v al. (i) TRMF 1 2 3 4 5 0 0.2 0.4 0.6 0.8 1 # Latent var. Normalized v al. (j) DynaMMo 1 2 3 4 5 0 0.2 0.4 0.6 0.8 1 Decay rate (α) Normalized v al. (k) STMVL 4 8 12 16 20 0 0.2 0.4 0.6 0.8 1 Pattern size (l) Normalized v al. (l) TKCM
Figure 2: Parameterization of the techniques on the Chlorine dataset.
relies on Kalman Filters and iterates using an Expectation Maximization (EM) step. The Kalman Filter uses the data that contains missing blocks together with a reference time series to estimate the current state of the missing blocks. The recovery is performed as a multi-step process. At each step, the EM method predicts the value of the current state and then two estimators refine the predicted values of the given state, maximizing a likelihood function.
STMVL [68] is an algorithm designed to recover missing values in correlated time series. It focuses on two types of correlation: a spatial correlation (geographical distance between sensors) and a temporal correlation (closeness of the values in time). Internally, STMVL combines a data smoothing technique with collaborative filtering to derive models out of historical data. These models are then used to estimate the missing values based on the closeness of the sensors, as represented by a decay rate.
3.3
Alternative Techniques
Recovery techniques that rely on Neural Networks (NN) have been also used to recover time series data. For in-stance, some algorithms use recurrent networks [9, 69] or LSTM [32]. These algorithms build a (parametric) model that reconstructs the linear dependence between time se-ries. The recovery is based on the information obtained through those dependencies. This class of techniques uses a calibration process where the dataset is split into two sets: a training set to learn the dependencies and a test set to apply the recovery. The quality of the recovery heavily depends on the size of the training set and the similarity between the two sets. One notable advantage of such algorithms is their ability to deal with multivariate series naturally.
The current limitation with these algorithms has been the assumption that the series in a dataset are linearly depen-dent on one another [69]. Such datasets exist, for instance, in medical data where a given vital sign can accurately pre-dict another. The relationships between the time series we use are, however, more elaborate in practice, as we show in Section 4. The results of our evaluation show that NN-based recovery techniques are not suitable for the data we use here. For instance, MRNN [69] incur a high error (average RMSE higher than 1), while it takes orders of magnitude more time than the slowest algorithm from our benchmark.
3.4
Implementation Notes
As we mentioned earlier, we rewrote all the afore-mentioned algorithms in C++, except for TRMF
(inextri-cable from Matlab) and ROSL (we use the efficient original implementation). The “Implementation” column in Table 1 describes the original language in which each algorithm was written, the number of lines of code (LoC) of our rewrite, and the speed-up benefit this latter brought.
We use the same advanced linear algebra operations across all techniques, thanks to a modern library called Ar-madillo [56]. By using a common code infra-structure, we eliminate any source of disparities that would otherwise ex-ist if each algorithm re-implemented common primitives.
Our rewriting was more involved than simply translat-ing an algorithm from one language into another. We re-engineered the original implementations, which led to gains in performance across all the algorithms – in one case mak-ing an algorithm 110x faster. We discuss some of the insights we learned during this process in more detail in Appendix A. We also validated our versions of the algorithms by repeat-ing core experiments from the original papers. We describe this effort in more detail in Appendix B.
4.
EXPERIMENTAL EVALUATION
In this section, we evaluate the previously selected algo-rithms through a number of experiments designed to test their parameterization, accuracy and efficiency.
4.1
Setup and Datasets
We conduct our experiments on a 3.4 GHz Intel i7-4770 CPU that consists of 8 cores with an 8MB L3 cache and 32GB of RAM. The code was compiled with g++ 7.3.0 at the maximum optimization level. We use eight real-world datasets (cf. Table 2) and two synthetic ones. The real-world datasets we use are the following:
Air brings air quality measurements collected from 36 mon-itoring stations in China from 2014 to 2015 (appeared in STMVL [68]). Air time series contain repeating trends and jumps of magnitude.
Gas shows gas concentration collected between 2007 and 2011 from a gas delivery platform situated at the ChemoSig-nals Laboratory at University of California in San Diego
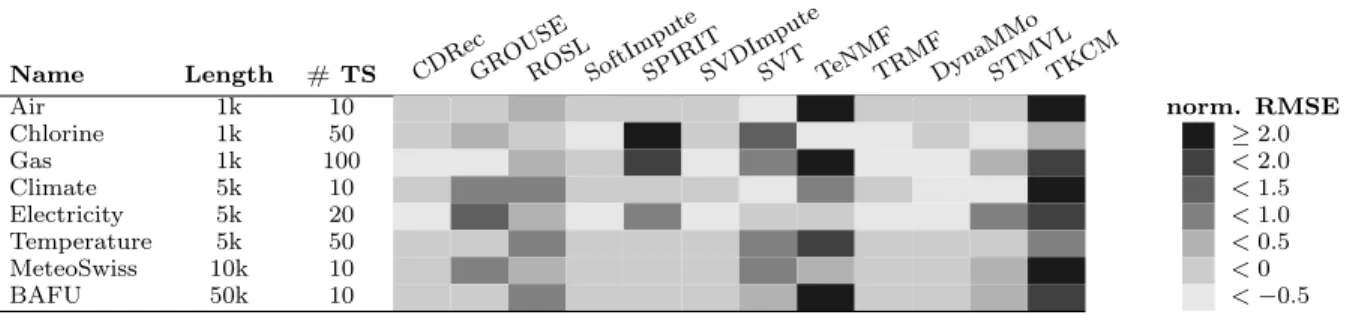
Table 2: Description of time series and accuracy of each technique.
Name Length # TS CDRecGROUS E
ROSLSoftImputeSPIRITSVDImputeSVT TeNMFTRMFDynaMMoSTMVLTKCM
Air 1k 10 norm. RMSE
Chlorine 1k 50 ≥ 2.0 Gas 1k 100 < 2.0 Climate 5k 10 < 1.5 Electricity 5k 20 < 1.0 Temperature 5k 50 < 0.5 MeteoSwiss 10k 10 < 0 BAFU 50k 10 < −0.5
(appeared in [53]). Gas time series exhibit high variations in the correlation between each other.
Climate presents monthly aggregated climate data col-lected from 18 stations over 125 locations in North America between 1990 and 2002 (appeared in [38, 39]). Climate time series are irregular and contain sporadic spikes.
Electricity has data on household energy consumption col-lected every minute between 2006 and 2010 in France (ob-tained from the UCI repository and used by TRMF [70] and TeNMF [44]). Electricity time series are shifted in time. Temperature contains temperature data collected from cli-mate stations in China from 1960 to 20122 (appeared in
STMVL and CDRec [27]). Temperature time series are very highly correlated with each other.
MeteoSwiss is a weather time series provided by the Swiss Federal Office of Meteorology and Climatology3 collected
from different Swiss cities from 1980 to 2018 (appeared in CDRec). Meteo time series contain repeating trends with sporadic anomalies.
BAFU consists of water discharge data provided by the BundesAmt Für Umwelt (BAFU)4, the Swiss Federal Office for the Environment, collected from different Swiss rivers from 1974 to 2015 (appeared in [1]). BAFU time series con-tain synchronized irregular trends.
Chlorine simulates a drinking water distribution system and describes the concentration of chlorine in 166 junctions over a time frame of 15 days with a sample rate of 5 minutes (used by DynaMMo [34], GROUSE [72], SPIRIT [49] and TKCM [66]). This dataset contains clusters of similar time series which exhibit repeating trends.
4.2
Parameterization
Parameterization is the process of calibrating a technique to work with a given accuracy-efficiency trade-off. There are many parameters that can be calibrated for each of our algorithms, but often one of them has a major impact. We present in Figure 2 the experimental results when calibrating the main parameter and discuss the remaining parameters in Appendix C. We report the recovery RMSE and the ex-ecution time, both normalized by the larger value of each algorithm – the lower the better.
The most critical parameter for all the matrix-completion techniques is the dimensionality reduction factor (SVT is a special matrix-completion case, as the threshold parameter, τ , is more critical than the reduction factor). We observe
2
http://www.cma.gov.cn/en2014/
3http://meteoswiss.admin.ch 4
https://www.hydrodaten.admin.ch/en
that the runtime of the matrix-based techniques increases along with the reduction value, k. This result is expected, since the higher k, the higher the number of dimensions used to produce the recovery (yielding more time- and space-intensive computations). Surprisingly, increasing k did not always improve accuracy. The reduction used by these tech-niques keeps only the most significant dimensions and filters out the rest. At some point, the extra information resorts to outlier values that deteriorates the recovery. The optimal reduction value proved to be k ∈ {2, 3, 4}.
For the pattern-based techniques the critical parameters are as follows: for DynaMMo the number of latent vari-ables; for TKCM the pattern size, l; and for STMVL the decay rate, α. The behavior of each algorithm in this group was unique. For DynaMMo, the amount of computations involved grows as more latent variables are used. When op-timizing for accuracy, the optimal number of latent variables proved to be 3. For TKCM, the performance takes a bell shape as l grows. The accuracy decreases with l. Unlike the author’s recommendation, we set the value of l to 4 rather than 72. We found that 4 yields better accuracy in most of our datasets and is an order of magnitude faster. Lastly, we observed that the trend of STMVL is relatively flat. The optimal value of the decay rate is 2.
We also parameterized the algorithms using all the datasets in Table 2. In several cases, we found that small losses in accuracy yielded significant efficiency gains. For instance, we chose k=3 for ROSL with respect to the Cli-mate dataset, even though k=4 yields the lowest RMSE. The biggest accuracy difference between the two parameters is, on average, 0.68 (k=3) vs. 0.75 (k=4), whereas the loss in efficiency is about 1.65x. The performance loss is explained by the need to process the additional dimension.
The results revealed that, when a trade-off between ac-curacy and efficiency was warranted, the parameterization under Chlorine provided a suitable value for all the cases we study in this paper. We did not find any case for which our choice caused an algorithm to perform worse. There-fore, we used the parameters resulting from calibrating the algorithms using Chlorine.
4.3
Accuracy
We now evaluate the accuracy of all the techniques. We set a missing block to appear arbitrarily in the middle of a randomly chosen series in the dataset. We then vary the size of the missing block from 10% to 80% (of the chosen series) and measure the average recovery accuracy using RMSE. We normalize the error across all algorithms using z-score (the lower the better) and present the results in Table 2.
10 20 30 40 50 60 70 80 0.3 0.35 0.4 0.45 0.5 missing rate (%) RMSE
CDRec DynaMMo STMVL SoftImp. SVDImp. TRMF
(a) Air dataset
10 20 30 40 50 60 70 80 0.15 0.2 0.25 0.3 0.35 missing rate (%) RMSE (b) Chlorine dataset 10 20 30 40 50 60 70 80 0.1 0.2 0.3 0.4 missing rate (%) RMSE (c) Gas dataset. STMVL is off the scale.
10 20 30 40 50 60 70 80 0.7 0.8 0.9 missing rate (%) RMSE (d) Climate dataset 10 20 30 40 50 60 70 80 0.45 0.5 0.55 0.6 missing rate (%) RMSE
(e) Electricity dataset. STMVL is off the scale.
10 20 30 40 50 60 70 80 0.19 0.2 0.21 0.22 missing rate (%) RMSE (f) Temperature dataset. 10 20 30 40 50 60 70 80 0.22 0.24 0.26 0.28 0.3 0.32 missing rate (%) RMSE (g) Meteo dataset. 10 20 30 40 50 60 70 80 0.2 0.3 0.4 0.5 0.6 missing rate (%) RMSE (h) BAFU dataset.
Figure 3: Accuracy comparison with increasing missing block size.
As Table 2 shows, TeNMF and TKCM have a low re-covery accuracy on most of the datasets, while GROUSE performs similarly poorly on half of them. We also observe that, on large datasets (with either long or many time se-ries), SPIRIT, SVT and ROSL fail to achieve a good recov-ery. Hence, we focus in the rest of the experiments on the most accurate algorithms: CDRec, DynaMMo, SoftImpute, SVDImpute, STMVL and TRMF.
4.3.1
Impact of Missing Block Size
In this set of experiments, we evaluate the recovery ac-curacy when increasing the percentage of missing values in one time series. Here we also present the accuracy results using RMSE, but we do not normalize it across datasets this time. This reveals the accuracy levels, for different missing percentage rates, that the algorithms can achieve on each dataset. Figure 3 shows the results.
We observe two different trends. First, in some datasets a set of algorithms perform equivalently well. In the Air, Me-teo, and BAFU datasets (cf. Figures 3a, 3g, 3h, resp.), all of CDRec, DynaMMo, SoftImpute, and TRMF present some-what indistinguishably low RMSE. These datasets contain similar features (weather-related time series), which pose no significant challenge.
The second trend shows datasets that make single algo-rithms stand out. We found that each of these datasets presents a peculiar feature. The Chlorine dataset (cf. Fig-ure 3b) has repeating trends, to which TRMF and Soft-Impute respond particularly well. The AR and EM models used respectively by the two techniques can capture the reg-ularity inside the data, accurately detecting the trend repe-tition. The Gas dataset (cf. Figure 3c) presents mixed cor-relation, positive/negative and high/low, which CDRec can capture thanks to its use of a weight vector. The Climate (cf. Figure 3d) and the Electricity datasets (cf. Figure 3e) both present irregularities – fluctuations and shifted time se-ries, respectively – which DynaMMo and SoftImpute handle well because of their attention to co-evolution of time series. The temperature dataset (cf. Figure 3f) stands out by its
very high correlation. This is why STMVL, which captures such models by design, performs so well.
1000 5000 10000 0 0.2 0.4 0.6 0.8 Length of TS (n) RMSE CDRec DynaMMo STMVL SoftImp. SVDImp. TRMF
(a) Avg. RMSE with varying length of TS. 1000 5000 10000 0 0.2 0.4 0.6 0.8 Length of TS (n) MAE
(b) Avg. MAE with varying length of TS. 10 20 50 0 0.2 0.4 0.6 0.8 # of TS (m) RMSE
(c) Avg. RMSE with varying # of TS. 10 20 50 0 0.2 0.4 0.6 0.8 # of TS (m) MAE
(d) Avg. MAE with varying # of TS.
Figure 4: Accuracy comparison with increasing time series length and number.
We conclude from this experiment that the absolute best accuracy can only be currently achieved by specialization, the careful pairing of data features with the algorithm de-sign. We also note that specialization may sacrifice stability. For instance, STMVL does well on Temperature datasets but its accuracy is particularly poor in large datasets that contain either a high number of time series, such as Gas (m = 100), or long time series, such as BAFU (n = 50k), see Figure 3c and 3h, respectively.
X1X2X3 (a) Disjoint X1X2X3 (b) Overlap X1X2X3 (c) MCAR X1X2X3 (d) Blackout Figure 5: Different scenarios of multiple incomplete series. The missing blocks are represented by a dashed box.
We also observe in this experiment that the error does not always increase along with the size of the missing block. In three datasets, Chlorine (cf. Figure 3b), Gas (cf. Figure 3c) and Meteo (cf. Figure 3g), the trend is the opposite. As we stated earlier, the larger a missing block, the more iterations the algorithms can use to calculate the recovery. More iter-ations means further opportunities to refine the values with which the missing block was initialized.
4.3.2
Impact of Sequence Length and Number
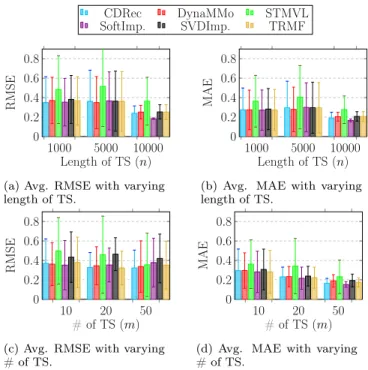
Figure 4 depicts the recovery accuracy on different datasets when increasing either the length of the sequences in a dataset or their number. We set the size of the missing block to 10% of one sequence within a dataset. When the sequence length varies, the number of time series is set to 10. When the number of series varies, the sequence length is set to 1k values. We use the average RMSE and MAE values across different datasets, with standard deviation as the confidence intervals. Both metrics appear here as each provides a unique insight.
This experiment shows that, in general, the algorithms take advantage of having longer time series to produce bet-ter accuracy (cf. Figures 4a and 4b). The improvement is more noticeable when we vary the length from 5k to 10k. This is expected, because using more data should help bet-ter capturing the main features of the time series.
This experiment also shows that the RMSE accuracy of the algorithms remains largely unaffected when we vary the number of time series (cf. Figures 4c). This was unexpected, as using more time series from the same dataset should help the dimensionality reduction computation (for matrix com-pletion), the spatio-temporal model (for STMVL) and the Kalman Filter (for DynaMMo). The MAE results (cf. Fig-ure 4d), however, show the expected trend. The reason be-hind the discrepancy between the two metrics is that some outlier values are introduced by the addition of the new time series. Unlike RMSE, MAE reflects the average recovery by giving less weight to the outliers.
4.3.3
Impact of Number of Affected Series
In the previous experiments, we assumed that a missing block occurs in one series in a dataset. There exists, how-ever, a number of distinct scenarios when several series have missing blocks. We depict in Figure 5 four different scenar-ios depending on the position of the the missing blocks. We compare the algorithms’ recovery RMSE for each of those scenarios and we guarantee that all series are affected.
Figure 6 shows the recovery accuracy when the incomplete time series have disjoint missing blocks. We keep the length
0 2 4 6 8 10 0.2 0.4 0.6 0.8 # incomp. TS RMSE CDRec DynaMMo STMVL SoftImp. SVDImp. TRMF
(a) BAFU dataset (m=10). 0 10 20 30 40 50 0 0.1 # incomp. TS RMSE (b) Chlorine dataset (m=50). 0 20 40 60 80 100 0.2 0.3 0.4 # incomp. TS RMSE (c) Gas dataset (m=100). STMVL is off the scale.
Figure 6: Accuracy comparison with increasing number of incomplete TS (disjoint case).
0 2 4 6 8 10 0.2 0.4 0.6 # incomp. TS RMSE CDRec DynaMMo STMVL SoftImp. SVDImp. TRMF
(a) BAFU dataset.
0 10 20 30 40 50 0 0.1 0.2 # incomp. TS RMSE (b) Chlorine dataset. 0 20 40 60 80 100 0.2 0.3 0.4 # incomp. TS RMSE (c) Gas dataset. STMVL is off the scale.
Figure 7: Accuracy comparison with increasing number of incomplete TS (overlapping case).
0 2 4 6 8 10 0.2 0.3 0.4 0.5 # of incomp. TS RMSE CDRec DynaMMo STMVL SoftImp. SVDImp. TRMF
(a) BAFU dataset.
0 20 40 60 80 100 0.2 0.25 0.3 0.35 # incomp. TS RMSE (b) Gas dataset. STMVL is off the scale.
Figure 8: Accuracy comparison in the case of MCAR.
0 20 40 60 80 100 0.2 0.4 0.6 0.8 1 size of MB RMSE CDRec DynaMMo STMVL SoftImp. SVDImp. TRMF
(a) Gas dataset.
0 20 40 60 80 100 0 0.2 0.4 0.6 0.8 1 size of MB RMSE (b) BAFU dataset.
Figure 9: Accuracy comparison in case of blackout. STMVL and TRMF are off the scale. SVDImpute and SoftImpute achieve the same recovery accuracy.
and number of time series to their maximum per dataset and we vary the number of affected time series (one missing block per time series).
2 3 4 5 6 7 8 9 10 101 102 103 104 Sequence Length[×100] run time (ms)
CDRec DynaMMo STMVL SoftImp. SVDImp. TRMF
(a) Gas dataset (n = 1k)
1 2 3 4 5 101 102 103 104 105 Sequence Length[k] run time (ms) (b) Electr. dataset (n = 5k) 2 3 4 5 6 7 8 9 10 101 102 103 104 105 Sequence Length[k] run time (ms) (c) Meteo dataset (n = 10k) 1 2 3 4 5 102 103 104 105 106 Sequence Length[10k] run time (ms) (d) BAFU dataset (n = 50k)
Figure 10: Efficiency with increasing sequence length.
4 5 6 7 8 9 10 102 103 104 105 106 TS number run time (ms)
(a) BAFU dataset (m = 10)
4 6 8 10 12 14 16 18 20 101 102 103 104 105 TS number run time (ms) (b) Electr. dataset (m = 20) 10 20 30 40 50 100 101 102 103 104 TS number run time (ms) (c) Chlor. dataset (m = 50) 20 40 60 80 100 101 102 103 104 TS number run time (ms) (d) Gas dataset (m = 100)
Figure 11: Efficiency with increasing sequence number.
We observe two trends in the results. First, for the datasets with a small or a high number of time series (cf. Figure 6a and 6c, resp.) the error produced by all tech-niques, except STMVL, first increases with the number of affected series, then decreases. The increase in RMSE oc-curs as expected, since adding more incomplete time series increases the number of missing values. However, the de-crease is unexpected and is explained, as mentioned earlier, by the fact that having more incomplete time series avoids early termination, thus improving the recovery. The second trend appears for datasets with a medium number of time series (cf. Figure 6b), where we observe a decrease in the RMSE caused by the same reason. Interestingly, there is not much differentiation among algorithms, again, except for STMVL. The accuracy of the latter is barely affected, as its spatio-temporal model produces a similar recovery for all incomplete time series.
Figure 7 shows the recovery accuracy for multiple incom-plete time series with overlapping missing blocks. Each miss-ing block partially intersects with the two others; half in a series following the current one and half in a prior series. The results show that, similarly to the disjoint case, the impor-tant factor differentiating the algorithms in this experiment is the number of time series per dataset.
We also evaluate the recovery accuracy when blocks are missing completely at random (MCAR). We vary the num-ber of incomplete time series where each of them contains more than one missing block (of size 10). The results are depicted in Figure 8.
We observe different outcomes depending on the size of the dataset. For long time series such as BAFU (cf. Figure 8a), DynaMMo achieves the best recovery. The reason is that longer series provide better opportunities for this technique to learn local similarities and accurately recover multiple missing blocks per time series. For datasets with many time series such as Gas (cf. Figure 8b), CDRec stands out. It leverages the correlations across multiple time series such that the impact of a missing block in one series is attenuated by the observed values in others.
Lastly, we evaluate the techniques in the case of a black-out, i.e., when all time series lose data at the same time. In
Figure 9, we set the number of affected time series to the maximum per dataset and we compare the recovery RMSE when varying the size of the missing block. We observe that, with very few exceptions, all algorithms incur a very high RMSE. CDRec and DynaMMo achieve low errors with small blackouts. This is due to the care with which they initialize the missing block. We conclude from this experiment that blackouts represent a feature that requires new and more advanced recovery algorithms.
4.4
Efficiency
We now evaluate the efficiency of the recovery techniques. To do so, we measure the elapsed runtime (wall clock) under different conditions. We present time on a log scale since the results vary widely among algorithms, by as much as three orders of magnitude.
4.4.1
Impact of Sequence Length and Number
In Figure 10 we incrementally increase each dataset’s se-quences length, using all the series from that dataset. The size of the missing block is kept constant at 10% of the max-imum length of one series.
We observe that the algorithms runtimes clearly fall within two ranges: fast and slow. The faster algorithms are all matrix-based, i.e., CDRec, SoftImpute and SVDIm-pute. They operate on a few dimensions regardless of the number of input time series, thanks to the dimensionality reduction these algorithms use.
The remaining algorithms are slower because they rely on expensive models. For instance, DynaMMo learns the co-evolution by computing Kalman Filters while TRMF re-sorts to an autoregressive model, even if it is a matrix-based technique.
In the experiments in Figure 11 we gradually increase the number of series in a dataset, while keeping their length fixed. We observe the same trends as in Figure 10. CDRec stood slightly apart among the faster peers when using a few series. Its efficiency is due to the fast incremental computa-tion of the centroid values. The runtime difference becomes, however, indistinguishable as the number of series increases.
10 20 30 40 50 60 70 80 104 105 106 107 missing rate (%) run time (ms) CDRec DynaMMo STMVL SoftImp. SVDImp. TRMF
(a) Gas dataset
10 20 30 40 50 60 70 80 105 106 107 108 109 missing rate (%) run time (ms) (b) BAFU dataset
Figure 12: Efficiency comparison with increasing block size.
2 3 4 5 6 7 8 9 10 0 20 40 Sequence Length[100k] run time (sec)
CDRec GROUSE SoftImp. SPIRIT SVDImp
(a) Runtime with sequence length variation. 1 2 3 4 54 5 6 7 8 9 10 0 10 20 30 Sequence Number[×100] run time (sec)
(b) Runtime with sequence number variation.
Figure 13: Efficiency on Synthetic Datasets.
4.4.2
Impact of Missing Block Size
In the experiments in Figure 12, we compare the efficiency of the algorithms when increasing the size of the missing block. We keep the dataset length and size to their respec-tive maximum per dataset. We choose the Gas and the BAFU datasets for the same reason as above, the size.
The results show the same trends we observed in Fig-ures 10 and 11: when we consider an algorithm’s efficiency, there is a fast peer group and a slow one. In this case, the runtime of the faster algorithms increases with the percent-age of missing values while it remains almost constant for the slower ones. This is because the computation of the models used by the pattern-bases techniques depends only on the size of the input matrix. Thus, the efficiency of these techniques is independent from the size of the missing block.
4.4.3
Large Synthetic Data
In Figure 13, we evaluate the efficiency of the fastest tech-niques on datasets with thousands of sensors with millions of observations each. We use synthetic time series, as the real-world time series we have chosen are limited in the length and in the number of time series. We focus on algorithms able to perform the recovery in less than 1 minute.
We generate synthetic time series through a random walk where the steps are given by a triangular distribution. We first generate two matrices L and R. L follows a Gaussian distribution N (0, 0.7) while R follows a triangular distribu-tion with a step size of 0.7. Then, we multiply the two ma-trices and update the resulting matrix by adding noise with a Gaussian distribution N (0, 0.2) and exponential smooth-ing. This generation guarantees that the values have hard boundaries and that the time series do not have a dominant feature, which would favor the runtime of one technique over the others. We generate two datasets: the first has n = 1M and m = 100, and the second one with n = 10k and m = 1k. We set the size of the missing block to 10% of the maximum length of one time series.
The results show that SPIRIT outperforms the rest of the algorithms when varying the sequence length (cf. Fig-ure 13a). SPIRIT is efficient because it learns the AR coef-ficients and applies them only to a small window of the time series. However, its performance deteriorates as the number of time series grows (cf. Figure 13b). SPIRIT needs to or-thogonalize the principal components, as it is PCA-based, using the Gram Schmidt process [16]. This orthogonaliza-tion process is unstable in case of a very large number of time series [14].
5.
RECOMMENDATIONS
5.1
Recommended Techniques
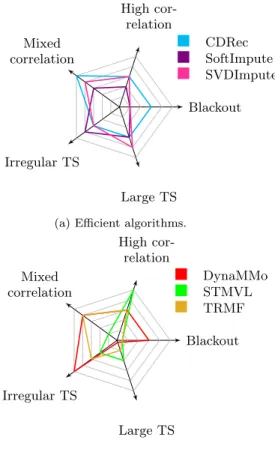
In this section, we propose a systematic method to com-pare and select missing blocks recovery algorithms. We mea-sure the recovery accuracy of each algorithm in the pres-ence of a given data feature, e.g., correlation variations in a dataset. We grade the recovery accuracy using a 0-5 scale, from low to high accuracy, reflecting the evaluation we per-formed in Section 4. We present the results using the Kiviat diagram shown in Figure 14.
We select the most distinctive features that appear in the datasets we use:
• high-degree of correlation among series, such as those in temperature data (series varying closely together); • mixed correlation, such as those in greenhouse gas
data (many high/low, negative/positive correlations appearing at once);
• irregularities, such as those in household power con-sumption or water discharge data (fluctuations, spikes, outliers, etc);
• blackouts;
• size of the dataset, either in length or number of series. These features are representative of many aspects natu-rally present in real-world time series.
The Kiviat allows us to draw two main conclusions. First, certain algorithms are clearly best-in-class. STMVL stands out on highly-correlated time series; CDRec, on time series with mixed correlation; DynaMMo on irregular time series. In the special case where the time series contain similar re-peating trends, TRMF and SoftImpute are the best options. The second conclusion is that none of the algorithms deliv-ers acceptable accuracy in the presence of severe blackouts. Large blocks of missing values cause the algorithms to ter-minate their iterations too early, returning almost the same recovery block as the one at initialization. CDRec and Dy-naMMo manage to perform a few iterations and can produce relatively acceptable results.
5.2
Research Opportunities
In the following, we describe a number of research efforts that could increase the number of dimensions with accu-rate algorithms and/or allow choosing an algorithm without knowing the data series properties upfront.
Blackout High cor-relation Mixed correlation Irregular TS Large TS CDRec SoftImpute SVDImpute
(a) Efficient algorithms.
Blackout High cor-relation Mixed correlation Irregular TS Large TS DynaMMo STMVL TRMF
(b) Time consuming algorithms.
Figure 14: Representation of the strengths and weaknesses of selected algorithms. We divide the algorithms into two groups and grade the ability of each algorithm to handle a particular feature present in a dataset. Grades appear as concentric polygons and vary from 0 to 5, depending on the accuracy the algorithm delivers. A color polygon represents an algorithm and is formed by connecting its grades. The al-gorithms can be compared by looking at how their polygons’ reach differ.
Time-Series Characteristics Discovery. Existing tools are only able to extract very basic properties from time-series, such as number of peaks, entropy, energy, etc.5 To the
best of our knowledge, there is no technique that could effec-tively probe all the features we discuss here. If such a tool existed, it would open the possibility for a meta-algorithm to test a dataset’s properties and to dynamically select the best recovery process. This tool needs to run at a fraction of the time an actual algorithm would, lest its runtime be equivalent to that of the recovery algorithms.
Missing-block Initialization. Blackouts cause an ini-tialization problem for matrix-based algorithms. Filling the missing blocks through linear interpolation or zero-initialization is common but it potentially changes the real rank of the matrix, affecting the convergence of these algo-rithms. An alternative approach would be to “mask-away” the missing values by sampling from the observed values. Sampling techniques that guarantee convergence such as Stochastic Gradient Descent [51] could be used in this con-text.
5
https://tsfresh.readthedocs.io/
Automatic Parameterization. Another interesting dis-covery feature is the rank auto-detection used by SVT. It makes the choice of the parameters be a part of the algo-rithm rather than a prior off-line step. Auto-detection is, however, in no small part responsible for SVT’s low effi-ciency.
Hardware Acceleration. The algorithms we study in this paper are not scalable enough to handle very large time se-ries. Such time series appear in applications where sensors with very high frequency are used, generating billions or even trillions of events per series. The SENTINEL-2 mission conducted by the European Space Agency (ESA) is such an example [36]. There have been successful GPU-based imple-mentations of matrix operations that could speed up some of the algorithms we evaluate here [6]. There is also an ex-isting and expanding ecosystem of specialized hardware to support Neural Network algorithms [20, 22] such as the ones we presented in Section 3.3. To the best of our knowledge, there has not been any successful attempt to leverage ei-ther kind of hardware to accelerate missing block recovery algorithms.
6.
CONCLUSION
In this paper, we empirically investigated the relative strengths and weaknesses of twelve algorithms for the recov-ery of large missing blocks in time series. We re-implemented all but two of the algorithms and subjected them to a large mix of real-world and synthetic data. We were not only ca-pable of reproducing the results originally published, but we also exposed behavior previously unknown.
Our results show that no single algorithm delivers high accuracy in all cases. We have substantiated this result and other findings and provided a systematic method to navi-gate the choices of algorithms. We have also discussed re-search problems that remain unsolved, in particular related to achieving more adaptable and scalable algorithms. We intend to continue this line of work by looking at techniques that would allow algorithms to handle substantially larger amounts of data.
ACKNOWLEDGMENTS
We would like to thank Dennis Shasha for his invaluable feedback on this paper. We would also like to give special thanks to the anonymous reviewers for their insightful com-ments and suggestions.
The first and third authors received funding from the Eu-ropean Union’s Horizon 2020 research and innovation pro-gramme under grant agreement No 732328 (FashionBrain). The second and fourth authors received funding from the European Research Council (ERC) under the European Union Horizon 2020 Research and Innovation Programme (grant agreement 683253/Graphint).
APPENDIX
A. High-Impact Optimization Techniques
As we re-implemented a large number of algorithms, we noticed that some improvements applied to several of them. These improvements fostered a significant gain in runtime, as described below.20 40 60 80 100 0 1 2 λ MSE [10 2]
DynaMMo SVDImp. Interpolation
(a) Original plot [34].
20 40 60 80 100 0 1 2 λ MSE [10 2] (b) Our result.
Figure 15: Reproducing results of DynaMMo [34].
50 60 70 80 2 3 4 5 6 missing rate (%) NRMSE TRMF MeanImp.
(a) Original plot [70].
50 60 70 80 2 3 4 missing rate (%) NRMSE (b) Our result.
Figure 16: Reproducing results of TRMF [70].
Improved memory management. In certain algo-rithms such as DynaMMo, SPIRIT and SVT, the origi-nal implementation fully materialized a number of interme-diate results/matrices before the main matrix decomposi-tion/factorization was done. We avoided such a full mate-rialization by adopting an on-demand approach to comput-ing intermediate results, where we would produce the cells of those matrices as needed. Besides the space savings, this also brought better use of CPU caches, as the data in hot loops could be placed close together in memory.
Support for sparse matrices. Sparse matrices can ben-efit from a hybrid representation that switches between dif-ferent storage formats depending on the executed opera-tion [56]. Such a representaopera-tion does not only take less space but also improves speed as the initialized zero values do not need to be processed. Support for sparse matrices had a significant impact because such matrices appear in the re-duction step of every single matrix decomposition technique. As such, all the algorithms in this class benefited.
Efficient computation of algebraic operations. Some algorithms such as SPIRIT, DynaMMo, and TRMF per-form very specific algebraic operations that are not read-ily available in many linear algebra libraries. In the origi-nal algorithms, Matlab provides high-level abstractions with which these operations could be easily expressed. In the case of DynaMMo and SPIRIT, though, we ported the Mat-lab operations to work with the (efficient) data structures and primitives provided by Armadillo. For example, we can vastly speed up algorithms that solve linear equations by parallelizing their underlying matrix operations (e.g., mul-tiplication, transposition, and QR decomposition).
B. Reproducibility of Original Results
We repeated the experiments of all the original papers we included in our study. We have reproduced their results but
for two cases: Li et al. [34] (DynaMMo) and Yu et al. [70] (TRMF). We provide details on each work below.
DynaMMo. Li et al. [34] introduced DynaMMo and com-pared it against SVDImpute [64] and linear interpolation. We repeat two core experiments on the Mocap and Chlo-rine datasets, which evaluate the accuracy and runtime of DynaMMo by varying the average missing rate (λ) and the sequence length, respectively. Figure 15a shows the accu-racy results from the original paper while our results are shown in 15b.
We found that the difference between DynaMMo and the two competitors is smaller compared to what is reported in the paper. This is because we apply the interpolation within each time series containing missing values while the authors apply it across different time series. We also applied the interpolation as used by the authors, achieving the exact same results. The results show also that we obtain a slight improvement in the error as, unlike the original paper, we compute the average error over 5 runs.
TRMF. Yu et al. [70] introduced TRMF. We repeat an experiment on the electricity dataset, which evaluates the accuracy of TRMF by varying the missing rate and compares it against Matrix Factorization (MF) and mean imputation. We do not report the results of MF as the authors did not specify the version of MF they used. Figure 16a shows the results from the original paper, while our results are shown in Figure 16b.
Our results confirm the good performance of TRMF. Un-like in the original plot, the results of the mean imputation are lower. This is because we apply the mean separately over each time series while the authors apply it over the en-tire matrix. The results also show a small difference in the results of TRMF for the missing rate of 80%. This is likely due to the randomized process used to delete the block to recover.
C. Complete Parameterization of Selected
Al-gorithms
Most of the techniques we benchmarked use additional parameters to those reported in Section 4.2. We use the same parameterization procedure to find the optimal value for each of these parameters. Our results show that the values recommended by the authors yield the best results. We describe in Table 3 these parameters and their optimal values.
Table 3: Description of additional parameters.
Technique Additional Parameters CDRec tol (tolerance)= 10−6 ROSL max_iter= 500; tol= 10−6 SoftImp. max_iter= 100; tol= 10−5 SPIRIT w (AR order)= 6; α (exp. forgetting)= 1 SVDImp. max_iter= 100; tol= 10−5 SVT max_iter= 100; tol= 10−4 TeNMF max_iter= 100; tol= 10−6 TRMF λ (learning rate)= [0.75,0.75,0.75];
L (lag index)= [1, . . . , 10] DynaMMo max_iter= 100
STMVL ω (window size) =7; β (smoothing) =0.85 TKCM k (# anchor points) =5; d (# ref TS) =3
REFERENCES
[1] I. Arous, M. Khayati, P. Cudré-Mauroux, Y. Zhang, M. L. Kersten, and S. Stalinlov. Recovdb: Accurate and efficient missing blocks recovery for large time series. In 35th IEEE International Conference on Data Engineering, ICDE 2019, Macao, China, April 8-11, 2019, pages 1976–1979, 2019.
[2] L. Balzano, Y. Chi, and Y. M. Lu. Streaming PCA and subspace tracking: The missing data case. Proceedings of the IEEE, 106(8):1293–1310, 2018. [3] D. Bertsimas, C. Pawlowski, and Y. D. Zhuo. From
predictive methods to missing data imputation: An optimization approach. Journal of Machine Learning Research, 18:196:1–196:39, 2017.
[4] F. Biessmann, D. Salinas, S. Schelter, P. Schmidt, and D. Lange. "deep" learning for missing value
imputationin tables with non-numerical data. In Proceedings of the 27th ACM International Conference on Information and Knowledge Management, CIKM ’18, pages 2017–2025, New York, NY, USA, 2018. ACM.
[5] P. Bodik, W. Hong, C. Guestrin, S. Madden, M. Paskin, and R. Thibaux. Intel berkeley research lab dataset, homepage:
http://db.csail.mit.edu/labdata/labdata.html, 2004.
[6] W. Boukaram, G. Turkiyyah, and D. Keyes.
Hierarchical matrix operations on gpus: Matrix-vector multiplication and compression. ACM Trans. Math. Softw., 45(1):3:1–3:28, Feb. 2019.
[7] J. Cai, E. J. Candès, and Z. Shen. A singular value thresholding algorithm for matrix completion. SIAM Journal on Optimization, 20(4):1956–1982, 2010. [8] J. Cambronero, J. K. Feser, M. J. Smith, and
S. Madden. Query optimization for dynamic imputation. PVLDB, 10(11):1310–1321, 2017. [9] W. Cao, D. Wang, J. Li, H. Zhou, L. Li, and Y. Li.
BRITS: bidirectional recurrent imputation for time series. In Advances in Neural Information Processing Systems 31: Annual Conference on Neural
Information Processing Systems 2018, NeurIPS 2018, 3-8 December 2018, Montréal, Canada., pages 6776–6786, 2018.
[10] S. Chouvardas, M. A. Abdullah, L. Claude, and M. Draief. Robust online matrix completion on graphs. In 2017 IEEE International Conference on Acoustics, Speech and Signal Processing, ICASSP 2017, New Orleans, LA, USA, March 5-9, 2017, pages 4019–4023, 2017.
[11] M. T. Chu and R. Funderlic. The centroid decomposition: Relationships between discrete variational decompositions and svds. SIAM J. Matrix Analysis Applications, 23(4):1025–1044, 2002. [12] D. Dheeru and E. Karra Taniskidou. UCI machine
learning repository, 2017.
[13] X. Feng, W. Yu, and Y. Li. Faster matrix completion using randomized SVD. In IEEE 30th International Conference on Tools with Artificial Intelligence, ICTAI 2018, 5-7 November 2018, Volos, Greece., pages 608–615, 2018.
[14] L. Giraud, J. Langou, and M. Rozloznik. The loss of orthogonality in the gram-schmidt orthogonalization
process. Comput. Math. Appl., 50(7):1069–1075, Oct. 2005.
[15] N. Halko, P. Martinsson, and J. A. Tropp. Finding structure with randomness: Probabilistic algorithms for constructing approximate matrix decompositions. SIAM Review, 53(2):217–288, 2011.
[16] S. Han, W. K. Ng, and P. S. Yu. Privacy-preserving singular value decomposition. In Proceedings of the 25th International Conference on Data Engineering, ICDE 2009, March 29 2009 - April 2 2009, Shanghai, China, pages 1267–1270, 2009.
[17] D. Hening and D. A. Koonce. Missing data imputation method comparison in ohio university student retention database. In Proceedings of the 2014 International Conference on Industrial Engineering and Operations Management, Bali, Indonesia, January 7 – 9, 2014, 2014.
[18] P. Huijse, P. A. Estévez, P. Protopapas, J. C. Príncipe, and P. Zegers. Computational intelligence challenges and applications on large-scale astronomical time series databases. IEEE Comp. Int. Mag.,
9(3):27–39, 2014.
[19] A. Jain, E. Y. Chang, and Y.-F. Wang. Adaptive stream resource management using kalman filters. In Proceedings of the 2004 ACM SIGMOD International Conference on Management of Data, SIGMOD ’04, pages 11–22, New York, NY, USA, 2004. ACM. [20] Jian Ouyang, Shiding Lin, Wei Qi, Yong Wang, Bo
Yu, and Song Jiang. Sda: Software-defined accelerator for large-scale dnn systems. In 2014 IEEE Hot Chips 26 Symposium (HCS), pages 1–23, Aug 2014. [21] I. Jolliffe. Principal component analysis. Springer
Verlag, New York, 2002.
[22] N. P. Jouppi et al. In-datacenter performance analysis of a tensor processing unit. In 2017 ACM/IEEE 44th Annual International Symposium on Computer Architecture (ISCA), pages 1–12, June 2017. [23] V. Kalofolias, X. Bresson, M. M. Bronstein, and
P. Vandergheynst. Matrix completion on graphs. CoRR, abs/1408.1717, 2014.
[24] R. Kennedy, L. Balzano, S. J. Wright, and C. J. Taylor. Online algorithms for factorization-based structure from motion. Computer Vision and Image Understanding, 150:139–152, 2016.
[25] R. H. Keshavan, A. Montanari, and S. Oh. Matrix completion from a few entries. IEEE Trans. Information Theory, 56(6):2980–2998, 2010. [26] R. H. Keshavan, A. Montanari, and S. Oh. Matrix
completion from noisy entries. Journal of Machine Learning Research, 11:2057–2078, 2010.
[27] M. Khayati, M. H. Böhlen, and P. Cudré-Mauroux. Using lowly correlated time series to recover missing values in time series: A comparison between SVD and CD. In Advances in Spatial and Temporal Databases -14th International Symposium, SSTD 2015, Hong Kong, China, August 26-28, 2015. Proceedings, pages 237–254, 2015.
[28] M. Khayati, M. H. Böhlen, and J. Gamper.
Memory-efficient centroid decomposition for long time series. In IEEE 30th International Conference on Data Engineering, Chicago, ICDE 2014, IL, USA, March 31 - April 4, pages 100–111, 2014.
[29] M. Khayati, P. Cudré-Mauroux, and M. H. Böhlen. Scalable recovery of missing blocks in time series with high and low cross-correlations. Knowledge and Information Systems, 2019.
[30] H. Kim, J. Choo, J. Kim, C. K. Reddy, and H. Park. Simultaneous discovery of common and discriminative topics via joint nonnegative matrix factorization. In Proceedings of the 21th ACM SIGKDD International Conference on Knowledge Discovery and Data Mining, Sydney, NSW, Australia, August 10-13, 2015, pages 567–576, 2015.
[31] Y. Koren, R. Bell, and C. Volinsky. Matrix factorization techniques for recommender systems. Computer, 42(8):30–37, Aug. 2009.
[32] M. Lee, J. An, and Y. Lee. Missing-value imputation of continuous missing based on deep imputation network using correlations among multiple iot data streams in a smart space. IEICE Transactions, 102-D(2):289–298, 2019.
[33] A. Lerner, D. E. Shasha, Z. Wang, X. Zhao, and Y. Zhu. Fast algorithms for time series with applications to finance, physics, music, biology, and other suspects. In Proceedings of the ACM SIGMOD International Conference on Management of Data, Paris, France, June 13-18, 2004, pages 965–968, 2004. [34] L. Li, J. McCann, N. S. Pollard, and C. Faloutsos.
Dynammo: mining and summarization of coevolving sequences with missing values. In Proceedings of the 15th ACM SIGKDD International Conference on Knowledge Discovery and Data Mining, Paris, France, June 28 - July 1, 2009, pages 507–516, 2009.
[35] Y. Li, T. Yang, J. Zhou, and J. Ye. Multi-task learning based survival analysis for predicting alzheimer’s disease progression with multi-source block-wise missing data. In Proceedings of the 2018 SIAM International Conference on Data Mining, SDM 2018, May 3-5, 2018, San Diego Marriott Mission Valley, San Diego, CA, USA., pages 288–296, 2018. [36] M. Linardi and T. Palpanas. Scalable, variable-length
similarity search in data series: The ULISSE approach. PVLDB, 11(13):2236–2248, 2018. [37] H. Liu, X. Li, and X. Zheng. Solving non-negative
matrix factorization by alternating least squares with a modified strategy. Data Min. Knowl. Discov., 26(3):435–451, 2013.
[38] Y. Liu, A. Niculescu-Mizil, A. C. Lozano, and Y. Lu. Learning temporal causal graphs for relational time-series analysis. In Proceedings of the 27th International Conference on Machine Learning (ICML-10), June 21-24, 2010, Haifa, Israel, pages 687–694, 2010.
[39] A. C. Lozano, H. Li, A. Niculescu-Mizil, Y. Liu, C. Perlich, J. Hosking, and N. Abe. Spatial-temporal causal modeling for climate change attribution. In Proceedings of the 15th ACM SIGKDD International Conference on Knowledge Discovery and Data Mining, KDD ’09, pages 587–596, New York, NY, USA, 2009. ACM.
[40] J. Luengo, S. García, and F. Herrera. On the choice of the best imputation methods for missing values considering three groups of classification methods. Knowl. Inf. Syst., 32(1):77–108, 2012.
[41] Q. Ma, Y. Gu, W. Lee, and G. Yu. Order-sensitive imputation for clustered missing values (extended abstract). In 35th IEEE International Conference on Data Engineering, ICDE 2019, Macao, China, April 8-11, 2019, pages 2147–2148, 2019.
[42] C. Mayfield, J. Neville, and S. Prabhakar. Eracer: A database approach for statistical inference and data cleaning. In Proceedings of the 2010 ACM SIGMOD International Conference on Management of Data, SIGMOD ’10, pages 75–86, New York, NY, USA, 2010. ACM.
[43] R. Mazumder, T. Hastie, and R. Tibshirani. Spectral regularization algorithms for learning large incomplete matrices. Journal of Machine Learning Research, 11:2287–2322, 2010.
[44] J. Mei, Y. de Castro, Y. Goude, and G. Hébrail. Nonnegative matrix factorization for time series recovery from a few temporal aggregates. In Proceedings of the 34th International Conference on Machine Learning, ICML 2017, Sydney, NSW, Australia, 6-11 August 2017, pages 2382–2390, 2017. [45] P. Merlin, A. Sorjamaa, B. Maillet, and A. Lendasse.
X-som and l-som: A double classification approach for missing value imputation. Neurocomputing, 73(7):1103 – 1108, 2010. Advances in Computational Intelligence and Learning.
[46] K. Mirylenka, V. Christophides, T. Palpanas, I. Pefkianakis, and M. May. Characterizing home device usage from wireless traffic time series. In Proceedings of the 19th International Conference on Extending Database Technology, EDBT 2016, Bordeaux, France, March 15-16, 2016, Bordeaux, France, March 15-16, 2016., pages 539–550, 2016. [47] F. Monti, M. Bronstein, and X. Bresson. Geometric
matrix completion with recurrent multi-graph neural networks. In I. Guyon, U. V. Luxburg, S. Bengio, H. Wallach, R. Fergus, S. Vishwanathan, and R. Garnett, editors, Advances in Neural Information Processing Systems 30, pages 3697–3707. Curran Associates, Inc., 2017.
[48] S. Moritz, A. Sardá, T. Bartz-Beielstein, M. Zaefferer, and J. Stork. Comparison of different methods for univariate time series imputation in R. CoRR, abs/1510.03924, 2015.
[49] S. Papadimitriou, J. Sun, and C. Faloutsos. Streaming pattern discovery in multiple time-series. In
Proceedings of the 31st International Conference on Very Large Data Bases, Trondheim, Norway, August 30 - September 2, 2005, pages 697–708, 2005. [50] S. Papadimitriou, J. Sun, C. Faloutsos, and P. S. Yu.
Dimensionality reduction and filtering on time series sensor streams. In Managing and Mining Sensor Data, pages 103–141. 2013.
[51] X. Qian, P. Richtárik, R. M. Gower, A. Sailanbayev, N. Loizou, and E. Shulgin. SGD with arbitrary sampling: General analysis and improved rates. In Proceedings of the 36th International Conference on Machine Learning, ICML 2019, 9-15 June 2019, Long Beach, California, USA, pages 5200–5209, 2019. [52] N. Radhakrishnan and B. Gangadhar. Estimating
regularity in epileptic seizure time-series data. IEEE engineering in medicine and biology magazine,


![Figure 16: Reproducing results of TRMF [70].](https://thumb-eu.123doks.com/thumbv2/123doknet/14253006.488444/12.918.76.426.152.443/figure-reproducing-results-of-trmf.webp)
