Publisher’s version / Version de l'éditeur:
Vous avez des questions? Nous pouvons vous aider. Pour communiquer directement avec un auteur, consultez la première page de la revue dans laquelle son article a été publié afin de trouver ses coordonnées. Si vous n’arrivez pas à les repérer, communiquez avec nous à PublicationsArchive-ArchivesPublications@nrc-cnrc.gc.ca.
Questions? Contact the NRC Publications Archive team at
PublicationsArchive-ArchivesPublications@nrc-cnrc.gc.ca. If you wish to email the authors directly, please see the first page of the publication for their contact information.
https://publications-cnrc.canada.ca/fra/droits
L’accès à ce site Web et l’utilisation de son contenu sont assujettis aux conditions présentées dans le site LISEZ CES CONDITIONS ATTENTIVEMENT AVANT D’UTILISER CE SITE WEB.
Cold Regions Science and Technology, 11, pp. 63-73, 1985
READ THESE TERMS AND CONDITIONS CAREFULLY BEFORE USING THIS WEBSITE. https://nrc-publications.canada.ca/eng/copyright
NRC Publications Archive Record / Notice des Archives des publications du CNRC :
https://nrc-publications.canada.ca/eng/view/object/?id=6639f521-4ad3-4c47-9dbf-b5bfc40aad5f
https://publications-cnrc.canada.ca/fra/voir/objet/?id=6639f521-4ad3-4c47-9dbf-b5bfc40aad5f
NRC Publications Archive
Archives des publications du CNRC
This publication could be one of several versions: author’s original, accepted manuscript or the publisher’s version. / La version de cette publication peut être l’une des suivantes : la version prépublication de l’auteur, la version acceptée du manuscrit ou la version de l’éditeur.
Access and use of this website and the material on it are subject to the Terms and Conditions set forth at
Stress concentrations in the root of an ice cover cantilever: model tests
and theory
Ser
THI
N21d
National Research Conseil natlonal1. 1312 .
I+
Council Canadade
recherche8
Canadac. 2
~
BEDG
Division of Division desBuilding Research recherches en bgtiment
Stress Concentrations in the Root
of an Ice Cover Cantilever:
Model Tests and Theory
by O.J. Svec, J.C. Thompson and R.M.W. FrederkingReprinted from
Cold Regions Science and Technology Volume 11, 1985 p. 63-73 (DBR Paper No. 1312) Ottawa Price $2.00 NRCC 24866
Les e s s a i s i n s i t u s u r une p o u t r e en porte-3-faux,
q u i s o n t
f r d q u e m e n t u t i l i s d s pour ddterminer l a r d s i s t a n c e
3
l a f l e x i o n
d'une c o u v e r t u r e de g l a c e , s o n t considgrablement modifids p a r
l a c o n c e n t r a t i o n des c o n t r a i n t e s
l a base de l a p o u t r e .
Une
t e c h n i q u e simple p a r l a q u e l l e l a c o n c e n t r a t i o n d e s c o n t r a i n t e s
e s t l i b 6 r d e p a r des t r o u s prd-perfords a d t d proposde, mise
3
l ' e s s a i i n s i t u
e t analysQe de f a s o n mathgmatique.
C edocument
d 6 c r i t une Qtude p h o t o - g l a s t i q u e
e t p a r dldments f i n i s de
l ' a p p r o c h e suggdrde.
Les r d s u l t a t s concordaient b i e n ,
ce q u i
i n d i q u e que l e s c o n c e n t r a t i o n s de c o n t r a i n t e s peuvent
&re
e f f i c a c e m e n t l i b e r g e s en p o r t a n t a t t e n t i o n
3
l a gdomgtrie du
t r o u
e t de l a poutre.
Cold Regions Science and Technology, 1 1 (1 985) 63-73
Elsevier Science Publishers B.V., Amsterdam - Printed in The Netherlands
STRESS CONCENTRATIONS I N THE ROOT OF AN ICE COVER CANTILEVER: MODEL TESTS AND THEORY
O.J. Svec
Division of Building Research, National Research Council of Canada, Ottawa, Ontario K I A OR6 (Canada)
J.C. Thompson
Civil Engineering Department, University of Waterloo, Waterloo, Ontario (Canada)
and R.M.W. Frederking
Division of Building Research, National Research Council of Canada, Ottawa, Ontario K I A OR6 (Canada)
(Received September 17, 1984; accepted in revised form December 17,1984)
ABSTRACT
In situ cantilever beam tests, which are frequently used to determine the flexural strength of an ice cover, are significantly influenced by the stress con- centration around the beam root. A simple technique whereby the stress concentration is relieved by pre- drilled holes has been proposed, tested in situ and analyzed theoretically. This paper describes a photo- elastic and finite element study of the suggested ap- proach. The photoelastic and finite element results agreed well with each other, indicating that stress concentrations can be relieved successfilly by atten- tion to the geometry of the hole and beam.
INTRODUCTION
The present paper is a continuation of earlier work by Svec and Frederking (1981); therefore only a short description of the problem is given here.
A realistic estimate of the bending strength of an ice cover is a very important factor for many en- gineering problems occurring in Arctic operations, or in the utilization of ice covers in general. Usually very simple tests are performed for measuring the strength, mostly using cantilever beams or plates cut out of a continuous ice cover. When cantilever beams are used, they are loaded to failure, at a sufficient rate to eliminate creep. Loads and deforma-
tions are recorded, and the ice strength, or Young's modulus, is calculated. However, since the simple solution for a clamped cantilever is usually employed, many factors influence these results (Svec and Freder- king, 1981). For example, the common assumption of a solidly clamped cantilever beam does not rep- resent the conditions that actually exist during the test. On the contrary, the in situ test beam is fixed elastically to the surrounding ice plate. Another very important factor is the effect of the stress con- centrations at the end of the cuts (root of the canti- lever). This paper presents a quantitative analysis of the stress concentrations at the root of cantilever beams using photoelastic and finite element tech- niques. A second paper will deal with experiences from full-scale in situ tests performed on a test pond ice cover and compare these tests to numer- ical results. This, in turn, will lead to a proposal for a new standard in situ bending strength test of an ice cover.
METHODS
The following analysis addresses questions related to the stress field near the connection of a cantilever beam to a surrounding plate, such as magnitude of the stress concentration factor and effect on stress distribution of decreasing the width of the beam. An important factor in the latter problem, in partic-
ular, is the location of maximum stress and thus the location if the initial crack leading to failure.
Two independent methods were selected for this purpose: experimental photoelasticity and numerical finite element analysis. The experimental program has been described in detail (Thompson, 1983) and only a short summary will be given here. The experimental program (performed at the Uni- versity of Waterloo) had the following objectives: (a) to determine the stress concentration factor at the end of the cut (cantilever root) under condi- tions approaching those obtained in field tests, and to compare to the clamped cantilever conditions normally assumed;
(b) to demonstrate stress relief in the root region by pre-drilled holes;
(c) to determine the influence of hole size and location (concentric, offset) on the stress relief; (d) to determine the influence of beam width on the stress concentration while keeping the size of the relief hole constant;
(e) to serve as a base for computer program val- idation.
Experimental set-up
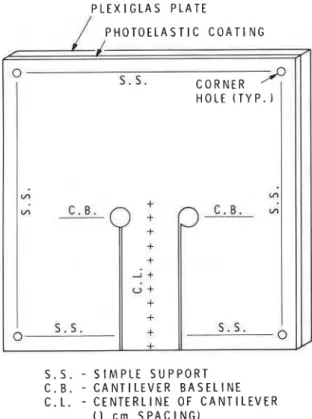
A 25 cm by 25 cm sheet of approximately 2 mm thick epoxy with a reflective coating on one side was bonded to a plexiglas sheet having a nominal thickness of 10 mm.
A 5 cm wide cantilever, centred along one side of the sheet, was made by cutting from the free edge into holes drilled previously with a 0.040 cm diam- eter drill (Fig. 1). The residual stresses induced by cutting the edges of the cantilever were small enough that they would not affect subsequent test stress values.
Two positions of stress relief holes at the root of the cantilever were studied: concentric and offset. These holes were approximately 0.5 16, 1.032,
1.468 and 2.223 cm.
In order to test the model, it was first mounted on steel rods representing simple supports. At each corner where the lines of these supports crossed, the model and the supported steel plate were lightly bolted together. This kept the corners from lifting off and thus duplicated the simple support boundary conditions assumed for the finite element model analysis.
S . S . - S I M P L E S U P P O R T C . B . - C A N T I L E V E R B A S E L I N E C . L .
-
C E N T E R L I N E O F C A N T I L E V E R( 1 crn S P A C I N G )
Fig. 1. Photoelastic model of a cantilever beam (from Thomp-
son, 1983).
The model, including the rod-and-steel plate unit, was then mounted on a rigid supportive stand and loaded with dead weights. Photographs of the photo- elastic pattern were taken, using both white and monochromatic light.
Finite element approach
Two confirming triangular-plate bending elements (Svec and Gladwell, 1973) developed by using 5th- and 7th-degree polynominals, were used in this work. Both of these elements have vertical displace-
ments (w), slopes (w,, wy) and curvatures (w,,
wxy, wyy) as degrees of freedom (D.O.F.) in their vertices. The higher degree element has two addi- tional nodal points per side with w and wn (where n indicates normal direction) D.O.F. and the centroid point with w, w, and wy D.O.F.
The computer program developed by Svec com- putes deflections, slopes, curvatures, moments, stresses, strains, principal stresses, and their direc-
tions, as well as difference in principal stresses a, - 0 2 .
The last quantity is proportional to the photoelastic fringe at any point of the stress field. Therefore the
plot of normalized ol - o2 contours represents an
important comparison between finite element and photoelastic methods.
All the above characteristics of a plate deforma- tion are calculated not only at nodal points but also at a large number of points of an internal element mesh. These points are generated automatically and are controlled by only one parameter. The con- tours of desired quantity, as for example deflections, moments or "corresponding photoelastic fringes" are all computed using this internal element mesh.
DISCUSSION OF EXPERIMENTAL STRESS ANALYSIS
The main results of an entire set of individual tests are summarized in Table 1. These results show that:
(a) As the diameter of the stress relief hole is in- creased, the peak stress (as measured by the max- imum fringe number) decreases monotonically. Even a small hole dramatically decreases the stress concen- tration caused by an unmodified saw cut.
(b) The stress concentration is lower and the stress "flow" from the beam into the plate is much smooth- er around an offset hole than a concentric hole of the same diameter.
TABLE 1
Stress concentrations a
(c) For both hole types, the location of maximum stress for small-diameter holes occurred on the back side, approximately 90" from the portion of min-
imum beam width. For larger hole sizes, i.e., d / t 2 1,
(d = hole diameter, t = plate thickness) the maximum
stress point was at or near the position of the min- imum beam width. Moreover, the edge stress, up to the hole is, for all practical purposes, identical to the centreline value.
(d) For small-diameter offset holes (dlt
<
0.8),the stress has a double maximum, one occurring in the beam near the edge of the hole, and the second on the back side of the hole. Both stresses exceed the centreline value at the corresponding position. For the limiting case of no stress relief hole of either type, the peak in stress just ahead of the end of the cut is clearly apparent from the photoelastic pattern. This can perhaps explain why ice beams with no relief holes often break in front of the end of the cut.
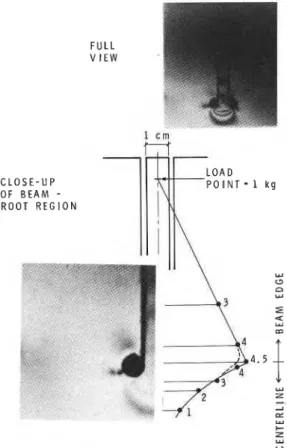
(e) An additional experimental study (Figs. 2 and 3)
investigated the influence of beam width on stress distribution. This study clearly demonstrates that the offset stress relief hole configuration leads to a stress field with a minimal stress concentration. This leads to the following conclusions:
(i) a numerical model based upon flexural theory should adequately predict the stresses in any parametric study of the effects of buoyancy, ice thickness, beam width, hole size, etc.;
(ii) the use of elementary flexural theory to interpret the field measurements of maximum
Hole Load Concentric hole Offset hole diameter position
mm (in.) cm S c m b 7 c m b 9 c m C 5 c m b 7 c m b 9 c m C
a As measured by maximum fringe order, no adjustment made for reduced beam width or torsional loading effects.
Estimated from photographs andlor negatives.
3 crn
C L O S E - U P L O A D
O F B E A M - P O I N T = 2 k g
R O O T R E G I O N
Fig. 2. Photoelastic results for offset hole, b = 3 .
deflection and breaking strength should give very reliable predictions of the ice cover stiffness and maximum tensile stress, particularly for nar- row beams ratio of beam width-to-thickness, y = 1).
FINITE ELEMENT RESULTS
While assessing the finite element analysis, two facts have to be borne in mind:
(a) Even for the case of a conforming, high preci- sion, bending triangular element, as used in this study, only continuity of deflection and its normal slope between two adjacent elements is satisfied. Second derivatives and therefore stresses and moments could become discontinuous along these element boundary lines.
(b) The finite element analysis is based on the
C L O S E - U P O F B E A M
-
R O O T R E G I O NY
C3
Fig. 3 . Photoelastic results for offset hole, b = 1.
principle of minimum potential energy leading to a "deformation model", where boundary conditions are satisfied only in terms of the deformation re- quirements.
The consequence of the first shortcoming is two- fold: first the stress concentration cannot be seen in great detail in areas close to critical points, where contours of a, - 0, may become discontinuous along element boundaries, and secondly, the analysis accuracy can decrease with increase of the stress concentration. That also means that normalized
ol - a2 contours (or fringe lines) can be compared
to photoelastic results successfully everywhere ex- cept very close to the positions of high stress con- centration.
The second shortcoming is related to boundary conditions along the free edge of the beam. The Love-Kirchhoff fourth-order plate theory (on which our plate finite elements are based) is able to satisfy
only two conditions along a free edge in the field of three functions; namely the transverse shear force, moment normal to the edge and the shear moment on the edge face. This deficiency might cause difficulties
I when the beam width-to-thickness ratio (y) ap-
I
proaches 1 .O. Kirchhoff developed a device known as "effective" transverse shear force, combining twistingmoment with the transverse shear force, namely:
Supporters of this practice argue that by Saint- Venant's principle, any error introduced by using the effective shear force is important only in a narrow edge zone of width equal to the thickness (h). In the deformation finite element analysis, the free edge is usually not treated by any boundary constraints, which in the case of narrow beams, might lead to some discrepancy with Kirchhoff s theory.
In spite of shortcomings and difficulties associated with Kirchhoffs mathematical model of a free edge plate in bending, its finite element solution gives very clear insight into the stress deformation behav- iour.
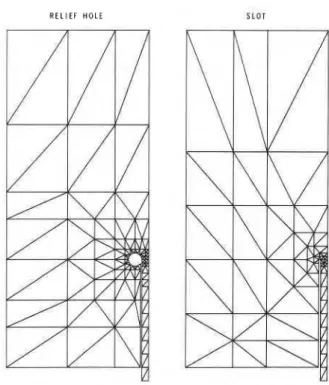
The computer program was successfully validated against simple examples for which exact solutions are known (fractions of % error) (Svec and Freder- king, 1981). Examples of finite element meshes used are shown in Fig. 4. For the problems under consid- eration, comparisons between experimental photo- elastic and numerical finite element methods were performed as shown in Figs. 5 and 6 . The numer- ical fringe contours (equivalent to photoelastic fringe lines) were obtained by normalizing absolute values of ol - a, by the stress level in the location of the experimental first fringe. The numerical results compare very well to the experimental behaviour, reproducing even some details of the stress distribu- tion.
The influence of width of the beam as well as in- fluence of stress relief holes is shown in Figs. 7, 8
and 9. Combination of the bending momen (My) and the shear moment (Mxy) across the root of two types of beams is apparent in Fig. 7. Solid lines represent results for beams with relief holes, while dashed lines are for beams formed by simple cuts only.
R E L I E F H O L E
6 7
S L O T
Fig. 4. Samples of finite element meshes.
All the curves for bending moments have the same characteristics: high peaks at the edge and lowest values in the centre of the beam. There is a remark- able difference between the results for beams with relief holes and those without. The bending moment (My) is more than twice as high at the edge for beams without relief holes, while in the centre there is little difference between the value of the moments for both geometries. The difference in twisting moments is even more pronounced. Its value at the edge of the beam is many times higher for beams formed by single cuts than for beams with relief holes. Influence of a relief hole is also shown in Table 2, where displacements, stresses and stress concentration factors are tabulated as functions of beam width. Results of the plate finite element (F.E.) analysis modelling the beam with and without relief hole (referred to a HOLE and SLOT, respec- tively) are compared to results of the simple beam theory. For y = 1, displacements at the tip of the beam compare well in all three cases; beam-analyt- ical, F.E.-HOLE and F.E.-SLOT. There is a large difference between the HOLE and SLOT cases in
Fig. 5. a , - a , fringes obtained by finite element method for a cantilever created by simple cuts.
!
F I N I T E ELEMENT A N A L Y S I S
e
P H o T o E L A s T l c A N A L Y S I Sb - 3 c m
-
'
B E R M 7.0i
l k l l l l l l l l -t
'.ej
- I-
- - + B E A M W I D T H-
- -
S L O T-
5 . 0-
-
R E L I E F H O L E-
I
H A L F B E A M W I D T H , c mFig. 7 . Distribution of bending moments (My) and twisting moments (Mxy) across the root of a cantilever.
stress concentration factors k l = u,,(F.E.)/u(beam) and k , = o,(F.E.)/u(beam) as well as in the prin- cipal stress direction
(4)
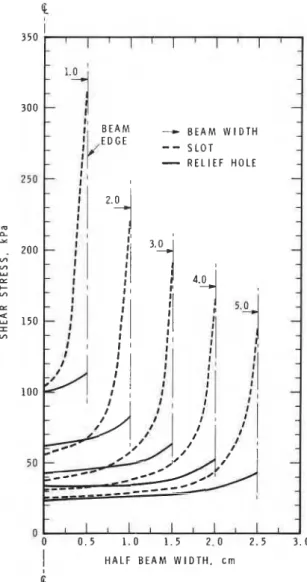
at the edge of the beam root. The principal stress direction clearly demon- strates, in particular, that in the beam with a relief hole, stress flows much more smoothly into the plate (see Fig. 13. The finite element analysis also shows the normal component of the stress tensor along the edge of the hole to be zero, as expected.--, B E A M W I D T H
- -
S L O T-
R E L I E F H O L EI
H A L F B E A M W I D T H . c mC
Fig. 8. Maximum shear stress distribution across the root of a cantilever.
As the width of the beam increases (y = 2,3,4, 5), the displacement at the tip of the beam connected to the plate differs increasingly from the displace- ment of the clamped cantilever. This difference is due to the "beam" behaving more like a plate as y increases. Therefore future standard tests should include correction factors related to the beam geo- metry. The influence of increasing y is also described in Miattinen (1975) where decrease in flexural strength with increasing beam width was obtained in full-scale experiments. A similar effect was found
TABLE 2
Displacements, stresses, stress concentration factors (E = 334,000 kg/cm2, v = 0.4, h = 1.0 cm, load = 5.92 kg) Beam-analytical Finite element-hole Finite element-slot
in small-scale tests in freshwater ice (Frederking and Timco, 1983). According to Table 2, the de- crease is caused not only by a two-dimensional effect, as correctly suggested by Maittznen, but also by a dramatic increase of the stress concentration.
400 zoo 100 I I I I I I I I I I
-
b ' I.? d b . 2 b - 3 b = d 4 2 h = 5 P A T H A R O U N D T H E C U R V E D R O O 1Fig. 9 . o , - o, distribution around an offset hole for dif-
ferent beam widths.
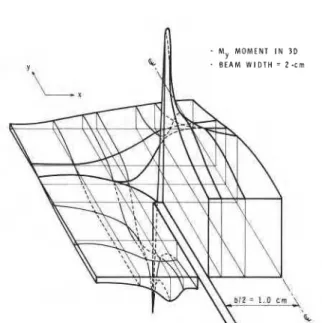
To emphasize the advantage of using relief holes at the root of a cantilever beam, distribution of moments, shear and principal stresses are shown in Figs. 10, 1 1 , 12 and 13. The first two graphs illus- trate in three-dimensional space what was described earlier, while the other two show the smooth stress flow from the beam into the plate when a relief hole is present.
Another interesting behaviour of the stress-mo- ment field in the vicinity of the slot can be observed in Fig. 10 and in our previous work (Svec and Freder- king, 1981). If the end of the slot has some definite width, then the momen
(My)
sharply changes sign across this width. This can also be observed, but in a much smoother fashion, along the edge of the relief hole. If, however, the width of the end of the slot is decreasing and eventually reaches zero, i.e., the slot ends in a point, then the My moment function along the slot has two peaks, before and after the slot end, with a slightly negative value right at the root of the slot.In all previous discussions, attention has been focused mainly on the stress distribution. It is also interesting to observe deformations which relate to Young's modulus; this is usually calculated from
- M y M O M E N T I N 30
B E A M W I D T H = Z.cm
Fig. 10. Bending moment (My) in 3-D space near the end
of the SLOT.
M y M O M E N T I N 3D B E A M W I D T H = 3 c m
Fig. 1 1 . Bending moment (My) in 3-D space near a relief
hole. b l 2 - I . 5 c m ' r - S H E A R S T R E S S I N 3D B E A M W I D T H = 3 c m y ~ x L
72
P R I N C I P A L D I R E C T I O N S
Fig. 13. (a) Principal stresses o, and a, in 3-D space around a relief hole. (b) Principal stress directions around a relief hole.
simple beam theory, namely, w = 4 P R 3 / ~ h3b since w (beam free-end displacement), load (P) and the beam geometry (b, h, R) are experimentally measured. A summary of results is presented in Table
2. As the beam width is increased, the deformation obtained from a plate model departs rapidly from a simple beam solution. The finite element model with relief holes shows slightly higher displacements than the beam without holes, as the beam-to-plate connection is smoother and appears more flexible. This could lead to a false conclusion that the deflec- tion for the SLOT case is closer to the analytical solution of a simple cantilever and thusmore accurate. However, the stress concentration factor, also shown in Table 2, is much higher for the beam without relief holes, which means earlier crack initiation in an ice beam; this indicates that the use of relief holes is far superior for determining the flexural strength.
CONCLUSIONS
Two independent stress analyses were performed to investigate techniques to relieve stress concentra- tion at the root of cantilever beams. In general, the use of relief holes has proven to be far superior to the use of simple cuts only. Good agreement between experimental photoelastic and numerical finite element methods has been achieved. The finite ele- ment method might lead to some problems due to the free edge boundary conditions.
According to Saint-Venant's principle, the edge zone equal to the beam thickness is affected by shortcomings in Kirchhoffs theory. Therefore, if
y
<
1 the use of thin plate theory could lead to a loss of accuracy. The proper choice of finite element mesh in such a case is important. The stress distribu- tion in the vicinity of the root of a narrow beam without a relief hole becomes three dimensional andshould be treated as such. Moreover, if y
<
1, thenthe beam should be analyzed using beam theory or plane stress theory. However, the ice cover suffi- ciently far away from the beam root still behaves as a plate. Perhaps a special mathematical model could be designed using substructures, where differ- ent regions are represented by different models. Since the computational errors in the present anal- ysis are much smaller than the variation that occurs in full-scale ice tests, such refinement could become an academic exercise. Moreover, if stress relief holes are used, the problem of stress concentration is almost completely removed and the use of simple flexural theory is fully justified.
It can be concluded that: (a) test beams should have a width-to-thickness ratio of about one, (b) the root should definitely be terminated in a stress relief hole, and (c) under the above conditions elementary flexural theory should be suitable for the calculation of strength and modulus of elasticity. This work has application to the establishment of a standard cantilever beam test for determining the flexural properties of ice covers.
This paper is a contribution from the Division of Building Research, National Research Council of Canada, and is published with the approval of the Director of the Division.
REFERENCES
Frederking, R.M.W. and Timco, G.W. (1983). On measuring flexural properties of ice using cantilever beams. Ann. Glaciol., 4: 58-65.
Maattanen, M., (1975). On the flexural strength of brackish water ice by in situ tests. Proc. 3rd Int. Conf. on Port and Ocean Engineering under Arctic Conditions, Fairbanks, AK, Vol. 1.
Svec, O.J. and Frederking, R.M. (1981). Cantilever beam tests in an ice cover: Influence of plate effects at the root. Cold Regions Sci. Technol., 4: 93-101.
Svec, O.J. and Gladwell, G.M.L. (1973). A triangular plate bending element for contact problems. Int. J. Solids Struct., 9: 435-446.
Thompson, J.C. (1983). To determine standards for the geometry of typical ice cover beam tests. Final Report 211-13, Waterloo Research Institute, University of Waterloo, Ontario.
T h i s p a p e r , w h i l e b e i n g d i s t r i b u t e d i n r e p r i n t form by t h e D i v i s i o n of B u i l d i n g R e s e a r c h , remains t h e c o p y r i g h t of t h e o r i g i n a l p u b l i s h e r . It s h o u l d n o t be r e p r o d u c e d i n whole o r i n p a r t w i t h o u t t h e p e r m i s s i o n of t h e p u b l i s h e r . A