Circuit models of stochastic genetic networks
The MIT Faculty has made this article openly available.
Please share
how this access benefits you. Your story matters.
Citation
Mandal, S., and R. Sarpeshkar. “Circuit models of stochastic genetic
networks.” Biomedical Circuits and Systems Conference, 2009.
BioCAS 2009. IEEE. 2009. 109-112. © Copyright 2010 IEEE
As Published
http://dx.doi.org/10.1109/BIOCAS.2009.5372073
Publisher
Institute of Electrical and Electronics Engineers
Version
Final published version
Citable link
http://hdl.handle.net/1721.1/59964
Terms of Use
Article is made available in accordance with the publisher's
policy and may be subject to US copyright law. Please refer to the
publisher's site for terms of use.
Circuit Models of Stochastic Genetic Networks
Soumyajit Mandaland Rahul Sarpeshkar
Department of Electrical Engineering and Computer Science Massachusetts Institute of Technology, Cambridge, MA 02139
Email: [email protected]
Abstract— We use analogies between chemistry and subthreshold electronics to develop fast, scalable, digitally programmable hardware models of stochastic genetic networks. We also present experimental results from a prototype 0.18µm CMOS chip that was designed for rapid simulations of gene activation, transcription and translation.
I. INTRODUCTION
Genetic networks can be usefully modeled and simulated using analog, digital, or hybrid electronic circuit analogs [1], [2]. In this paper we describe scalable circuit models of computationally-intensive stochastic genetic networks that build on our prior work on modeling chemical reactions by using log-domain transistor circuits [3]. Our models are suitable for rapid simulation, parameter discovery and optimization, and may be useful for answering a wide range of questions in both systems and synthetic biology.
II. MODELING
A. Induction and Activation
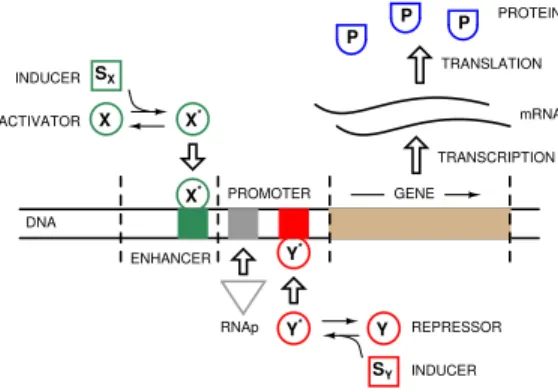
Genes are transcribed into messenger RNA (mRNA) by an enzyme known as RNA polymerase (RNAp). The rate of transcription is regulated by other proteins, known as transcription factors (TFs), that promote (activate) or hinder (repress) the action of RNA polymerase. TFs bind to specific DNA regions, known as binding sites. Binding sites are usually clustered into so-called enhancer and promoter regions located near the beginning of the gene. Activator proteins bind at the enhancer site, while repressor proteins usually bind somewhere on the promoter, as shown in Figure 1. We will denote such TFs as X. The inducer or substrate S is typically a small molecule that binds to a TF (whether repressor or activator). Inducer binding converts inactive TFs into active forms that can bind to the DNA,
i.e., S + X *) X∗, where X and X∗ are the inactive and active
forms of the TF, respectively. We will assume that this reaction is
always at equilibrium. As a result, we have [X∗] = [S] [X] /KSX,
where KSX is the dissociation constant of the reaction. We will also
assume that [X∗] [S] and [X], i.e., that S and X are present in
excess. As a result [S] and [X] are not depleted by the reaction, and can be treated as external inputs to the system.
The relationship between the concentrations of active TFs X∗and
the rate of transcription of a gene is known as its input function. Such functions are often assumed to be proportional to the fraction of DNA binding sites B occupied by an activator, or left vacant by a repressor. We assume that n activated TF molecules co-operatively bind to B, and that the binding reaction is always at equilibrium. As n increases the binding fractions transition abruptly between 0 and
βmaxas the value of [X∗] crosses a threshold KI, where βmaxis the
maximal rate of transcription. As a result they may be approximated as two-state, or logic functions [4]:
fA(X ∗ ) = βmaxθ (X ∗ > KI) fR(X∗) = βmaxθ (X∗< KI) (1) Y* DNA Y Y* SY X* X X* SX ENHANCER PROMOTER GENE REPRESSOR INDUCER RNAp ACTIVATOR INDUCER mRNA TRANSCRIPTION TRANSLATION P P P PROTEIN
Fig. 1. A simplified view of gene regulation. The gene is activated and repressed by TFs X and Y , respectively. Each TF is converted into its active form by binding to an inducer.
where fAand fRare the input functions for an activator or repressor,
respectively, and the “threshold” function θ( ) is equal to 1 if its argument is true, and 0 otherwise.
Most genes are regulated by multiple TFs, resulting in multi-dimensional input functions [5]. In our model, concentrations are represented by currents and the genes have N -dimensional input functions. In general such input functions cannot be factorized into the product of single-variable functions such as those shown in (1). However, arbitrary Boolean functions can always be written in the canonical “sum of products” (SoP) form, i.e., as the logical OR of minterms. Minterms of Boolean functions are formed by ANDing together each variable or its inverse.
We realized arbitrary input functions by generalizing the SoP form. Firstly, we do not restrict the i-product term to a minterm, which must include all N variables, but allow it to be the product of the normal
or negated forms of ni variables, where 0 ≤ ni ≤ N . Secondly,
we do not restrict our output to be the logical OR of the product terms, but allow it to be any arbitrary weighted sum of them. Thus, our output is no longer a Boolean variable, but a “soft” or analog OR of terms that are formed by ”hard” or binary AND operations. Intuitively, each product term sets its own maximal transcription rate
βmax, and the total transcription rate is found by adding the rates
of all active terms. The output, which we refer to as the activation
strength IACT V, controls the rate of transcription and is given by
IACT V = I0 s X i=1 βi "ni Y j=1 {fA(X ∗ k) , fR(X ∗ k)}j # (2)
where s is the number of product terms, k ∈ {1, 2, ..., N }, the βi
are dimensionless numbers, and I0 is a constant reference current.
The term within curly braces in (2) denotes the selection of either fA
or fR for any TF Xk. We also define the Boolean variable ACT V
as the logical OR of all the product terms in (2). The gene is being actively transcribed whenever ACT V = 1, with a non-zero activation
strength IACT V. It is inactive whenever ACT V = 0, which also
implies IACT V = 0.
B. Transcription and Translation
We shall assume that a single mRNA transcript is directly trans-lated into a single protein. The simplest reasonable model that is suitable for describing either transcription or translation is given by
X −→ Yk −→ φ, where X and Y are the reactant and product,γ
respectively, of either process, and φ is a degraded, inactive form of Y . The symbols k and γ represent the rates of first-order unidi-rectional reactions, and are known as the synthesis and degradation rates of Y , respectively [4]. The frequency response of this system is that of a first-order low-pass filter, with DC gain and time constant given by k/γ and 1/γ, respectively. We can exactly emulate these dynamics on-chip by using a current-mode first-order low-pass filter [3]. However, the circuit will run a factor of α faster than the chemical system, where α 1 is known as the speedup factor.
RNA polymerase moves at a finite velocity along the gene during transcription. As a result it takes a finite amount of time to “read” a gene and produce each mRNA transcript. This time-span is known as the transcription delay. We assume that gene activation turns on
mRNA formation after some transcription delay time TD. In other
words, the concentration of mRNA begins increasing at t = TDafter
ACT V goes high at t = 0. However, the delay TDis sign-sensitive,
and occurs only when the gene is activated. The value of TD= L/r,
where L represents the length of the gene and r represents the rate at which RNA-polymerase travels along it. We allow the user to independently set the transcription delay for every gene by making
TDdependent on an external control parameter.
Fluctuations in protein concentration can be attributed to two sources: intrinsic and extrinsic. Intrinsic noise is uncorrelated across genes, and arises from the inherent stochasticity within the processes of gene activation, transcription and translation. Extrinsic noise is correlated across multiple genes, and arises from fluctuations external to the gene itself, such as changes in TF and inducer concentrations with time. Models of intrinsic noise have been proposed for both prokaryotic and eukaryotic cells [6], [7]. Both models can be sum-marized by the system of reactions shown in Figure 2(a) for a single
active TF X∗. In prokaryotes, activated TF binding and unbinding to
DNA (ka and γa in Figure 2(a) respectively) occurs on time scales
that are much faster than transcription or translation. These processes lead to a quickly-varying square wave in the ACT V parameter of the gene (represented by A in Figure 2(b). These fast variations are low-pass filtered to create a mean value for A, shown as A in Figure 2(c). We would like to find the noise in mRNA and protein concentrations when A = 1, i.e., the gene is ’on’ and actively transcribing. For simplicity, we also assume that all β’s are 1 in (2).
A signal-flow block diagram view of the entire model is shown in Figure 2(b). Both transcription and translation are modeled as first-order low-pass filters with DC gain, as in Section II-B. The cutoff
frequencies of the filters are given by τr = 1/γr and τp = 1/γp,
respectively, while their DC gains are given by Ar = kr/γr and
Ap= kp/γp, respectively.
We assume that every reaction flux consists of uncorrelated arrivals or departures of molecules. The difference between the mRNA synthesis and degradation fluxes is integrated into the mRNA con-centration [mRN A]. Each flux has a power spectral density equal (PSD) to twice the mean flux, like any Poisson variable. The two
mean fluxes are krA and γr[mRN A], leading to PSDs of 2krA
and 2γr[mRN A], respectively. These PSDs are independent, and
therefore the total PSD that is filtered by the transcription filter is
B+X* B* ka γa fA(X*) kr mRNA φ γr kp prn φ γp A prn (a) (b) γr kp γp s 1 s 1 mRNA (c) 1/γr 1+s/γr mRNA 1/γp 1+s/γp prn kp kr kr A 4krA 4kpmRNA A
Fig. 2. A model of intrinsic noise in gene expression. The model is shown as (a) a set of chemical reactions, (b) a feedback block diagram and (c) simplified block diagram with noise sources. In (c) wavy lines represent the power spectral density of noise in steady state.
the sum of the two. However, at steady state the two fluxes must
have identical mean values, and so the total PSD is 4krA. Similarly,
the total PSD that is filtered by the translation filter is 4kp[mRN A]
in steady state. The resultant steady-state noise model is shown in Figure 2(c). It predicts the same result as the full stochastic analysis described in [6], but has the advantage of being simple to analyze using standard block-diagram techniques. It is easy to show that the variance in mRNA and protein concentrations is
σmRN A2 = krA γr = mRN A σprn2 = prn „ 1 +kp γr « ≡ prn(1 + b) (3)
where mRN A and prn = (kp/γp) mRN A are the mean
concentra-tions of mRNA and protein, respectively, and the second equation is
valid when γp γr, which is typical. The concentration of mRNA
has variance equal to its mean, i.e., behaves like a Poisson random variable. However, the upstream noise from transcription increases the variance of the protein concentration by a factor (1 + b) over a
Poisson variable, where b = kp/γris known as the burst parameter.
It is the average number of protein molecules produced from a single mRNA transcript, and is analogous to the current gain β of a bipolar transistor (BJT). As in a BJT, the total output noise power is the sum of β-amplified shot noise from the input (base or mRNA) and shot noise at the output (collector or protein).
III. CHIPDESIGN
Our prototype genetic network chip is 1.5mm × 1.5mm in size, contains 6 gene circuits, and accepts up to 16 external (off-chip) input signals. It was fabricated in a standard 0.18µm CMOS process. A connection matrix, consisting of an array of programmable switches, allows any external input to act as an inducer or TF for any gene. Each gene circuit contains programmable circuits for modeling activation, transcription and translation. Programmable parameter values are set on-chip by individually-addressable transistor or capacitor DACs. The outputs generated by the chip consist of each gene’s activation signal ACT V , and associated mRNA and protein concentrations.
A. Input Selection and Activation
The circuits that simulate the induction and binding of transcrip-tional activators and repressors to DNA can be divided into three blocks: connection matrix, inducer, and activator. Each gene can be
activated or repressed by a maximum of N active TFs, which are induced from their inactive forms by inducers. We allow each TF to have its own inducer, resulting in a total of 2N input signals for each gene. The connection matrix allows these signals to be connected to any of the 2N external inputs. We use previously-described log-domain circuits [3] to mimic the chemical reactions of inducer-TF binding. Single-variable activation functions are generated by simple current comparators that compare the concentration of active TF with a programmable threshold.
We implemented the complete activation function using a gen-eralization of the well-known Programmable Logic Array (PLA) approach for synthesizing arbitrary Boolean functions. In our modifi-cation, AND gates are replaced by more complex combinational logic blocks. Each block accepts the previous block’s output, and ANDs it
with a member of the set {fA, fR, 0, 1}, thus building up a product
term. Two control bits are fed into each block and determine which member of the set is selected for product formation. Once the product terms have been formed they can be combined by an S-input OR gate to create ACT V , or added together with programmable weighting
factors to create IACT V.
B. Transcription and Translation
The circuits that simulate the processes of transcription and trans-lation of a single gene can be divided into three blocks. The first block contains our model of transcription delay, the second simulates the dynamics of transcription, and the third simulates translation. We used translinear low-pass filter circuits to model the dynamics of both transcription and translation. Transcription delays were produced by the circuit shown in Figure 3. The output of the D-type flip-flop is ACT D, the delayed version of ACT V . It is immediately reset when ACT V goes low. However, it can only go high on rising clock edges,
which are delayed by a time TD. The delay was implemented with
an M -bit long shift register driven by an oscillator. The oscillator frequency can be set by the user over a 10-bit range, thus allowing
TDto be programmed. D RST Q CLK TD DELAY βD Vdd ACTV ACTD
Fig. 3. A simple circuit that generates sign-sensitive transcription delay.
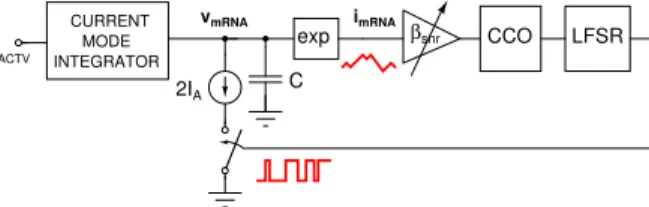
The Poisson electronic shot noise statistics of our circuits con-trollably mimic the molecular shot noise in cells at high SNR. Obtaining very low values of SNR, however, requires impractically small capacitors and bias currents. We designed a feedback loop to solve this problem by artificially generating controllable electronic fluctuations that are consistent with Poisson statistics. We have implemented the loop on-chip for the special case of transcription, since the concentration of mRNA within a cell is usually low enough for it to be the noise-limiting molecular species.
Our circuit is shown in Figure 4. A current 2IAthat is proportional
to the mRNA degradation rate γ is shut off by a pseudo-random waveform generated by the linear-feedback shift register (LFSR). LFSRs produce waveforms with properties close to random telegraph signals, i.e., random, uncorrelated transitions between two states,
which in this case result in currents of value 0 or 2IA. The waveform
has 50% duty cycle, resulting in an average degradation current of IA,
as assumed in previous sections. However, in this case the current is
not constant, but generated by a square wave that switches
pseudo-randomly between 2IA and 0. The clock frequency of the LFSR
is controlled by a current-controlled oscillator (CCO) whose input
is a scaled version of the mRNA concentration, i.e. βsnrImRN A,
where βsnr is a dimensionless number that can be programmed by
the user. The output frequency of the CCO is given by fcco =
βsnrImRN A/qosc, where qoscis characteristic to the CCO, and may
be viewed as the total charge supplied to the capacitors within the oscillator during one oscillation cycle. The total noise power in ImRN Aand Iprn, the protein concentration, are given by
i2 mRN A = » (qosc/βsnr) 2τr – ImRN A i2 prn = b » (qosc/βsnr) 2τr – Iprn (4)
where b = kp/γr, as in (3), and the second equation is valid when
γp γr. We see that total noise variances are proportional to
means, just like Poisson random variables. In fact, both variances are
∝ 2qef fI∆f , where qef f = qosc/βsnr is the effective charge and
∆f = 1/τris the bandwidth. Thus, our circuit replaces the electronic
charge q by the much larger charge qef f, resulting in lower SNR for
the same mean level of mRNA or protein. On this chip we obtained
a typical value of qosc= 9.2 × 10⁶q. The SNR at a given mean level
can be set by the user through the parameter βsnr, since SNR ∝ βsnr
when all other parameters are fixed. The current circuit only models noise from transcription, not translation. We can model translation noise in future chips if necessary with a similar circuit.
CURRENT MODE INTEGRATOR CCO LFSR vmRNA IACTV exp 2IA C imRNA βsnr
Fig. 4. Block diagram of the SNR adjustment circuit.
IV. CHIPMEASUREMENTS
The gene network simulator chip was mounted on a printed circuit board and interfaced with user interface software (written in MAT-LAB) running on a desktop computer. We successfully programmed the input function, activation threshold, transcription delay, transcrip-tion and translatranscrip-tion rates and delay times of each gene circuit. We also tested the SNR-adjustment circuitry. We know that the SNR of a stan-dard Poisson variable N is equal to its mean value N , i.e., the mean number of random events that occur during a counting (integration)
period. The mRNA concentration ImRN A can be normalized into a
standard Poisson variable NmRN A= NmRN A`ImRN A/ImRN A´ =
SNR`ImRN A/ImRN A´. Thus NmRN Ashould obey the well-known
Poisson probability distribution, and only SNR should affect it. We estimated probability distributions at various values of SNR by
vary-ing βsnrand measuring ImRN Aduring a time interval of T = 200µs
when transcription was active. Figure 5 shows both measured and theoretically-predicted probability distributions. The excellent match between the two distributions shows that the stochastic behavior of our chip is as expected.
Equation (4) shows that the SNR of mRNA, i.e., ImRN A2 /i2mRN A,
is proportional to the product βsnrImRN A. Therefore, it should
0.4 0.6 0.8 1 1.2 1.4 1.6 1.8 2 0 0.02 0.04 0.06 0.08 0.1 0.12 0.14 NmRNA/SNR p(N mRNA ) SNR = 11.1 SNR = 21.3 SNR = 42.8
Fig. 5. Measured (black) and theoretically-predicted (red) probability distributions of ImRN A at several values of SNR. The x-axis has been
normalized to NmRN A/SNR to facilitate comparison.
concentration should behave similarly, but with an excess noise factor. We verified this prediction experimentally by changing the input to
the transcription filter, i.e., the activation strength IACT V. The mean
value and SNR of both mRNA and protein should be proportional to IACT V. We varied IACT V over a 32:1 range while maintaining
a fixed value of βsnr = 10. We also kept the following parameter
values fixed: γp = γr, Ap = 2 and b = 2. The results are shown
in Figure 6. We see that the SNR increases linearly with mean concentration in both cases, as expected.
50 100 150 200 20 40 60 80 100 Mean (nA) SNR mRNA 100 200 300 400 500 600 700 0 100 200 300 400 Mean (nA) SNR Protein
Fig. 6. Measured SNR as a function of mean concentration for both mRNA and protein.
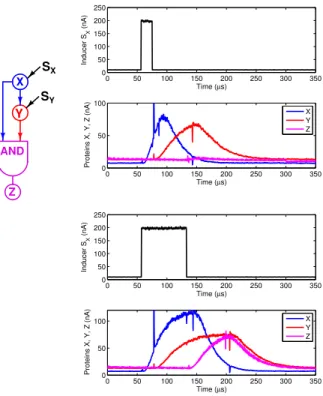
Gene regulation networks from a wide variety of organisms have been found to contain specific sub-networks in much greater abun-dance than expected by chance. Such sub-networks are known as network motifs. The simplest motifs, namely those that contain two or three genes, have been extensively studied. An example is the coherent feed-forward loop (FFL) motif described in [4] and shown in Figure 7. FFLs act as sign-sensitive delay elements and are common in cell signaling networks. The protein transcribed from gene X activates gene Y , while gene Z has an AND-like input function and is activated only when both the protein products of genes X and Y
are present. Induction of X by a pulse of the inducer SXturns gene
Z on after some delay, because both X and Y have to be higher than their thresholds for the output of the AND gate to go high. However,
Z turns off immediately when the pulse of SX is removed, because
the output goes low when either X or Y go below their thresholds.
The FFL also rejects short input pulses, i.e., pulses of SX that are
shorter than the turn-on delay do not activate Z.
Y Z X AND SX SY 0 50 100 150 200 250 300 350 0 50 100 150 200 250 Time (µs) Inducer S X (nA) 0 50 100 150 200 250 300 350 0 50 100 Time (µs) Proteins X, Y, Z (nA) X Y Z 0 50 100 150 200 250 300 350 0 50 100 150 200 250 Time (µs) Inducer S X (nA) 0 50 100 150 200 250 300 350 0 50 100 Time (µs) Proteins X, Y, Z (nA) X Y Z
Fig. 7. The coherent FFL (left) and measured transient responses to a pulse of inducer concentration (right). Plots are shown for a brief pulse (top) and a longer pulse (bottom). The brief glitches were caused by unwanted capacitive coupling to adjacent switching nodes.
We used three of the gene circuits on our chip to create a coherent FFL. The gene producing Z was programmed to have an AND-like input function. Figure 7 shows measured concentrations of the proteins transcribed from genes X, Y and Z in response to square
inducer pulses SX of two different durations. The circuit behaves as
expected. It exhibits sign-sensitive delay: Z follows rising transients of Y , but only after ≈ 60µs. However, it immediately responds to falling transients. In addition, the circuit distinguishes between short inducer pulses (which do not activate Z) and long pulses.
V. CONCLUSION
We have described integrated circuits for high-speed simulations of stochastic genetic networks. They may be useful for analyzing complex networks, particularly those involved in disease.
REFERENCES
[1] H. H. McAdams and L. Shapiro, “Circuit simulation of genetic networks,” Science, vol. 269, pp. 650–656, August 1995.
[2] S. M. R. Hasan, “A novel mixed-signal integrated circuit model for DNA-protein regulatory genetic circuits and genetic state machines,” IEEE Transactions on Circuits and Systems-I, vol. 55, no. 5, pp. 1185–1196, June 2008.
[3] S. Mandal and R. Sarpeshkar, “Log-domain circuit models of chemical reactions,” in ISCAS, 2009, pp. 2697–2700.
[4] U. Alon, An Introduction to Systems Biology: Design Principles of Biological Circuits, 1st ed. Boca Raton, FL: CRC Press, 2006. [5] S. Kaplan, A. Bren, A. Zaslaver, E. Dekel, and U. Alon, “Diverse
two-dimensional input functions control bacterial sugar genes,” Molecular Cell, vol. 29, no. 6, pp. 786–792, Mar. 2008.
[6] E. M. Ozbudak, M. Thattai, I. Kurtser, A. D. Grossman, and A. van Oudenaarden, “Regulation of noise in the expression of a single gene,” Nat Genet, vol. 31, no. 1, pp. 69–73, May 2002.
[7] J. M. Raser and E. K. O’Shea, “Control of stochasticity in eukaryotic gene expression,” Science, vol. 304, pp. 1811–1814, June 2004.