Publisher’s version / Version de l'éditeur:
Fuel, 67, 6, pp. 808-814, 1988
READ THESE TERMS AND CONDITIONS CAREFULLY BEFORE USING THIS WEBSITE.
https://nrc-publications.canada.ca/eng/copyright
Vous avez des questions? Nous pouvons vous aider. Pour communiquer directement avec un auteur, consultez la
première page de la revue dans laquelle son article a été publié afin de trouver ses coordonnées. Si vous n’arrivez pas à les repérer, communiquez avec nous à PublicationsArchive-ArchivesPublications@nrc-cnrc.gc.ca.
Questions? Contact the NRC Publications Archive team at
PublicationsArchive-ArchivesPublications@nrc-cnrc.gc.ca. If you wish to email the authors directly, please see the first page of the publication for their contact information.
NRC Publications Archive
Archives des publications du CNRC
This publication could be one of several versions: author’s original, accepted manuscript or the publisher’s version. / La version de cette publication peut être l’une des suivantes : la version prépublication de l’auteur, la version acceptée du manuscrit ou la version de l’éditeur.
Access and use of this website and the material on it are subject to the Terms and Conditions set forth at
Characterization of oil sands solids closely associated with Athabasca
bitumen
Kotlyar, Luba S.; Ripmeester, John A.; Sparks, Bryan D.; Montgomery,
Douglas S.
https://publications-cnrc.canada.ca/fra/droits
L’accès à ce site Web et l’utilisation de son contenu sont assujettis aux conditions présentées dans le site LISEZ CES CONDITIONS ATTENTIVEMENT AVANT D’UTILISER CE SITE WEB.
NRC Publications Record / Notice d'Archives des publications de CNRC:
https://nrc-publications.canada.ca/eng/view/object/?id=55759f3f-e75d-4027-958e-20f072939828
https://publications-cnrc.canada.ca/fra/voir/objet/?id=55759f3f-e75d-4027-958e-20f072939828
Characterization
of oil sands solids closely
associated with Athabasca
bitumen
Luba S. Kotlyar,
John A. Ripmeester,
Bryan D. Sparks and
Douglas S. Montgomery*
National Research Council of Canada, Division of Chemistry, M- 12, Montreal Road, Ottawa, Ontario, Canada KlA OR9
* Department of Chemistry, The University of Alberta, Edmonton, Alberta, Canada T6G 2G2
(Received 7 7 September 7987)
By means of density fractionation, solids associated with bitumen derived from a variety of oil sand grades, were separated into fractions having different humic matter content. Elemental compositions (daf) and calculated densities of the different fractions were similar suggesting a similarity in the nature of the humic matter. Density fractionated solids having a low (< 8 %) and a high (> 87 %) ash content were treated with NaOH for various periods of time to extract the humic acids. For all humic acids analysed the elemental composition and distribution of carbon types in each region of 13C n.m.r. spectra were similar. It has been shown that aromatic carbon was the predominant type of carbon for all samples. On the basis of the aromaticity data, it has been suggested that oil sand humic matter has a significant terrestrial input. (Keywords: tar sand; bitumen; aromaticity)
It is generally recognized that many problems encountered in the processibility of oil sand are due to the presence of organic matter insoluble in good solvents for bitumen, such as toluene and dichloromethane’ ~5. The greater part of this insoluble organic matter is known5 to consist of humic matter. In order to gain a deeper insight into the role that humic matter could play in the processibility of the oil sand, it is desirable to examine the chemical nature and the origin of this material. It is known from our previous work6 that solids enriched with humic matter could be liberated from the bulk of oil sand solids using the cold water agitation test (CWAT). It has been shown that two fractions of organic rich solids may be distinguished in oil sands: 1, solids closely associated with bitumen and 2, solids which can be isolated in the form of an aqueous suspension. Some properties of the solids suspended in the aqueous phase have been discussed earlier’.
The object of the present work was to characterize the organic rich solids closely associated with bitumen. A density separation method, commonly used in soil chemistrys,9, was applied to these solids to fractionate them into ‘free’ organic matter and organic components complexed with inorganic minerals. The chemical composition of the humic matter on different BS fractions is described as well as some characteristics of humic acids derived from these fractions, separated according to density.
EXPERIMENTAL
The work presented here was carried out on oil sands of estuarine origin obtained from the Syncrude quarry, Fort McMurray, Alberta. The oil sands were ground using a Comomil* and subsequently mixed to prepare
* Quadro Engineering Inc., Waterloo, Ontario 0016-2361;‘88/06080807f3.00
0 1988 Butterworth & Co. (Publishers) Ltd. 808 FUEL, 1988, Vol67, June
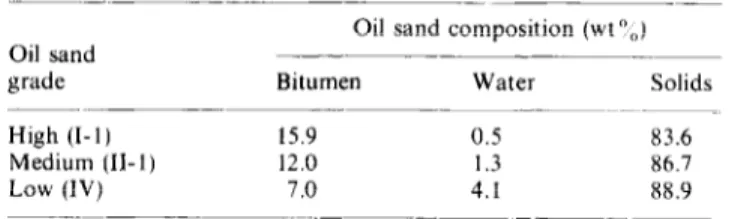
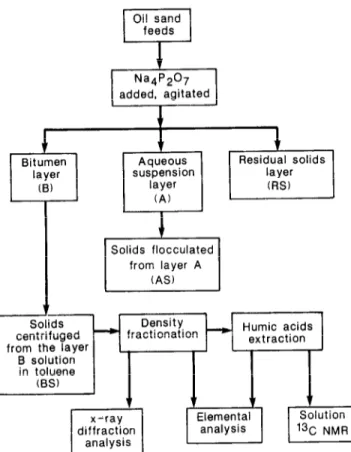
homogenized samples, and then stored in sealed containers. The compositions of the oil sand samples studied were determined using Soxhlet extractors in conjunction with Dean and Stark separators”. The results (Table I) include the bitumen concentration in three typical oil sands representing the high (I-l), medium (11-2) and low (IV) grades. The series of treatments given to each sample of oil sand is shown schematically in Figure 1.
Collf water agitation test (C WAT)
The procedure is described in detail elsewhere’ and is briefly summarized as follows: known amounts of 0.1% Na,P,O, solution were added to unextracted oil sand feed stocks. The samples were agitated using a high intensity Spex mixer. As a result of the treatment and settling by gravity the following layers (from the top to bottom) were formed: a bitumen layer (B) which was easily skimmed off, an aqueous suspension layer (A) which was separated by decantation, and a residue layer containing the bulk of the solids (RS). Toluene was added to each layer to dissolve bitumen. The solids separated from the toluene solution of the B layer will be referred to as bitumen layer solids (BS). The BS as well as A and RS fractions were repeatedly washed with aliquots of fresh toluene until the supematant toluene solution was
Table I Compositions of oil sands ___-.
Oil sand composition (wt “,)
Oil sand _-_____
grade Bitumen Water Solids
High (I-l) 15.9 0.5 83.6
Medium (II-I) 12.0 I .3 86.7
Characterization of oil sands solids associated with bitumen: 1. S. Kotlyar
zyxwvutsrqponmlkjihgfedcbaZYXWVUTSRQPONMLKJIHGFEDCBA
et al Aqueousr-l
suspension layer (A) 1 I I Solids flocculatedcl
from layer A (AS) Solidscentrifuged -) fractionation Humic acids from the layer
Y
Elemental
analysis
zyxwvutsrqponmlkjihgfedcbaZYXWVUTSRQPONMLKJIHGFEDCBA
Figure 1 Treatment scheme for oil sand
colourless. The solids of bitumen free layer A which will be referred to as AS, were flocculated using acetone. Flout-sink den.sit)~,fractionation
The BS fractions from the various grades of oil sand were fractionated in the density range from 1.58 g cme3 (carbon tetrachloride) to 2.64 g cmw3. Liquids of density greater than 1.58 g cmm3 were obtained by mixing carbon tetrachloride and bromoform (d = 2.88 g cm-3). The density fractionation procedure was as follows: to a known amount of BS (~2 g) liquid of density 2.6 g cm-3 was added (z 100 ml). Suspensions were mixed and then centrifuged for 1 h at 428 g. Floating material was collected from the surface of the suspension by suction, filtered, washed several times on the filter with acetone to remove traces of fluids used for density separation, dried and weighed. The procedure was repeated using fluids of densities 2.3, 1.9 and 1.6 g cmp3.
Humic and fulric acids extraction
Samples of density separated solids were digested with 2% aqueous NaOH at 70°C. Digestion of solids with fresh NaOH solution was repeated weekly for five consecutive weeks. The procedure for humic and fulvic acids extraction is described in detail elsewhere’. The fulvic acids content was insufficient for any analysis to be performed. The humic acids suspensions were initially freeze-dried with the final moisture removal being carried out at room temperature in a vacuum desiccator over P,O,.
’ 3C n.m.r.
Humic acids were dissolved in 0.5 N NaOH at a concentration of 5OGlOO mg ml-‘. ’ 3C n.m.r. spectra were obtained on a Bruker MSL-300 spectrometer, set to
a sweepwidth of 50 kHz with inverse gated proton decoupling to suppress nuclear Overhauser effect (NOE). A pulse flip angle of 45” was used with a pulse repetition time of 2 s. As there were no sharp features in the spectra, the FIDs were truncated at 2 K before zerofilling to 8 K. Between 20000 and 50000 transients were collected to obtain an adequate signal to noise ratio.
Infrared unalysis
Infrared spectra were recorded using a Perkin-Elmer model 683 i.r. spectrometer. Samples were run as KBr pellets.
Elemental unulysis
The elemental analyses (C, H, N) were performed using a Perkin-Elmer model 240 CHN analyser. The insoluble organic carbon content (IOCC) of all solid fractions was obtained by subtracting carbonate carbon from the total carbon. Carbonate carbon was analysed titrimetrically after acid digestion using a Carbon Dioxide Coulometer Model 5OlOl’. Total sulphur was analysed by a titrimetric oxygen flask combustion method, using a Schiiniger type combustion apparatus”. Determinations of total sulphur, both organic and inorganic (pyrite, gypsum and/or iron sulphate) were made by X-ray fluorescence spectrometry using a PET crystal. There were no Fe lines interfering with the sulphur line of interest.
RESULTS AND DISCUSSION
As shown in our previous report6, oil sand solids could be separated into three fractions by the cold water agitation test (CWAT). These fractions differed markedly in their insoluble organic carbon content (IOCC) (T&e 2). The solids separated from the bitumen layer designated as bitumen solids (BS) have the highest IOCC of 34.8-36.4x, followed by the solids isolated from an aqueous suspension (layer A) with IOCC of 5.4+5.9x, whereas the IOCC of the residual solids (RS) accounted for less than 0.3 wt%. To obtain more detailed information concerning the organic rich solids associated with bitumen, the BS fractions were subjected to density fractionation to separate them into ‘free’ organic matter and organic matter complexed with inorganic components. As a result four fractions were obtained for each BS of the three grades of oil sand. The range of the density fractions extended from 1.6 to 2.6gcme3, respectively.
Elemental analysis of BS density fractions
The yield and elemental composition of the density fractions are given in Table 3. A decrease in C, H and N
Table 2 IOCC of BS, AS and RS fractions separated by CWAT IOCC, wt “;, of dry bitumen free solids
of various types Oil sand sample BS AS RS I-l 34.75 5.40 0.03 II-1 35.22 5.90 0.20 IV 36.41 5.55 0.22
Characterization of oil sands solids associated with bitumen: L. S. Kotlyar et al.
Table 3 Yield and elemental analysis of the BS density fractions
Elemental analysis (‘I<) Oil sand I-1 11-l IV Density” fg cm-? 1.6 1.9 2.3 2.6 >2.6 1.6 1.9 2.3 2.6 >2.6 1.6 1.9 2.3 2.6 >2.6 c H N S Yield” Ash
(wt “/,l Total‘ Inorg. Org.” Inorg.d Total’ ( Yo)
20 57.50 0.19 4.3 1.1 1.38 0.31 1.6 3.8 20 43.81 0.63 3.4 0.9 1.06 0.37 1.8 30.8 35 36.83 2.30 2.6 0.7 0.71 0.58 1.8 52.9 20 8.60 2.05 0.6 0.1 0.61 3.61 4.1 75.2 5 3.70 1.40 0.5 0.0 n.s.’ ns. 3.2 86.9 20 56.20 0.43 4.1 1.1 ns. ns. 2.9 8.0 30 45.22 0.36 3.3 0.9 n.s. ns. 2.3 32.1 30 23.11 0.48 1.8 0.4 n.s. ns. 2.7 63.5 15 6.15 0.52 0.5 0.1 n.s. ns. 0.0 85.6 5 2.34 0.50 0.4 0.0 ns. ns. 1.2 87.3 30 51.64 0.30 4.2 1.0 ns. ns. 4.0 7.0 30 46.84 0.27 2.8 0.7 ns. ns. 3.3 34.2 20 24.13 0.33 1.9 0.4 ns. ns. 4.6 61.0 10 4.33 0.41 0.7 0.1 ns. n.s. 0.0 87.9 10 1.90 0.35 0.5 0.0 n.s. n.s. 1.4 89.1
“Solids collected from the surfaces of liquids with indicated densities bwt y0 is based on dry bitumen free BS
‘Organic and inorganic dX-ray fluorescence spectrometry
‘Titrimetric oxygen flask combustion method rNot sufficient sample
2.8
1.4
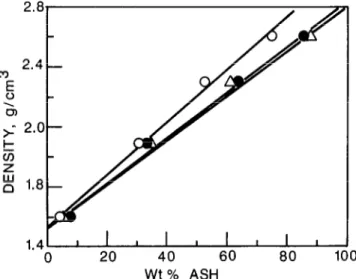
0 20 40 60 80 100 Wt % ASH
Figure 2 Density of various BS fractions versus wtO$ ash: 0, oil sand I-l; 0, oil sand 11-l; A, oil sand IV
concentration and an increase in ash content with increasing density is clear for all the BS fractions studied. For the one sample for which results were available (I- 1) organic sulphur content also decreased with increase in density. Conversely, there is a trend for inorganic carbon and sulphur to increase with increase in ash content.
By plotting the density against the percentage ash and extrapolating to zero ash, densities of humic matter were
estimated
zyxwvutsrqponmlkjihgfedcbaZYXWVUTSRQPONMLKJIHGFEDCBA
(Figure 2). It can be seen that they cover rather a narrow range from 1.51-1.54gcm-3 indicating asimilarity in humic matter present in different grades of oil sands.
The compositions of the density fractions on an ash free basis, atomic H/C, O/C, N/C, S/C ratios as well as densities (d) of humic matter calculated from the atomic volumes of the various atoms present as determined from elemental analysis are reported in Table 4. Densities were
810 FUEL, 1988, Vol 67, June
calculated using the following equation proposed by van Krevelen’ 3.
where R/C is the total number of rings per carbon atom. R/C was derived from the equation
(2)
where f, is aromaticity estimated by 13C n.m.r.
Compositions and calculated densities of ash free BS fractions showed no definite trend and did not vary widely (Table 4), which is an indication of the similar nature of organic matter in each of these samples. There is a good correlation between the zero ash density (Figure 2) and the densities calculated on the basis of the results of elemental analysis.
Extraction of humic acid from density separated BS
Based on its solubility, humic matter can be subdivided into three main fractions: 1, fulvic acid which is soluble at both high and low pH; 2, humic acid which is soluble only at high pH and 3, humin, which is completely insoluble in alkaline aqueous solution. To analyse the distribution and structure of soluble portions of BS humic matter, fractions with densities 1.6 g cme3 and 2.6 g crne3 of high grade (I-l) and 1.6 g cmm3 of low grade (IV) oil sand were extracted with 2 wt Y0 NaOH solution. The wt y0 of humic acids isolated during each particular week of treatment
versus extraction time is shown in Figure 3. It can be seen that the yield of humic acid per treatment was relatively constant during weeks 1 through 4 (although a slight decrease was observed after the first week for I- 1 and II- 1
Characterization of oil sands
zyxwvutsrqponmlkjihgfedcbaZYXWVUTSRQPONMLKJIHGFEDCBA
solids associated w ith bitumen: L. S. Kotly aret al.
Table 4 Elemental analysis (daf), atomic ratios and calculated densities of organic matter present in different BS fractions
Calculated’ density of
Density” of Elemental analysis (wt T,,, daf) Atomic ratio ash free
Oil BS fractions ---- BS fractions
sand &cm-‘) C H N Ob S H/C O/C N/C S’C (g cm _ -‘)
~- I-l 1.6 59.81 4.51 1.12 36.84 1.67 0.91 0.41 0.016 0.010 1.57 1.9 63.42 4.86 1.26 21.95 2.60 0.92 0.34 0.017 0.015 1.50 2.3 64.33 4.61 1.19 25.04 4.73 0.86 0.32 0.016 0.027 1.51 II- 1 1.6 61.11 4.45 1.24 30.01 3.15 0.87 0.37 0.017 0.019 1.56 1.9 66.40 4.80 1.39 21.81 4.50 0.87 0.27 0.018 0.025 1.47 2.3 63.42 4.92 1.25 23.33 4.89 0.92 0.28 0.016 0.028 1.50 IV 1.6 67.71 4.89 1.18 21.50 4.70 0.87 0.32 0.015 0.026 1.42 1.9 66.00 5.02 1.16 22.04 5.02 0.91 0.25 0.015 0.029 1.46 2.3 61.84 4.79 0.89 22.05 6.70 0.93 0.27 0.012 0.041 1.52
“Solids were collected from the surface of liquids with indicated densities bBy difference
‘Method described in Ref. 9 has been used for calculations
8-
6-
1 2 3 4 5
TREATMENT TIME, weeks
Figure 3 Yield of humic acid uersus time of NaOH (2 wt %) solution treatment: 0,1.6g cmm3 BS density fraction derived from oil sand I-l; a, 2.6g cmm3 BS density fraction derived from oil sand I-l; 0,
1.6 g cm-’ BS density fraction from oil sand IV
oil sand 1.6 g cm -3 fractions) and then sharply decreased.
Elemental analysis data of the humic acids extracted
during the first and fourth weeks are given in
Table 5.The
ash contents of humic acids ranged from 2 wt % to 3 wt %.
In general humic acid elemental compositions did not
change much with extraction time and were similar to the
results reported previously for humic acids extracted from
Athabasca oil sands5*r4. It should be mentioned that the
similarity in nitrogen content for humic acid and that for
nearly ash free BS (1.6 g cmm3 density fraction,
Table 4)indicates that nitrogen does not originate from material
adsorbed from bitumen as the nitrogen containing polar
fraction of bitumen is not alkali soluble. The higher
oxygen content of humic acid as compared with that of
1.6 g cmm3 density fractions of BS could be due to the fact
that much of the polar material is not soluble in NaOH.
Also humins that have lower oxygen content than humic
acids, comprise a significant part of oil sand humic
matter. Atomic H/C ratios for all humic acids were
relatively low which could be an indication of condensed
aromatic ring structures.
13C
n.m.r. spectra of humic acidLately 13C n.m.r. has been used extensively for
structural analysis of humic matter derived from natural
water, soils and coals15-24. However,
there is no
published information related to any n.m.r. study on
humic substances isolated from different oil sands grades.
The object of this work was first, to determine structural
parameters for oil sand humic acids extracted from the
‘free’ organic matter (1.6g crnm3 density fraction) as
compared to those for humic acids derived from the
fraction of density 2.6gcme3,
and second, to compare
n.m.r. characteristics of easily soluble humic matter (first
week of extraction) with those for humic acids isolated
during the fourth alkali treatment. Solution 13C n.m.r.
spectra of humic acid derived from the BS density
fractions are presented in
Figure4. All spectra could be
divided into five sections of chemical shift:
0to 50 ppm
(region I), aliphatic; 50 to 110 ppm (region II), N- and O-
substituted alkyl carbon, including carbohydrate, ether,
amine, amide, alcohol, acetal, ketal, methoxyl functional
groups; 110 to 160 ppm (region III), aromatic carbon.
Oletinic carbon which is not considered to be a major
constituent of humic acids” could also contribute to
region III. This band can be subdivided into a band
assigned to carbon bonded only to hydrogen or carbon
(ll(r145ppm)
and a band assigned to 0- and N-
substituted carbon (145-160 ppm); 160 to 190 ppm,
carboxyl, amide carbonyl, and ester carbonyl groups
(region IV); 190 to 220ppm, ketones and aldehydes
(region V).
Assignments for chemical shifts in these regions” are
given in
Table 6.The percentage composition of the
regions to the total spectra are shown in
Table 7.The
dominant signal in region I is observed at 230 ppm
which is assigned to the carbon of polymethylene groups
(CH,),. The broad band of resonances present in the
aliphatic region of all oil sand humic acids is an indication
of a wide variety of carbon types (methyl, methylene and
methine groups) being present. Area integration shows
that paraflinic carbon content is in the range from 22 to
27%
of total
carbon.
The
spectral
signals
at
approximately 55 ppm (region II) indicate the presence of
Characterization of oil sands solids associated with bitumen: L. S. Kotlyar et al.
zyxwvutsrqponmlkjihgfedcbaZYXWVUTSRQPONMLKJIHGFEDCBA
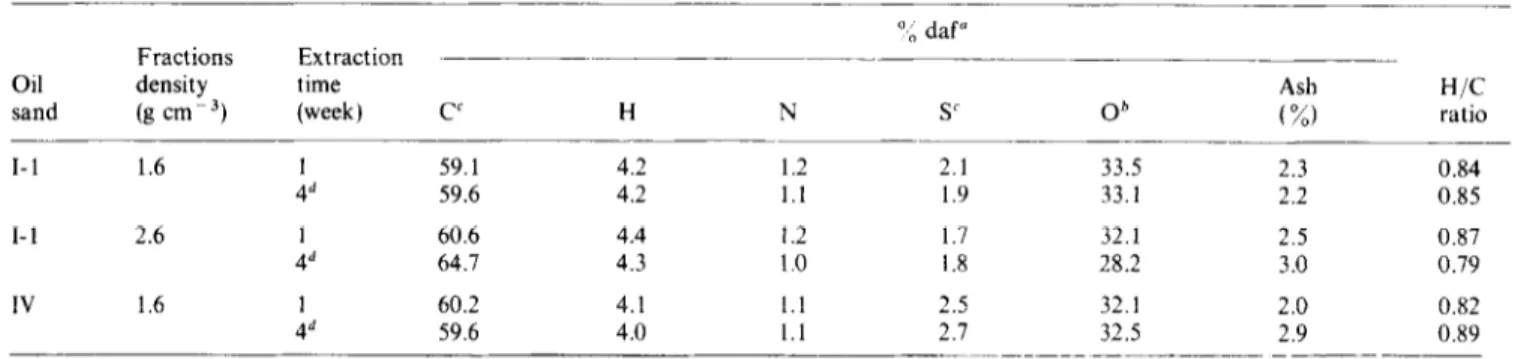
Table 5 Elemental analysis of humic acids derived from BS density fractions
a,” daf” Fractions Extraction
Oil density time Ash H/C
sand (g cm-? (week) CC H N SC Ob (%) ratio
I-1 1.6 59.1 4.2 1.2 2.1 33.5 2.3 0.84 59.6 4.2 1.1 1.9 33.1 2.2 0.85 I-l 2.6 & 60.6 4.4 1.2 1.7 32.1 2.5 0.87 64.7 4.3 1.0 1.8 28.2 3.0 0.79 IV 1.6 60.2 4.1 1.1 2.5 32.1 2.0 0.82 59.6 4.0 1.1 2.1 32.5 2.9 0.89
“Dry ash free basis bBy difference ‘Organic + inorganic
“Fourth week of extraction (not cumulative)
methoxyl groups. These functional groups are likely characteristics of lignin residues which are usually associated with terrestrial (as opposed to marine) sources of organic matter. Weak signals observed at 60-72 ppm and 106ppm suggest the presence of carbohydrates (polysaccharides), ethers, alcohols and amines. Region II carbon accounts for lo-17% of total carbon.
In region III a strong broad peak is observed at 130ppm. Such resonances could be provided by unsubstituted and bridgehead aromatic carbons or olefinic nuclei. However, olelins are known to be present in negligible amounts in geological materials. Alkyl benzenes could also resonate in the 130ppm region2’. Area integration shows that 41-49 % of the total carbon is aromatic. The presence of some phenolic and aryl alkyl ether carbons in region III is suggested by broad absorptions in the range 145160ppm. In region IV, relatively strong signals are centred around 175 ppm which is most likely that of carboxyl groups and amide carbon. In strongly alkaline solution phenolic carbon may also contribute to the spectral intensity in this region. Integration indicates that carbons in this area contribute from 9-15x to total carbon. The contribution from carbon in region V accounts for 4-6 ‘:/, of the total carbon.
The n.m.r. spectra in the 50-110 ppm, 1455160 ppm and 160-190ppm regions are complemented by the
infrared spectra
zyxwvutsrqponmlkjihgfedcbaZYXWVUTSRQPONMLKJIHGFEDCBA
(Figure 5, humic acid data derived from oil sand I-l, 1.6 g cm-3 density fraction, 1st week ofextraction. The i.r. spectra for the other humic acids were identical to that shown and hence they are not included). The presence of bonded carboxylic acids is suggested by a broad band in the region 3600-2000cm-’ and by the peaks at 17 10 and around 1200 cm- ‘. Polymeric phenols, alcohols and chelated ketones could also be present as indicated by the bands at 1710 cm-‘, 1610 cm-’ and the unresolved absorption between 1800 and 930 cm-‘.
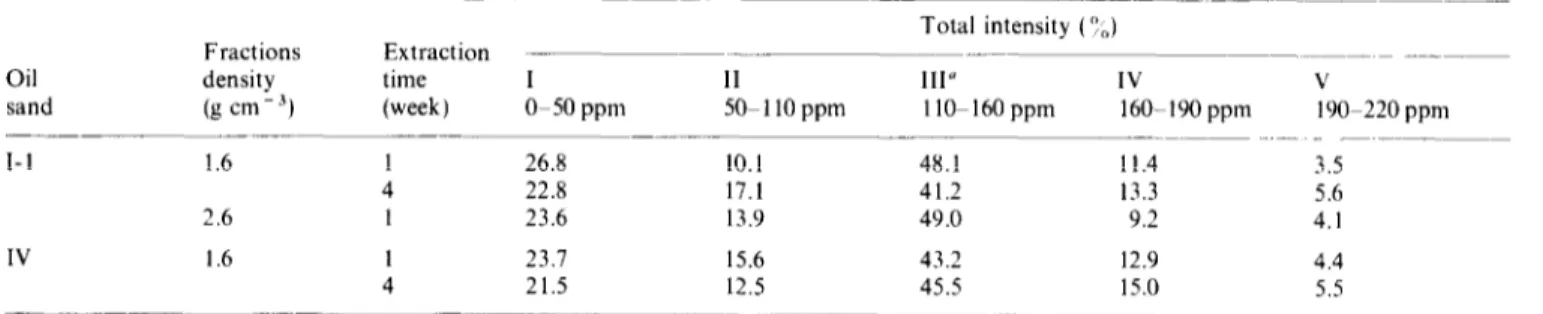
I I I I I c On the basis of the results showing the percentage
200 150
100
50
0
composition the following of the regions to the total spectra (Table 7) conclusions have been drawn: theCHEMICAL
SHIFT, ppm
distribution of carbon type in each spectral region issimilar for all oil sands humic acids and aromatic carbon Figure 4 Solution 13C n m.r. spectra of humic acid separated from: a.
oil sand I- 1, 1.6 g cm 3 density fraction, 1st week of extraction; b, as in
is the predominant type of carbon for all samples. Tub/e 7 a, 4th week of extraction; c. as in a, 2.6 g cm- 3 fraction; d. oil sand IV. also shows that with increasing length of time of 1.6gcmW3BSdensityfraction lstweekofextraction;e,asind,4thweek extraction with NaOH the areas in regions IV and V
of extraction increase showing a greater presence of carboxyl.
Characterization of oil sands solids associated with bitumen: L. S. Kotlyar et al. Table 6 ‘%-n.m.r. chemical-shift regions for various types of carbons present in humic substances
-_-_
Region I Region II Region III Region IV Region V
(@50 ppm) (50-110ppm) (llO-160ppm) (160-190 ppm) ( 190-220 ppm) -____ Paraffinic C:C--C.-C ‘; C-C’ --c 0 II ‘;
Alcohols C--OH Olefinic-C Carboxyl C-OH Aldehyde C-H
0 II
Amines (C-NH,.NHR.C-NR,) Aromatic-C Ester C--OR Ketone -C=O I 7 c--C’-c I C C-CH, _____ Carbohydrates Ethers (C-O-C) Methoxyl (OCH,) Acetals (O-C-O) 0 II Amide C-N
Table 7 Relative intensities for various regions of the 13C n.m.r. spectra of oil sand humic acids
Total intensity (OJ Fractions Extraction
Oil density time I II III” IV
sand (g cm - A) (week) O-50 ppm 50- 110 ppm 1 lo-160 ppm 160-190 ppm
I-l 1.6 1 26.8 10.1 48.1 11.4 4 22.8 17.1 41.2 13.3 2.6 1 23.6 13.9 49.0 9.2 IV 1.6 1 23.1 15.6 43.2 12.9 4 21.5 12.5 45.5 15.0 ____
‘Percent of carbon in 1 lo-160 ppm region to total carbon is used as a measure of aromaticity
V 190-220 ppm 3.5 5.6 4.1 4.4 5.5 I I I I I I I I I I I 4000 3000 2000 1600 1200 800 400 cm-l
Figure 5 Infrared spectrum of humic acid derived from oil sand I-l. I .6 g cmm3 density fraction, 1st week of extraction
To better understand the origin of oil sand humic acids, it is instructive to compare their spectral characteristics with those for humic acids isolated from soil, peat, coal and marine environments. Humic substances are known ’ s-17~19~20~23~24 to be derived from two major sources of plant remains: namely, marine and terrestrial. Relatively mature terrestrial humic substances are mainly aromatic and contain methoxyl, hydroxyl, carboxyl and ether functional groups. The primary contributor to humic matter in many terrestrial sediments is lignin, which is a relatively non-biodegradable macromolecular substance, predominantly aromatic in structure, which occurs only in terrestrial vascular plants. In marine humic
acid, aliphatic structures appear to be a major characteristic. These structures are derived from microbial exudates or possibly algal lipids. It is believed” that due to such differences in structure it is possible to distinguish between humic matter of terrestrial and marine origin. In this respect aromaticity (per cent of carbon in llO-160ppm region to total carbon) is considered to give a good indication of the relative contribution of terrestrial input to the sediment. It has been observed, for example, that in the case of marine humic acids, parafhnic structures are dominant and aromaticities are in the range 12-33 “/;. Soil humic acids have aromaticities ranging from 21 to 70~;,‘s~17~19. In humic acids derived from peat”, brown coa123, lignites and subbituminous coa124 aromatic carbon accounts for 40&68x. A comparison between the aromaticity data
presented in
zyxwvutsrqponmlkjihgfedcbaZYXWVUTSRQPONMLKJIHGFEDCBA
Tuble 7 and those reported in the literature suggests that humic acids derived from oil sand arelargely terrestrial in origin, as are those isolated from soils, peats and coals.
It is usually accepted that petroleum generation is associated with type-1 kerogenz6. The presence of type-III kerogen closely associated with the bituminous sand is typical of the material that might have become attached to the mineral matter at or slightly before the time of sedimentation. The high oxygen content and relatively high percentage of extractable humic acids are indicative of a low level of geothermal maturation of this material.
Characterization of oil sands solids associated with bitumen: L. S. Kotlyar et al.
CONCLUSIONS REFERENCES
By means of density fractionation, solids associated with bitumen (BS) derived from different grade oil sands, were separated into fractions having various humic matter (IOCC) content. The results for elemental analyses (daf) and calculated densities of humic matter extracted from different BS fractions, did not indicate significant differences in the nature of these materials. Some of the BS solids were subjected to NaOH treatment to extract humic acids. Elemental composition and 13C n.m.r. structural parameters for humic acids extracted from ‘free’ organic matter (1.6 g cmm3 density fraction) and those for humic acids extracted from mineral concentrate (2.6gcm-3 density fraction) were compared. Also the comparison was made between the properties of easily soluble humic matter (first week of extraction) and those for humic acids separated during the fourth NaOH treatment. For all humic acids analysed, elemental compositions as well as distribution of carbon types in each region of n.m.r. spectra were similar. It has been shown that aromatic carbon was the predominant type of carbon for all samples. Comparison between the aromaticity data for oil sand humic acids with those isolated from soils, peats and coals suggest that BS humic matter has a large terrestrial input.
1 ‘Guide to the Athabasca Oil Sands Area’, Carrigy, M. A. and Kramers, J. W., Eds., Can. Sot. Petrol. Geol., Oil Sands Symposium, 1973, p. 213
‘Oil Sands - Fuel of the Future’, Hills, L. V., Ed., Calgary Sot. Petrol. Geol. Mem., 1974, 3, p. 263
Clementz, D. M. Claq’s
zyxwvutsrqponmlkjihgfedcbaZYXWVUTSRQPONMLKJIHGFEDCBA
und Clay M iner& 1976, 24, 3 12 Sanford, E. C. Cun. J. Chem. Eny . 1983,61, 554Ignasiak, T. M., Zhang, Q., Kratochvil, B., Maitra, C., Montgomery, D. S. and Strausz, 0. P. AO STRA J. Res. 1985,2, 21
Kotlyar, L. S., Ripmeester, J. A., Sparks, B. D. and Montgomery, D. S. Fuel 1988,67, 221
Kotlyar. L. S.. Sparks, B. D. and Kodama, H. AO STRA J. Res 1985, 2. 104 11 12 13 14 15 16 17 18 19
Greenland, D. J. Soil und Ferrilizers 1965, XXVIII, 415 Turchenek, L. W. and Oades, J. M. Geoderma. 1979, 21, 311 ‘Syncrude Analytical Methods for Oil Sand and Bitumen Processing, Syncrude Canada Ltd., (Eds Blumer, J. T. and Starr, J.), Edmonton, Alberta, Canada, August 1979, p. 58 Huffman, E. W. D., Jr. M icrochem. J. 1977,22, 567 Schoniger, W., in ‘Proceedings of the International Symposium on Microchemistry, 1958’, Pergamon, New York, 1960, p. 93 van Krevelen, D. W. ‘Coal’, Elsevier, Amsterdam, 1961 Al-Nuaimi, K., Jha, K. N., Montgomery, D. S. and Strausz, 0. P., Final Progress Report to AOSTRA, Agreement No. 174, Section B, December 31, 1982
Calderoni, G. and Schnitzer, M. Geochim. Cosmochim. Acta
1984,48,2045
Preston, C. M. and Blackwell, B. A. Soil Sci. 1985, 139, 88 Hatcher, P. G., Schnitzer, M., Dennis, L. W. and Maciel, G. E. Soil Sci. Sot. Am. J. 1981, 45, 1089
Wilson, M. A. J. Soil Sci. 1981,32, 167
Hatcher, P. G., Breger, I. A., Dennis, L. W. and Maciel, G. E., in ‘Aquatic and Terrestrial Humic Materials’, ed. by Christman, R. F. and Gjessing, E. T. Ann Arbor Science Publishers, Michigan, 1983
ACKNOWLEDGEMENTS
The authors express their appreciation to Dr A. Hardin of Syncrude Research Ltd for providing the oil sand samples. We would also like to acknowledge the help of M. R. Miedema (heavy element determination), J. R. H. Seguin and V. Clancy (elemental analysis).
20 21 22 23 24 25 26
Hatcher, P. G., Maciel, G. E. and Dennis, L. W. O rg. Geochem.
1981,3,43
Newman, R. H. and Tate, K. R. J. Soil Sci. 1984,35,47 Preston, C. M. and Schnitzer, M. Soil Sci. Sot. Am. J. 1984,48, 305
Verheyen, T. V.. Johns, R. B. and Blackburn, D. T. Geochim. Cosmochim. Acta 1982,46, 269
Ibarra. J. V. and Juan. R. Fuel 1985.64. 650
‘Kerogen’, ed. by Durand, B. Technip-Paris, 1980, p. 162. Tissot, B. P. and Welte, D. H. ‘Petroleum Formation and Occurrence’, 2nd edn, Springer-Verlag, Berlin, 1984