HAL Id: hal-00316204
https://hal.archives-ouvertes.fr/hal-00316204
Submitted on 1 Jan 1996
HAL is a multi-disciplinary open access
archive for the deposit and dissemination of sci-entific research documents, whether they are pub-lished or not. The documents may come from teaching and research institutions in France or abroad, or from public or private research centers.
L’archive ouverte pluridisciplinaire HAL, est destinée au dépôt et à la diffusion de documents scientifiques de niveau recherche, publiés ou non, émanant des établissements d’enseignement et de recherche français ou étrangers, des laboratoires publics ou privés.
EISCAT/CRRES observations: nightside ionospheric ion
outflow and oxygen-rich substorm injections
N. G. J. Gazey, M. Lockwood, M. Grande, C. H. Perry, P. N. Smith, S. Coles,
A. D. Aylward, R. J. Bunting, H. Opgenoorth, B. Wilken
To cite this version:
N. G. J. Gazey, M. Lockwood, M. Grande, C. H. Perry, P. N. Smith, et al.. EISCAT/CRRES obser-vations: nightside ionospheric ion outflow and oxygen-rich substorm injections. Annales Geophysicae, European Geosciences Union, 1996, 14 (10), pp.1032-1043. �hal-00316204�
Ann. Geophysicae 14, 1032—1043 (1996) ( EGS — Springer-Verlag 1996
EISCAT/CRRES observations: nightside ionospheric ion outflow
and oxygen-rich substorm injections
N. G. J. Gazey1, M. Lockwood1, M. Grande1,6, C. H. Perry1, P. N. Smith2, S. Coles2, A. D. Aylward1,3, R. J. Bunting4, H. Opgenoorth5, B. Wilken7
1 Rutherford Appleton Laboratory, Chilton, Oxfordshire, OX11 0QX, UK 2 Space Science Centre, Sussex University, Falmer, BN1 9QH, UK 3 Atmospheric Physics Laboratory, UCL, London, W1P 7PP, UK 4 Department of Physics, York University, York, YO1 5DD, UK 5 Institutet fo¨r Rymdfysik, Uppsala, 75591 Uppsala, Sweden
6 Space Physics Department, Warwick University, Coventry, CV4 7AL, UK 7 Max-Planck Institut fu¨r Aeronomie, Katlenburg-Lindau, 37189, Germany Received: 10 April 1995/Revised: 19 April 1996/Accepted: 25 April 1996
Abstract. We present combined observations made near midnight by the EISCAT radar, all-sky cameras and the combined released and radiation efects satellite (CRRES) shortly before and during a substorm. In particular, we study a discrete, equatorward-drifting auroral arc, seen several degrees poleward of the onset region. The arc passes through the field-aligned beam of the EISCAT radar and is seen to be associated with a considerable upflow of ionospheric plasma. During the substorm, the CRRES satellite observed two major injections, 17 min apart, the second of which was dominated by O` ions. We show that the observed arc was in a suitable location in both latitude and MLT to have fed O` ions into the second injection and that the upward flux of ions asso-ciated with it was sufficient to explain the observed injec-tion. We interpret these data as showing that arcs in the nightside plasma-sheet boundary layer could be the source of O` ions energised by a dipolarisation of the mid- and near-Earth tail, as opposed to ions ejected from the dayside ionosphere in the cleft ion fountain.
1 Introduction
A number of authors (e.g. Baker et al., 1982) have dis-cussed the possible role of ionospheric O` ions in trigger-ing substorm onset. The presence of increastrigger-ing amounts of O` in the magnetospheric plasma can increase the growth rate of the ion-tearing mode instability, and this instability has been invoked to explain the sudden disruption of the cross-tail current prior to substorm onset (Bu¨chner and Zelenyi, 1987). The concentration of O` in the magneto-sphere has also been observed to increase during the early growth phase of substorms. Daglis et al. (1991), using AMPTE-CCE ion data, showed that the partial pressure
Correspondence to: N. Gazey
of all the major ion species, H`, O` and He2`, increases during the stretching of the tail field, but that while H` remains the dominant ion of the three, the largest relative increase in pressure is seen in O`. A further study by Daglis et al. (1994) showed the excellent correlation be-tween O` energy density and AE, and in particular be-tween O` energy density and AU, which increases in the growth phase, prior to onset. Given the almost complete absence of O` from the solar wind (Bame et al., 1970; Prange, 1978; Johnson, 1979), the ionosphere must be active in feeding the magnetosphere during the growth phase. Since auroral electron precipitation and in particu-lar auroral arcs are associated with upward beams of O` ions (Shelley et al., 1982), auroral arcs provide one means of populating the near-Earth plasma sheet with O`.
Ionospheric O` ions flow into the magnetosphere as beams (the result of field-parallel acceleration) or conics (due to transverse acceleration). Beams are associated mainly with outward field-aligned currents. Some beams are composed entirely of O` and some entirely of H` (Kintner et al., 1979). According to Frank et al. (1977), a flux of 1012 m~2 s~1 of O` must leave the topside auroral ionosphere to explain fluxes of O` observed at 35 RE, an estimate which is consistent with observations of outflow (with energies E'5 eV) made by the ISIS-2 spacecraft below 1 RE (Klumpar, 1979). Auroral oxygen-ion outflow is most profuse at low energies (0—100 eV), as demonstrated by observations of thermal O` upflows deduced from topside profiles by Lockwood (1982) and observations of thermal magnetospheric plasma by the RIMS experiment on DE-1 (Chappell, 1982; Moore et al., 1984; Chandler, 1991). Above 550 eV, the flux of O` in auroral ion beams can exceed that of H` by a factor of 5 (Ghielmetti et al., 1979; Gorney et al., 1981; Collin et al., 1981).
Upward flows of ionospheric ions have been confirmed by EISCAT radar studies (Jones et al., 1988; Winser et al., 1989; Keating et al., 1990; Wahlund et al., 1992). Keating
et al. (1990) performed a statistical survey of high-flux
were most likely to occur in the winter between 1900 and 0400 UT, with their occurrence peaking at about 2100 UT. At least two distinct types of ion outflow have been found. One is associated with frictional heating events caused by enhanced DC electric fields (Winser et al., 1989) and is characterised by an increase in field-aligned ion velocity and ion temperature but no significant increase in electron density at E-region altitudes. The large ion temperatures and temperature anisotropy (To'TE) in these events indicate the existence of high electric fields. Another class of event (Wahlund et al., 1992) is associated with electron precipitation (indicated by E-region density increases) and large electron-temperature increases without a large in-crease in ion temperature.
The ionosphere provides several other, seemingly con-tinuous, sources of ions to the magnetosphere, namely the
polar wind and the cleft ion fountain. The polar wind
(Banks and Holzer, 1969) consists of H` and He` ions, expelled from the ionosphere by the ambipolar field gener-ated by the charge separation of the O` gas and the lighter electron gas. The classical theory of the polar wind predicted that the heavier O` ions would be gravitation-ally bound, but data from the DE-1 satellite showed that high-altitude ion flows sometimes consist almost entirely of O` at low energies. Yau et al. (1984) found that the occurrence probability of O` above 10 eV could be as large as 30% in the polar cap. Likewise, the RIMS instru-ment on DE-1 showed that O` ions could be dominant in the polar cap in the energy range 0—50 eV (Waite et al., 1985). Waite et al. found further that in several of the cases that they studied, the O` ions originated from a restricted part of the polar cap and had subsequently been carried towards the nightside by anti-sunward convection. Lock-wood et al. (1985a) identified this persistent source of upflowing ionospheric ions (including O`) in the energy range 1—20 eV as coming from the cleft, and subsequently coined the term ‘‘cleft ion fountain’’ (Lockwood et al., 1985b).
Ionospheric ion upflows bear a complex relationship to actual O` outflow into the magnetosphere. Ion upflow in the ionosphere consists mainly of O` ions, but this sup-ports in part the escape of H` via charge exchange. The flux of H` escaping into the magnetosphere has a max-imum value and O` escape is often inferred from low-altitude upflows which exceed this value. It is also unclear how much of the O` upflow simply falls back to the Earth at a later time under gravity (Chandler, 1995). Further-more, upflows can be part of a thermal expansion of the ionosphere, the ions subsequently returning when it con-tracts again. However, the elevation of ions to an altitude where transverse or parallel acceleration can act to give them sufficient velocity to overcome gravity will enhance O` escape fluxes. Ions with the greatest parallel velocity are carried farthest down the tail by high-latitude convec-tion. Since the velocity of O` ions is four times less than that of protons of the same energy, the time of flight of O` ions along a given field-aligned path is four times larger than that of H`, and the distance moved by the convect-ing field line is likewise that much larger. This means that convection influences O` trajectories far more than H` trajectories, and that O` from the nightside auroral oval
Fig. 1. A schematic illustration of the respective paths into the magnetosphere of O` ions from the dayside cleft and the nightside auroral ionosphere. The empty arrow represents the dipolarisation convection surge. X marks the tail reconnection neutral line. Recon-nection at X allows cleft-ion-fountain plasma to cross the open/closed field line boundary closer to the Earth (at A)
will tend to be deposited in the near-Earth tail (GSM/GSE X"!5 to !10 RE).It has been suggested that ions from the cleft may contribute to substorm onset (Cladis and Francis, 1992). To be seen in the energetic particle injection associated with the substorm expansion phase, the O` must already be present in the magnetosphere on the field lines which dipolarise in the convection surge. Ions that come from the cleft are initially on open field lines and stay frozen on to the field lines along which they were ejected as the field lines convect across the polar cap. Therefore, for cleft-ion-fountain ions to gain access to the onset region, they must first cross the open/closed field-line separatrix (A in Fig. 1) which can only happen if there is ongoing closure of open flux at the neutral line during the growth phase. The only alternative to this is through violation of the frozen-in approximation, such as finite gyro-radius effects. How-ever, it is unlikely that these can on their own give rise to large-scale transport of ions across the separatrix. With-out growth phase reconnection at the neutral line, cleft-ion-fountain ions travel down the tail lobe and have no access to the onset region (an alternative trajectory, which is also shown in Fig. 1). Since the travel time from the cleft to the onset region is typically several hours (as demon-strated by the convection time in the ionosphere; see also simulations by Cladis and Francis, 1992), there is insuffi-cient time for O` leaving the cleft in the growth phase to reach the onset region by the time of onset at the end of that growth phase. This is true even if tail reconnection does take place during the growth phase. It is now be-lieved that substorm onset occurs on closed field lines at the inner edge of the plasma sheet (Elphinstone et al., 1991; Samson et al., 1992a, b, Murphree et al., 1993; Lopez et al., 1993; Gazey et al., 1995); the evidence for this has recently been reviewed by Lockwood (1995). Ions which have been ejected into the magnetosphere from the closed field-line region, e.g. by an arc equatorward of the open/closed field-line boundary, but poleward of the onset region, already find themselves on closed field lines and
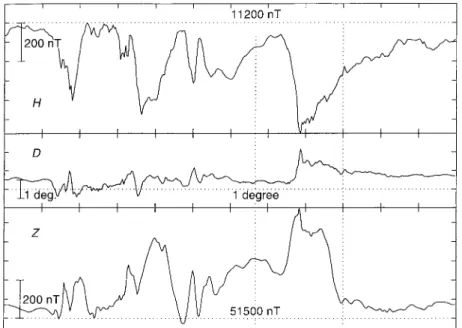
Fig. 2. The magnetogram recorded at Tromsø Auroral Observatory on 7 March 1991. Negative H indicates a westward electrojet. Positive Z indicates that the electrojet is to the south of Tromsø. The dotted lines span the interval (2120—2230 UT) covered by the EISCAT and magnetometer data given in Figs. 7, 8 and 6, respectively
therefore have direct access to the onset region without the need for any pre-onset reconnection to take place. The two possible sources of O` are illustrated in Fig. 1. 2 Observations
The interval under discussion in this paper is 2120—2230 UT on 7 March 1991. From the magnetogram recorded at Tromsø (Fig. 2), we see that this interval encompassed the third in a sequence of substorms that occurred on that evening and, as for the previous two, the electrojet signa-ture indicates a westward electrojet, centred to the south of Tromsø. Data on the interplanetary magnetic field (IMF) from the IMP-8 satellite (Fig. 3) show that the
Z component had been negative (at the spacecraft) since
about 2020 UT, and thus that open magnetospheric flux is likely to have been generated for at least an hour and a half before this substorm occurred.
We also call upon data from the combined release and radiation effects satellite (CRRES) (Wilken et al., 1992), which flew in a geosynchronous transfer orbit, inclined at 180 to the equatorial plane, with apogee at 6.3 RE. The spin period was about 27 s. From December 1990 until April 1991, a period which encompassed the observations presented here, apogee was within a few hours of local midnight. With CRRES’ orbit being nearly geostationary near apogee, it was well placed to measure nightside substorm phenomena. Figure 4a pictures orbit 548 of the satellite, with the interval covered by Fig. 4b (2120—2320 UT, 7 March 1991) marked in bold. The nightside of the Earth is coloured black and the axes are measured in units of Earth radii in the GSM coordinate system. In the upper panel, the orbit is shown from the viewpoint of the dawn sector of the equatorial plane, while in the lower panel one looks down upon the equatorial plane from above the north pole. During the period 2120—2230 UT, CRRES
was quite near to the magnetic equatorial plane and also west of EISCAT, although it was on an ¸-shell (¸"6.6) close to EISCAT’s. Figure 4b traces CRRES’ northern magnetic footprint. CRRES was within the domain of the Earth’s internal magnetic field during the period of interest.
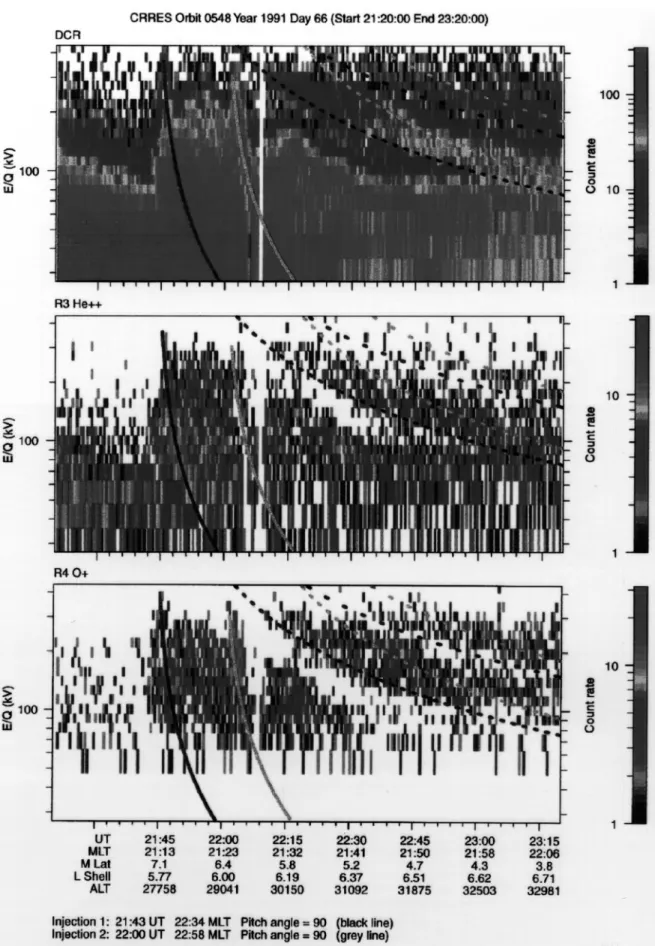
Figure 5 shows data from the magnetospheric ion com-position spectrometer (MICS) instrument which mea-sured atomic mass and charge states of ions in the range 1—425 keV/Q (Wilken et al., 1992). Ions entering the instru-ment passed through three detector stages: the electro-static analyser, in which only ions of particular energy-to-charge ratio (E/Q) could traverse the full length of the analyser (voltage varied in 32 logarithmic steps from 1—425 keV); the time-of-flight detector which allowed the energy-to-mass ratio (E/m) to be measured; and a solid-state detector which measured the total energy (E) of ions above 40 keV which had made it there. This triplet of measurements yields E, m and Q. The colour contours of Fig. 5 show spin-averaged count rates, which are nearly proportional to differential number flux (m~2 s~1 sr~1). The top panel (DCR) shows all counts which registered a time of flight in the MICS instrument. The next two panels show counts of alpha particles (He2`) and oxygen ions (O`), respectively. Note that most of the counts which figure in the DCR panel are due to hydrogen ions (H`), not He2` or O`.
The dispersive features visible on the plots are termed drift echoes and arise because ions from a given injection drift round the Earth at different speeds due to grad-B drift, according to their energy per unit charge (E/Q). Superimposed upon Fig. 5 are simulated drift echoes for ions in a dipole magnetic field (Grande et al., 1992). The drift motion of particles in the energy range of the MICS instrument arises predominantly from magnetic-field gradient effects, the effect of electric fields being negligible. In the modelling, ions are assumed to be trapped at the
Fig. 3. The IMF’s Z component measured in the solar wind by the IMP-8 satellite (positionM29.7, 12.3, !15.1N R
Ein GSM). The dotted lines span the interval (2120—2230 UT) covered by Figs. 6—8
Fig. 4a, b. Orbital parameters for CRRES’ orbit 548; a in GSM coordinates. The solid line marks the orbit segment for the time spanned by Fig. 5; b CRRES’ northern magnetic footprint for orbit 548. Also plotted are the positions of the substorm electrojet as it progressed westwards. W1 and E1 are the westward and eastward ends of the current wedge for 2139 UT; W2 and E2 are for 2144 UT; W3 and E3 are for 2152 UT; and W4 and E4 are for 2156 UT
magnetic equator and to drift westwards in circular orbits with a period proportional to the reciprocal of ion E/Q and geocentric distance (Lyons and Williams, 1984). The UT and MLT of each simulated drift echo is varied to match the observations and the best-fit injection location in UT, and MLT is given in the bottom left-hand corner of Fig. 5. The model reproduces the observed drift echoes fairly accurately, despite its simplicity. This means that we can estimate the injection location of O` and He2` ions observed by MICS, which is crucial in trying to compare CRRES and EISCAT observations when CRRES was magnetically west of EISCAT. Figure 5 shows two simulated drift echoes, one from the first major injection seen by CRRES (black line) which contained both He2` and O` ions and the second (grey line) from a subsequent oxygen-rich injection. Modelling of the first, He2`-rich, injection places it at 2143 UT (2234 MLT) while the sub-sequent O`-rich injection seems to have taken place at 2200 UT (2258 MLT). The location of the injection point in UT is fairly well determined by the modelling, although the deduced injection MLT may be out by up to about 30 min. Nevertheless, the modelling does show that the injections occurred at an MLT close to EISCAT’s (\2330 MLT) at that UT.
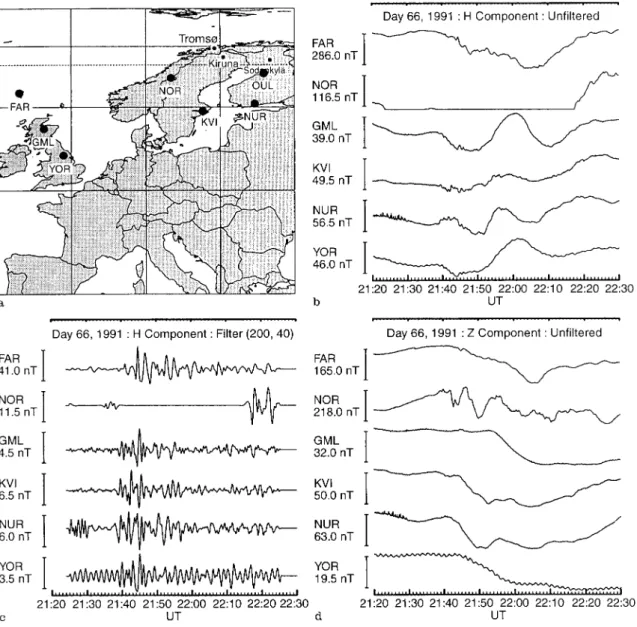
Substorm onset occurred at 2139 UT, as deduced from SAMNET magnetometer data (Fig. 6a) (Yeoman et al., 1990). Onset is in evidence both as perturbations in the
H components from the various stations (Fig. 6b) and as
Pi2 pulsations in H (Fig. 6c). At all SAMNET sites, with the sole exception of NOR, the deviation in Z (Fig. 6d) at onset was negative, suggesting that the onset electrojet was north of the SAMNET network. Since the Tromsø magnetogram (Fig. 2) indicates that the onset electrojet was to the south of Tromsø, we can surmise that the onset electrojet fell between Tromsø and SAMNET in geomag-nmetic latitude. We have applied the York electrojet model (Orr and Craymonson, 1994) to these data. The movement of the substorm electrojet as deduced by this model is represented (approximately, in geographic co-ordinates) in Fig. 4b by a series of dots and crosses representing the field-aligned currents at the ends of the electrojet at various times. In geographic coordinates, the model puts the western end of the onset electrojet at about
Fig. 5. Particle data from the MICS instrument aboard CRRES for 7 March 1991 (orbit 548). The black lines superimposed upon the data are simulated injection signatures for the He2`-rich injection of
2143 UT. The grey lines are simulated injection signatures for the O`-rich injection at 2200 UT which followed it. Note the instrumen-tal cutoff at low energy in the third panel (O`)
Fig. 6. a The SAMNET magnetometer sites (solid dots) and the EISCAT sites (black dots on white); b Magnetic H components observed by SAMNET stations on 7 March 1991. Note that the Nordli (NOR) magnetometer was saturated between about 2120 and
2210 UT; c SAMNET H components filtered to show Pi2 pulsa-tions; d Magnetic Z components observed by SAMNET stations on 7 March 1991
65°N, 10—13°E and the eastern end at 67°N, 65°E, its eastern end therefore stretching well beyond the SAM-NET chain (Fig. 4b, [W1, E1]). At about 2144 UT, a sec-ond electrojet appeared, west of the first and on a similar ¸-shell, with its western end at 352°E and its eastern end at 12°E, near the centre of the SAMNET array (Fig. 4b, [W2, E2]). By 2152 UT the two electrojets appear to have coalesced into one whose western end had moved west-wards to about 345°E (Fig. 4b, [W3, E3]). By 2156 UT the single electrojet had moved still further west to 332°E (Fig. 4b, [W4, E4]). By 2200 UT the current magnitude in the eastern end of the electrojet was falling and had begun to sink everywhere at about 2204 UT.
Figures 7 and 8 show analysed EISCAT results for the period 2120—2230 UT. An increase in ionisation typical of an arc can be seen at 2127 UT (panel 1, Fig. 7), followed by
a more major increase in ionisation between 2149 and 2159 UT, when the substorm expanded polewards over the EISCAT beam. It is clear that the arc at 2127 UT was associated with a large rise in electron temperature, but not in ion temperature (panels 3 and 4). Also, the field-aligned velocity (panel 5), both before and after the event was relatively high, and there was a noticeable ion outflux during the event itself (panel 6, units of 1012 m~2 s~1). At 2140 UT, a series of quasi-periodic electron-density en-hancements with a period of 6—8 min and substructure of period 1—2 min began to populate the region of the EIS-CAT beam at F-region altitudes. This material probably drifted into EISCAT’s field of view from the dayside (Lockwood and Carlson, 1992).
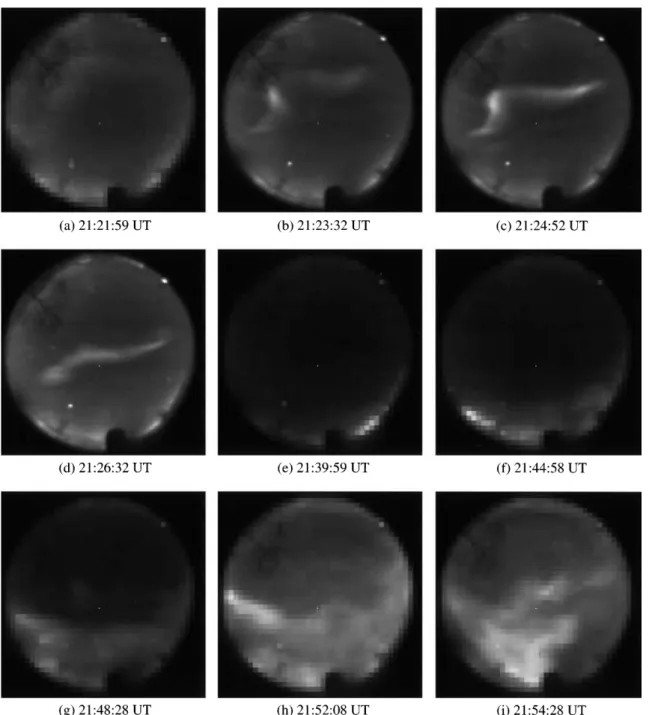
Figure 9 shows an accompanying sequence of all-sky camera pictures taken during the substorm. Tromsø, the
Fig. 7. EISCAT data for the interval 2120—2230 UT (7 March 1991). All panels show their data colour-coded as a function of altitude and UT for the field-aligned radar beam. The first panel (log10ne, mea-sured in m~3) incorporates multipulse data (90—150 km) at 1-min resolution and long pulse data (150—570 km) at 10-s resolution. The subsequent panels show electron temperature, ¹e (K), ion
temper-ature, ¹i (K), the temperature ratio ¹e/¹i, the field-aligned ion bulk flow velocity (m s~1) and the field-aligned ion flux (in units of 1012 m~2 s~1). The data in the narrow panels comes from the long pulse data alone (150—570 km) while panel 1 includes multipulse data (90—150 km). The left-hand colour key in panel 1 applies to the multipulse data and the right-hand colour key to the long pulse data
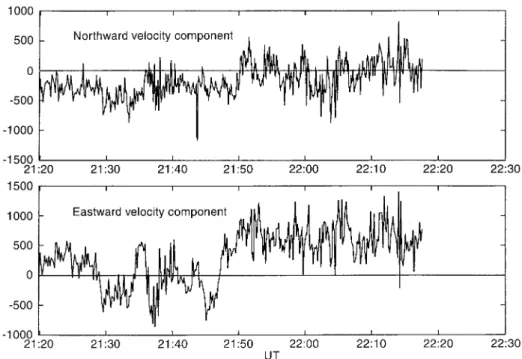
Fig. 8. Field-perpendicular convection velocities seen by EISCAT (as deduced by the tristatic radar technique). No data is available between 2217 and 2230 UT
observation site, is at the centre of each plate. At 2122 UT a faint, magnetically east-west aligned arc appeared to the north of Tromsø (Fig.9a), developing a kink by 2123 30 UT (Fig. 9b). As this arc moved southwards (Fig. 9c, d), the kink gradually straightened out and the arc was fading as it passed through the EISCAT beam at approximately 2127 UT. As it did so, it caused the arc signatures in the EISCAT data — panel 6, Fig. 7, for example, shows the clear upflux of ionospheric plasma associated with it. The arc over Tromsø finally faded by 2129 UT. At 2140 UT (Fig. 9e), shortly after onset, the poleward edge of the bulge brightened and moved northwards, eventually en-gulfing the scattering volume and causing the expansion phase signatures in the EISCAT data (Fig. 7).
3 Discussion
We wish to consider whether O` ions ejected in the upflow that was associated with the southward-drifting pre-onset arc could have appeared in the O` injections measured by CRRES, or whether these energetic ions came from the cleft ion fountain on the dayside. South-ward convection (Fig. 8) would then have carried the flux tube equatorwards until it arrived at the ionospheric onset location. Consider a nightside flux tube which crosses the Earth’s equatorial plane at about 10 RE, which we take to be the approximate onset location. Ions ejected from the topside ionosphere must travel approximately 15 RE along the flux tube before reaching the central plasma sheet. To make an order-of-magnitude estimate of the flight time of O` ions along the flux tube, let us consider the ions in question to be weakly accelerated in the top-side ionosphere and have an energy of 25 eV until they reach a distance of 1 RE along the flux tube, whereupon they are accelerated to about 1 keV, becoming an ion
beam. Using simple considerations, one arrives at a flight time of approximately 15 min. If we reduce the assumed energy of the O` below 1 RE to 5 eV, we increase the travel time to approximately 21 min.
For ions ejected via the arc to have entered the onset region and there to be energised (so as to be detected by CRRES), the foot of the flux tube on to which they are frozen must have reached the ionospheric location of onset — namely the bright auroral bulge visible to the very south of the all-sky-camera field of view — by the time onset occurred. Note that a flux tube moves with the plasma velocity, not the arc velocity, and that the arc may, in fact, move through the background plasma (Haerendel
et al., 1993; Gazey et al., 1995). The all-sky camera
sub-tends an angle of about 150°. Elevation can be measured off the images linearly over this range. At an emission height of about 120 km, therefore, the field of view has a span of about 900 km. The southward velocity of the background plasma before the arc entered the beam was about 250 m s~1 and after it had passed through the beam about 500 m s~1 (we cannot tell whether the flow speed differed greatly from these values when the arc was away from the EISCAT beam, but assume that they do not). At the first of these two speeds, the foot of the flux tube would have moved about 350 km (\3.1° invariant latitude) and for the second speed about 475 km (\4.2° invariant lati-tude) in the F region between the arc’s appearance to the north of Tromsø and the arrival of ejected O` ions in the plasma sheet. Since the distance in the ionosphere between the place where the arc appeared and the location of the onset bulge is 450—500 km, it is in either case feasible (to the accuracy of this calculation), that southward convec-tive flow was fast enough to carry the O` ejected by the arc into the onset region, i.e. the southward-drifting arc described here would have been in a suitable location to act as a source of the O` seen at onset.
Fig. 9. A sequence of all-sky camera images showing the motion of arcs in the growth and expansion phases of the substorm. The plates are geographically aligned, with north at the top and east to the
right. The mosaic effect on some of the pictures is due to the dynamic resolution adopted to solve data storage problems
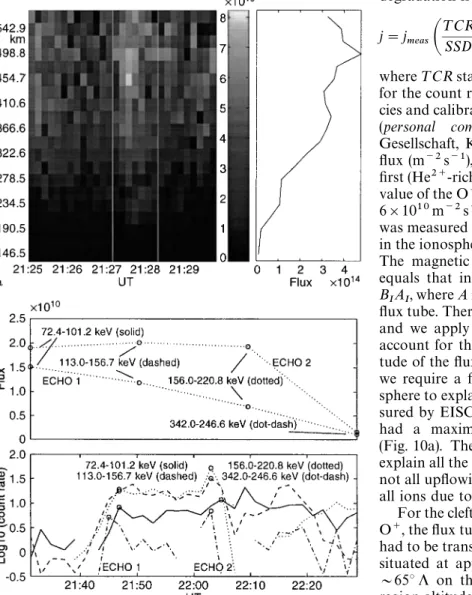
Figure 10a shows the flux of the ionospheric ions in the upflow event measured by EISCAT at 2127 UT as a func-tion of UT and altitude. The left-hand panel shows ion flux at approximately 10-s resolution. The arc is clearly visible and delineated by two white lines. The right-hand panel shows the altitude profile of flux integrated over this interval. The flux reaches a maximum value of 4.77] 1014 m~2 s~1 at about 500 km. The fact that no asymp-totic value is reached with increasing altitude may mean that there is an upwelling at F-region altitudes after which some O` sinks back down into the ionosphere again
(Lockwood, 1982), but note that the radar is measuring a net upflux above 300 km. We have also calculated the flux of high-energy O` along each of the two major drift echoes measured by MICS for comparison, as illustrated in Fig. 10b, whose first panel shows 2-min (4-spin) averaged count rates for energy channels covering 72.4—101.2 keV, 113.0—156.7 keV, 175.4—246.6 keV and 275.4—382.0 keV, and whose second panel gives the cor-rected O` flux in each of these four energy ranges and for each of the two drift echoes considered. Converting the MICS differential count rates to flux values is acheived
Fig. 10. a The upward flux of ionospheric ions, as measured by EISCAT during transition of the arc through the EISCAT beam at about 2127 UT. The left-hand panel shows flux (ne]vE) as a function
of altitude and UT, with the interval containing the arc bounded by two white lines. Immediately to its right is a scale showing flux values. The right-hand panel shows the altitude profile of flux integ-rated over this time interval (roughly 2127—2128) spanned by the two white lines. b O`-ion flux measured by MICS during the two primary injections (echos 1 and 2) that are visible in Fig. 5. The
bottom panel shows the uncorrected count rates (120-s averages) in
four energy ranges selected by averaging over a number of the available 32 energy steps. The circles represent the points which lie along the dispersed echo. These are used in the calculation of the actual flux which is shown in the top panel
using the equation:
j"dJ dE"
C G ·DE · g
where j is the differential number flux in cm~2 s~1 sr~1 keV~1, C is the measured count rate, G is the instru-ment’s geometric factor,DE is the respective energy band andg is the efficiency of the sensor. The correct j for sensor
degradation is thus: j"jmeas
A
¹SSDCRB
calibration ·A
¹CR SSDB
measuredwhere ¹CR stands for the total count rate and SSD stands for the count rate at the solid-state detector. The efficien-cies and calibration values are available in tabulated form (personal communication, G. Kettmann, Copernicus-Gesellschaft, Katlenburg-Lindau). The value of the O` flux (m~2 s~1), summed over all four energy bins, in the first (He2`-rich) injection was 3.5]1010 m~2 s~1, and the value of the O` flux in the second (O`-rich) injection was 6]1010 m~2 s~1. The strength of the field at CRRES, BC, was measured to be 140 nT, while the strength of the field in the ionosphere, BI, is taken to be constant at 50000 nT. The magnetic flux in the flux tube at CRRES, BCAC, equals that in the ionosphere end of the tube, namely
BIAI, where A refers to the local cross-sectional area of the
flux tube. Therefore the ratio of the areas, AC/AI"BI/BC, and we apply a mapping factor of 50000/140K360 to account for the increasing cross-sectional area with alti-tude of the flux tube between the Earth and CRRES, i.e. we require a flux of 1.25]1013 m~2 s~1 from the iono-sphere to explain the injection signature. The upflux mea-sured by EISCAT while the arc was in the radar’s beam had a maximum value of about 4.77]1014 m~2 s~1 (Fig. 10a). The ionospheric O` outflux is adequate to explain all the ions seen by CRRES, with the proviso that not all upflowing ions will escape and MICS does not see all ions due to its restricted energy coverage.
For the cleft ion fountain to have been the source of the O`, the flux tube on which they were situated would have had to be transported over the polar cap. The polar cap is situated at approximately \80° " on the dayside, and \65° " on the nightside, such that its diameter at F-region altitudes is approximately 4000 km. Given a field-perpendicular plasma velocity of the order of 0.5 km s~1, the time required for cleft-ion fountain O` to reach the onset region is well over an hour.
We would expect both injections to have taken place within the substorm current wedge. In the injection modelling, the first, He2`-rich injection is put at 2143 UT (2234 MLT), roughly 30 min away to the west of EISCAT in MLT and still within the all-sky camera’s field of view, since this time difference corresponds to about 430 km at ionospheric altitudes. At 2143 UT, the western end of the electrojet was at 352°E (geographic) and the injection took a further 2 min to reach CRRES, whose northern magnetic footprint was at geographic longitude 340°E. It therefore seems likely that this injection orig-inated close to the western end of the substorm electrojet. The second, O`-rich injection is placed at 2200 UT and 2300 MLT, i.e. close to EISCAT’s MLT and within the current wedge.
4 Conclusions
Due to CRRES’ favourable location with respect to EIS-CAT, we are able to suggest a link between EISCAT
measurements of oxygen outflow and CRRES measure-ments of oxygen injections at substorm onset. The injec-tions that have been modelled in this paper form a rela-tively unusual double injection — He2` followed by O`
— of the type recently revealed by CRRES data (Grande et al., 1992). It appears that the southward-drifting pre-onset
arc visible near Tromsø could well have been a source of O` particles observed by CRRES in the particle injections at onset.
We do not completely rule out the cleft ion fountain as a source of O`, since the growth phase of this substorm lasted for over an hour. The arrival of patches of density in the nightside ionosphere at about the time of onset might mean that cleft-ion-fountain ions ejected upwards at the start of the growth phase reached the onset region in the magnetosphere by the time of onset. However, for O` ions from the cleft ion fountain to have had access to the onset region, there would have had to have been reconnection at the distant neutral line prior to onset. Growth phase reconnection in the tail is not a requirement for the south-ward-drifting arc source, which was on closed field lines, so these ions would have had direct access to the onset region, which was also on closed field lines (see summary by Kennel, 1992).
Acknowledgements. The authors wish to thank Ron Lepping of the
Goddard Space Flight Center for supplying IMP 8 data via the World Data Centre C1 at R.A.L., B. Wilken (PI for MICS) and Boerre for the Tromsø magnetometer data and the director and staff of the EISCAT scientific association. EISCAT is supported by the Science and Engineering Research Council (U.K.), Norges Almen-vitenskapelige Forskningsrat d (Norway), the Naturvetenskapalige Forskningsrat d (Sweden), the Suomen Akatemi (Finland), the Max-Planck Gesellschaft (Germany), and the Centre National de la Recherche Scientifique (France). R.A.L was in receipt of a USAF grant no. AFOSR850237 for MICS. This research was supported by the U.K. Particle Physics and Astronomy Research Council (PPARC).
Topical Editor D. Alcayde´ thanks D. Delcourt and another referee for their help in evaluating this paper.
References
Baker, D. N., E. W. Hones Jr., D. T. Young, and J. Birn, The possible role of ionospheric oxygen in the initiation and development of plasma sheet instabilities, Geophys. Res. ¸ett., 9, 1337—1340, 1982.
Bame, S. J., J. R. Ashridge, A. J. Hundhausen, and M. D. Montgomery, Solar-wind ions: 58Fe8` to 56Fe12`, 28Si7`, 28Si8`, 28Si9`, 16O6`, J. Geophys. Res., 75, 6360—6365, 1970. Banks, P. M., and T. E. Holzer, High-latitude plasma transport,
J. Geophys. Res., 74, 6317—6332, 1969.
Bu¨chner, J. B., and L. M. Zelenyi, Chaotisation of the electron motion as the cause of an internal magnetotail instability and substorm onset, J. Geophys. Res., 92, 13456—13466, 1987. Chandler, M. O., Observations of polar ion outflows, J. Geophys.
Res., 96, 1421—1428, 1991.
Chandler, M. O., Observations of downward-moving O` in the polar topside ionosphere, J. Geophys. Res., 100, 5795—5800, 1995.
Chappell, C. R., Initial observations of thermal plasma composition and energetics from Dynamics Explorer I, Geophys. Res. ¸ett., 9, 929—932, 1982.
Cladis, J. B., and W. E. Francis, Distribution in magnetotail of O` ions from cusp/cleft ionosphere: A possible substorm trigger,
J. Geophys. Res., 97, 123—130, 1992.
Collin, H. L., R. D. Sharp, E. G. Shelley, and R. G. Johnson, Some general characteristics of upflowing ion beams over the auroral zone and their relation to auroral electrons, J. Geophys. Res., 86, 6820—6826, 1981.
Daglis, I. A., E. T. Sarris, and G. Kremser, Ionospheric contribution to the cross-tail enhancement during the substorm growth phase,
J. Atmos. ¹err.Phys., 96, 1091—1098, 1991.
Daglis, I. A., S. Livi, E. T. Sarris, and B. Wilken, Energy density of ionospheric and solar-wind-origin ions in the near-earth mag-netotail during substorms, J. Geophys. Res., 99, 5691—5703, 1994. Elphinstone, R. D., J. S. Murphree, and D. J. Hearn, VIKING observations of the UV dayside aurora and their relationship to DMSP particle boundary definitions, Ann. Geophysicae, 10, 815—826, 1991.
Frank, L. A., K. L. Ackerson, and D. N. Yeager, Observations of atomic oxygen (O`) in the earth’s magnetotail, J. Geophys. Res., 82, 129—134, 1977.
Gazey, N. G. J., M. Lockwood, P. N. Smith, S. A. Coles, R. J. Bunting, M. Lester, A. D. Aylward, T. K. Yeoman, and H. Lu~ hr, The development of substorm cross-tail current disruption as seen from the ground, J. Geophys. Res., 100, 9633—9648, 1995. Ghielmetti, A. G., R. G. Johnson, R. D. Sharp, and E. G. Shelley, The
latitudinal, diurnal, and altitudinal distributions of upward-flow-ing energetic ions of ionospheric origin, Geophys. Res. ¸ett., 5, 59—62, 1979.
Gorney, D. J., A. Clarke, D. Croley, J. Fennell, J. Luhmann, and P. Mizera, The distribution of ion beams and conics below 8000 km, J. Geophys. Res., 86, 83—89, 1981.
Grande, M., C. H. Perry, D. S. Hall, B. Wilken, S. Livi, F. Søøraas, and J. F. Fennell, Composition signatures of substorm injections, in Substorms 1, Proceedings of the 1st International Conference on
Substorms, ICS-1, ESA SP-335, 485—490, 1992.
Haerendel, G., S. Buchert, C. La Hoz, B. Raaf, and E. Rieger, On the proper motion of auroral arcs, J. Geophys. Res., 98, 6087—6099, 1993.
Johnson, R. G., Energetic ion composition in the Earth’s magneto-sphere, Rev. Geophys. Space Phys., 17, 696—705, 1979.
Jones, G. O. L., P. J. S. Williams, K. J. Winser, M. Lockwood, and K. Suvanto, Large plasma velocities along the magnetic field line in the auroral zone, Nature, 336, 231—232, 1988.
Keating, J. G., K. J. Winser, M. Lockwood, F. J. Mulligan, and D. B. Doyle, A statistical study of large field-aligned flows of thermal ions at high latitudes, Planet. Space Sci., 38, 1187—1202, 1990 Kennel, C. F., The Kiruna conjecture, the strong version, in
Sub-storms 1, Proceedings of the 1st International Conference on Substorms, ICS-1, ESASP-335, 99—109, 1992.
Kintner, P. M., M. C. Kelley, A. G. Sharp, A. G. Ghielmetti, C. Temerin, C. Cattell, P. F. Mizera, and J. F. Fennell, Simulta-neous observations of energetic (keV) upstreaming and electro-static hydrogen ion-cyclotron waves, J. Geophys. Res., 84, 7201, 1979.
Klumpar, D. M., Traversely accelerated ions, an ionospheric source of hot magnetospheric ions, J. Geophys. Res., 84, 4229—4237, 1979. Lockwood, M., Thermal ion flows in the topside auroral ionosphere
and the effects of low-latitude, transverse acceleration, Planet.
Space Sci., 30, 595—609, 1982.
Lockwood, M., Large-scale fields and flows in the magnetosphere-ionosphere system, Surv. Geophys., 16, 389—441, 1995.
Lockwood, M., and H. C. Carlson Jr., Production of polar-cap electron density patches by transient magnetopause reconnec-tion, Geophys. Res. ¸ett., 19, 1731—1734, 1992.
Lockwood, M., J. H. Waite, T. E. Moore, J. F. E. Johnson, and C. R. Chappell, A new source of suprathermal O` near the dayside polar-cap boundary, J. Geophys. Res., 90, 4099—4116, 1985a. Lockwood, M., M. O. Chandler, J. L. Horwitz, J. H. Waite, T. E.
Moore, and C. R. Chappell, The Cleft Ion Fountain, J. Geophys.
Res., 90, 9736—9748, 1985b.
Lopez, R. E., H. E. J. Koskinen, T. Pulkkinen, T. Bo~ singer, R. W. McEntire, and T. A. Potemra, Simultaneous observation of the poleward expansion of substorm electrojet activity and the tail-ward expansion of current sheet disruption in the near-earth magnetotail, J. Geophys. Res., 98, 9285—9295, 1993.
Lyons, L. R., and D. J. Williams, Quantitative aspects of
magneto-spheric physics, D. Reidel, Dordrecht, 1984.
Moore, T. E., J. H. Waite, M. Lockwood, M. O. Chandler, C. R. Chappell, M. Sigiura, D. R. Weimer, and W. K. Peterson, Upwell-ing O` ions, a case study. Poster paper, Fall AGU meeting (see
EOS ¹ransactions of the AGº, 65, 1056), 1984.
Murphree, J. S., R. D. Elphinstone, M. G. Henderson, L. L. Cogger, and D. J. Hearn, Interpretation of optical substorm onset obser-vations, J. Atmos. ¹err. Phys., 55, 1159—1170, 1993.
Orr, D., and M. Craymonson, The location of substorms using mid-latitude magnetometer arrays, in Substorms 2, Proceedings of
the 2nd International Conference on Substorms, ICS-2, 435—438,
1994.
Prange, R., Energetic (keV) ions of ionospheric origin in the magnetosphere, a review, Ann. Geophysicae, 34, 187—213, 1978.
Samson, J. C., L. R. Lyons, P. T. Newell, F. Creutzberg, and B. Xu, Proton aurora and substorm intensifications, Geophys. Res. ¸ett., 19, 2167—2170, 1992a.
Samson, J. C., D. D. Wallis, T. J. Hughes, F. Creutzberg, J. M. Ruohoniemi, and R. A. Greenwald, Substorm intensifications and field-line resonances in the nightside magnetosphere, J. Geophys.
Res., 97, 8495—8518, 1992b.
Shelley, E. G., W. K. Peterson, A. G. Ghielmetti, and J. Geiss, The polar ionosphere as a source of energetic magnetospheric plasma, Geophys. Res. ¸ett., 9, 941—945, 1982.
Wahlund, J.-E., H. Opgenoorth, I. Ha~ ggstro~m, K. J. Winser, and G. O. L. Jones, EISCAT observations of topside ionospheric outflows during auroral activity, revisited, J. Geophys. Res., 97, 3019—3035, 1992.
Waite, J. H., T. Nagai, J. F. E. Johnson, C. R. Chappell, J. L. Burch, T. L. Killeen, P. B. Hays, G. R. Carignan, W. K. Peterson, and E. G. Shelley, Escape of suprathermal O` ions in the polar cap, J.
Geophys. Res., 90, 1619—1630, 1985.
Wilken, B., W. Weiss, G. Kremser, H. Sommer, S. Livi, D. Hall, M. Grande, K. Slater, J. F. Fennell, R. Koga, D. Chenette, and N. Katz, The Magnetospheric Ion Composition Spectrometer MICS onboard the Combined Release and Radiation Effects Satellite (CRRES), J. Spacecr. Rockets, 29, 585—591, 1992. Winser, K. J., G. O. L. Jones, P. J. S. Williams, and M. Lockwood,
Observations of large field-aligned flows of thermal plasma in the auroral ionosphere, Adv. Space Res., 9, 57—63, 1989.
Yau, A. W., B. A. Whalen, W. K. Peterson, and E. G. Shelley, Distribution of upflowing ionospheric ions in the high-latitude polar cap and auroral ionosphere, J. Geophys. Res., 89, 5507— 5522, 1984.
Yeoman, T. Y., D. K. Milling, and D. Orr, Pi2 pulsation polarization patterns on the U.K. Sub-Auroral Magnetometer Network (SAMNET), Planet. Space Sci., 38, 589, 1990.
This article was processed by the author using the LATEX style file
cljour2 from Springer-Verlag.