HAL Id: hal-00298431
https://hal.archives-ouvertes.fr/hal-00298431
Submitted on 16 Oct 2006HAL is a multi-disciplinary open access
archive for the deposit and dissemination of sci-entific research documents, whether they are pub-lished or not. The documents may come from teaching and research institutions in France or abroad, or from public or private research centers.
L’archive ouverte pluridisciplinaire HAL, est destinée au dépôt et à la diffusion de documents scientifiques de niveau recherche, publiés ou non, émanant des établissements d’enseignement et de recherche français ou étrangers, des laboratoires publics ou privés.
Atmospheric forcing of DSOW salinity
J. Holfort, T. Albrecht
To cite this version:
J. Holfort, T. Albrecht. Atmospheric forcing of DSOW salinity. Ocean Science Discussions, European Geosciences Union, 2006, 3 (5), pp.1661-1680. �hal-00298431�
OSD
3, 1661–1680, 2006
DSOW salinity forcing
J. Holfort and T. Albrecht
Title Page Abstract Introduction Conclusions References Tables Figures J I J I Back Close Full Screen / Esc
Printer-friendly Version Interactive Discussion
EGU Ocean Sci. Discuss., 3, 1661–1680, 2006
www.ocean-sci-discuss.net/3/1661/2006/ © Author(s) 2006. This work is licensed under a Creative Commons License.
Ocean Science Discussions
Papers published in Ocean Science Discussions are under open-access review for the journal Ocean Science
Atmospheric forcing of DSOW salinity
J. Holfort1,*and T. Albrecht2 1
Institut f ¨ur Meereskunde der Universit ¨at Hamburg, Hamburg, Germany 2
Deutsche Marine, Zerst ¨orerflottille, Wilhelmshaven, Germany *
now at: BSH, Rostock, Germany
Received: 10 July 2006 – Accepted: 6 September 2006 – Published: 16 October 2006 Correspondence to: J. Holfort (juergen@holfort.org)
OSD
3, 1661–1680, 2006
DSOW salinity forcing
J. Holfort and T. Albrecht
Title Page Abstract Introduction Conclusions References Tables Figures J I J I Back Close Full Screen / Esc
Printer-friendly Version Interactive Discussion
EGU
Abstract
The temporal evolution of the characteristics of Denmark Strait Overflow Water (DSOW) is reconstructed using hydrographic data and compared with possible atmo-spheric forcing mechanisms. It is concluded that the main factor influencing the DSOW characteristics at a time scale of one to several years is the difference in mean sea level 5
pressure across, respective wind along Denmark Strait. The main process which leads to salinity changes in the DSOW is therefore changing percentages of the different wa-ter masses involved in the DSOW formation and not the changes of the characwa-teristics of these water masses.
1 Introduction
10
The densest and therefore deepest northern component of the global thermohaline cir-culation is the Denmark Strait Overflow Water (DSOW). Different water masses, formed outside or within the Greenland-Island-Norwegian (GIN) seas, are carried southward towards Denmark Strait within the East Greenland Current (EGC). These water masses contribute to the formation of DSOW, which is found south of Denmark Strait flowing 15
along the continental slope southwards into the deep North Atlantic. Figure1 shows a sketch of the circulation and water masses involved in the formation of DSOW and Rudels et al. (2002) give an overview of the different water masses and processes involved north of Denmark Strait. The overflow itself has been extensively studied; Saunders(2001) gives a short overview for the WOCE (World Ocean Circulation Ex-20
periment) and pre-WOCE era, many studies were conducted during the VEINS (Vari-ability of exchanges in the Nordic Seas) and ASOF (Arctic-Subarctic Ocean Fluxes) programs.
The North Atlantic Oscillation (NAO) is the most prominent and recurrent pattern of atmospheric variability in the North Atlantic (Hurrel et al.,2003) and it is thought that 25
OSD
3, 1661–1680, 2006
DSOW salinity forcing
J. Holfort and T. Albrecht
Title Page Abstract Introduction Conclusions References Tables Figures J I J I Back Close Full Screen / Esc
Printer-friendly Version Interactive Discussion
EGU 1996). Over the last four decades the whole deep North Atlantic Ocean showed a rapid
freshening (Dickson et al.,2002) which can be linked to the increase from a low NAO-index in the 1960s to high NAO-NAO-index in the 1990s. The purpose of this paper is to show, that on time scales of order one to two years the water mass characteristics of the DSOW are closely related to the atmospheric forcing. But it is not the large scale 5
NAO but more local forcing in and just north of Denmark Strait. This means that on this time scales changes in the DSOW characteristics are not governed by changes in the source water masses composition but only by the mixing ratio of the different source water masses forming the DSOW.
2 Data
10
The data used is historical data from different sources and recent data from several cruises. Sources of the historical data used are the World Ocean Database (Conkright et al., 1998, data publicly available from ICES including the VEINS data collection; available fromhttp://www.ices.dk), and data from WOCE (WOCE Data Products Com-mittee,2002). Most of the recent data come from yearly cruises done from the Institut 15
f ¨ur Meereskunde Hamburg, which follow the station pattern from VEINS. Temporal res-olution is inadequate in the 1970s and 1980s. There are more data between 1957 and 1967, but these data is bottle data with restricted vertical resolution and the inter-polation error to a certain density is larger then with CTD data. Our main focus will therefore lie on the time from 1990 onwards. We did not use the temperature/salinity 20
data from the current meters of the Angmasalik mooring array, as the measurement error of the Aanderaa current meters in conductivity are to large. Atmospheric data used are monthly means from the NCEP reanalysis (taken fromftp://ftp.cdc.noaa.gov in July 2003) and daily data from ECMWF ERA-40 (obtained from the ECMWF data server in May 2004), which were averaged to monthly means.
OSD
3, 1661–1680, 2006
DSOW salinity forcing
J. Holfort and T. Albrecht
Title Page Abstract Introduction Conclusions References Tables Figures J I J I Back Close Full Screen / Esc
Printer-friendly Version Interactive Discussion
EGU
3 Variability of DSOW characteristics
To construct our main time series we first took all available data from an elliptical region along the spreading path of the DSOW along the Greenland continental shelf (Fig.2) and determined the temperature and salinity on isopycnals in the DSOW range for each individual station. We used different σ2(density of the water if brought adiabatically to 5
2000 dbar) isopycnals with σ2>37.04 kg m−3. We will mainly present data from the single isopycnal σ2=37.12 kg m−3. The results did not depend much on the choice of isopycnal, but at higher densities data become sparse and at lower densities the DSOW signal is mixed with the signal of the entrained water. Waters with σ2>37.04 kg m−3can also be found in other water masses then DSOW, to exclude these data we restricted 10
the region in the vertical to the pressure range 300–3500 dbar and data within 400 dbar of the bottom.
In the northernmost part of our region, the actual DSOW is formed by mixing in Denmark Strait (Rudels et al., 2002), this leads to large variations in the salinity on isopycnals north of 64.5◦N (Fig.3) and therefore we exclude the northernmost part in 15
following calculations. Within the remaining geographical extent, the southward flowing DSOW mixes with surrounding waters and becomes saltier (Fig.3). A linear fit through all the data (for pressures larger then 1500 dbar and irrespective of time) shows that the mean increase in salinity is about 0.003 PSU per degree latitude. This mean south-ward gradient was used to correct for mixing effects and to reference all salinities to 20
a latitude of 60◦N. The DSOW also needs time to flow southwards, the water found at 64.5◦N at one time will be found somewhat later further south. We referenced all time to a latitude of 60◦N by using a spreading rate of 280 days per 5◦ of latitude. This corresponds to spreading velocity of 2.3 cm/s north-south, and taking also into account the longitudinal displacement of about 3.4 cm/s along the DSOW path. This time cor-25
rection also leads to a better temporal resolution, as a summer cruise to the whole region leads to temporal coverage of several months. Increasing the spreading speed to 120 days per 5◦ of latitude gives poorer temporal resolution, but does not change
OSD
3, 1661–1680, 2006
DSOW salinity forcing
J. Holfort and T. Albrecht
Title Page Abstract Introduction Conclusions References Tables Figures J I J I Back Close Full Screen / Esc
Printer-friendly Version Interactive Discussion
EGU considerably the smoothed temporal evolution of the salinity. The mean current speed
of the DSOW at 63◦N is about 20 to 30 cm/s (Dickson et al.,1998) and as signal prop-agation in general is smaller then mean current speed, the used propprop-agation speed is of the right order of magnitude.
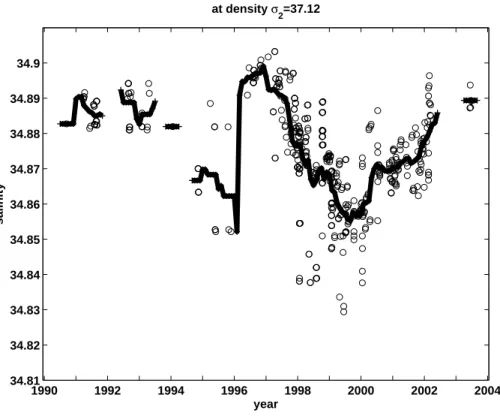
The resulting temporal evolution (Fig. 4) shows that in the beginning of the 1990s 5
salinity was about 34.885, then dropped to very low values of 34.85 in 1995. Then there is a sharp rise to a maximum of 34.895 in 1996. The salinity then decreases gradually to a minimum salinity of 34.86 in 1999 and then increased until 2003 reaching salinities around 34.89 and then dropped again to values around 34.865 in 2004.
To estimate the errors introduced by the mixing and spreading corrections we also 10
determined the temporal evolution without these corrections using a smaller region near the southern tip of Greenland. This region as a good data coverage due to WOCE (section A1e), VEINS and ASOF (section 6) and other historic data (Fig.5). The data is biased toward summer data, but as the very short term fluctuations at the source are low pass filtered due to mixing along the approximate 1000 km long path from the 15
Denmark Strait to the chosen region, the single measurements in time are representa-tive for a longer time period. The temporal evolution of the salinity found in this smaller region (Fig.6) is similar to the one found in the larger region, only based on fewer data and with a coarser temporal resolution.
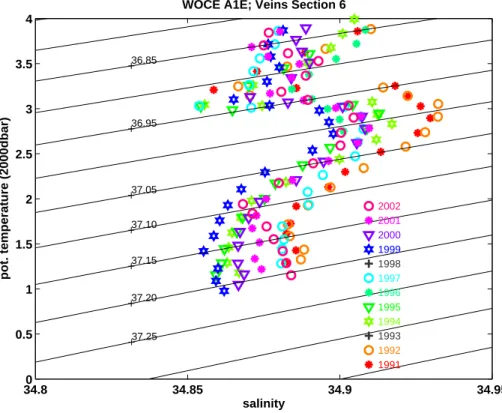
The data from selected summer cruises in this smaller region was used to construct 20
mean potential temperature-salinity diagrams. The potential temperature (Θ) was ref-erenced to 2000 dbar. All temperature and salinity values of one cruise within a σ2 interval (±0.02) kg m−3 around certain σ2values were averaged, the resultingΘ-S dia-gram is shown in Fig.7. The temporal signal is very similar within the density range of the DSOW, therefore the temporal evolution at σ2=37.12 kg m−3 as shown elsewhere 25
in this article is representative for the whole DSOW density range. High salinities within the DSOW are found in 1991, 1992, 1997 and 2002 and low salinities in 1994, 1995 and 1999.
OSD
3, 1661–1680, 2006
DSOW salinity forcing
J. Holfort and T. Albrecht
Title Page Abstract Introduction Conclusions References Tables Figures J I J I Back Close Full Screen / Esc
Printer-friendly Version Interactive Discussion
EGU
4 Atmospheric forcing
Changes in the characteristics of the DSOW can result from changes in each com-ponent and process leading to the formation of DSOW as depicted by Rudels et al. (2002). Ultimatly many of these changes are forced by the atmosphere. To identify how the atmosphere induces changes in the composition of the DSOW we made time 5
lag correlations of our time series of DSOW salinity with several atmospheric parame-ters from the NCEP and ERA40 datasets. As we are interested in atmospheric changes that induce oceanic changes, we restricted the analysis to time lags where the atmo-spheric signals precedes the oceanic one. As our oceanic time series is smoothed, and also the oceanic mixing in and shortly after Denmark Strait acts as low pass filter, 10
we smoothed the atmospheric data with a 3 month running mean.
Correlating a short and gappy time series with many different parameters at many places with different time lags gives several correlations with a high correlation coeffi-cent. But high correlation coefficents do not imply neccesarily a direct coupling. For once it can be pure chance. Or there is indirect coupling, if A is the cause for B and C, 15
the correlation coefficent between B and C can be large, without B causing C or vice versa. Therefore a large correlation coefficent is only one requirement. A second is a possible physical coupling process. Still another that the time lag is large enough, so that the signal has time enough to travel in the ocean from the geographic location of the found larger correlation coefficent to our defined DSOW region south of Denmark 20
Strait.
We did correlations directly with different variables (mean sea level pressure, wind, temperature, etc) of the NCEP and ERA40 reanalysis, but also with EOF and rotated EOF analysis of these variables. Meaningful correlations found (Fig.8) were with the wind west and north of Island, respective the difference of the mean sea level pressure 25
(mSLP) across Denmark Strait. The time lag of about 9 months results in a propagating signal speed of order several cm/s, similar to the propagation speed used previosly to correct the hydrographic measurements for the DSOW time series. Scaling the
OSD
3, 1661–1680, 2006
DSOW salinity forcing
J. Holfort and T. Albrecht
Title Page Abstract Introduction Conclusions References Tables Figures J I J I Back Close Full Screen / Esc
Printer-friendly Version Interactive Discussion
EGU atmospheric time series with a constant offset and factor to the DSOW salinity range
and applying a time offset the good correlation with the time series of the DSOW salinity can be seen directly (Fig. 9). Using this kind of linear regression with the pressure difference across Denmark Strait explains about 40% of the total variance of the DSOW salinity time series from 1990 onward.
5
A weaker southward wind along Denmark Strait leads to an increase in the DSOW salinity. A simple explanation of this behaviour could be that with weaker southwards winds less northern, low saline water flows towards Denmark Strait and more higher saline water of southern origin is present at Denmark Strait. This shift in the proportions of water masses involved in the formation of DSOW leads to a more saline DSOW. 10
There are also other ways to explain this behaviour. Weaker southward wind lead to a flattening of the border between low saline Polar Water (PW) and higher saline Return Atlantic Water (rAW), both coming from the north. This leads to a higher percentage of rAW compared to PW in the DSOW formation, increasing the resulting salinity. But with the data available to us it was not possible to pinpoint the process leading to the 15
observed behaviour.
In the end this still unknown dynamical process leads to changing amounts of the different water masses involved in the DSOW formation, and, following the DSOW recipe of (Rudels et al.,2002), it is the last stirring in and just north of Denmark Strait which sets the DSOW characteristics on time scales from months to several years. And 20
ultimatly the main factor is the wind along Denmark Strait.
5 Longer term changes
We saw that on shorter time scales the wind along Denmark Strait sets the value of the DSOW salinity. Extending the analysis to times before 1990, we see (Fig. 10) that the mean wind did not changed much, but salinity was much higher in the 1960s. 25
The general decrease in salinity over the last 40 years as been noted before (Dickson et al.,2002). And it is also clear that this decrease cannot be explained with changes
OSD
3, 1661–1680, 2006
DSOW salinity forcing
J. Holfort and T. Albrecht
Title Page Abstract Introduction Conclusions References Tables Figures J I J I Back Close Full Screen / Esc
Printer-friendly Version Interactive Discussion
EGU in the mSLP difference across, respective wind along Denmark Strait. The 1965–1970
signals could perhaps also be explained with the wind along Denmark Strait, but with the mean salinity being 0.065 higher in this period then in the 1990–2004 period. So the processes determing the shorter time changes are probably the same in this previous period as in the 1990–2004 period, but some other, longer term process changed the 5
mean salinity between 1965 and 1990.
One possible candidate are advective processes, as proposed by Dickson et al. (1999). A signal in the Atlantic Water flowing northward along the Norwegian coast leads to a signal in the rAW and this signal is propagated along Greenland within the EGC and finally into the DSOW. ButDickson et al.(1999) also explain the shorter term 10
changes with this advective process, while we saw that the shorter term changes are set in Denmark Strait. Taking into account all the mixing and entrainment processes between Fram Strait and Denmark Strait (Rudels et al.,2002), which work like a low pass filter, it is not very probable that shorter term fluctuations survive this journey. Due to the low pass filtering effect of oceanic mixing a large salinity jump in Fram Strait 15
will only lead to a more gradual change in Denmark Strait. But a longer term gradual increase in salinity could pass this system almost unhindered. So the advective way along the EGC is a possible candidate to explain the longer term changes in the DSOW salinity, although also other processes (e.g. advection from the south, changes in ice export) are possible.
20
6 Conclusions
For time scales up to a few years the salinity of the DSOW is determined by the wind along Denmark Strait. This leads to a certain predictability of the DSOW characteristics from atmospheric data of about several months.
Acknowledgements. We wish to thank all peoble involded in data aquisition, specially the crew
25
OSD
3, 1661–1680, 2006
DSOW salinity forcing
J. Holfort and T. Albrecht
Title Page Abstract Introduction Conclusions References Tables Figures J I J I Back Close Full Screen / Esc
Printer-friendly Version Interactive Discussion
EGU
References
Conkright, M. E., Levitus, S., Boyer, T. P., O’Brien, T., Stephens, C., Johnson, D., Stathoplos, L., Baranova, O., Antonov, J., Gelfeld, R., Burney, J., Rochester, J., and Forgy, C.: WORLD OCEAN DATABASE 1998, 1998. 1663
Dickson, R. R., Yashayaev, I., Meincke, J., Turrell, B., Dye, S., and Holfort, J.: Rapid freshening
5
of the deep North Atlantic Ocean over the past four decades, Nature, 416, 832–836, 2002.
1663,1667
Dickson, R. R., Lazier, J., Meincke, J., Rhines, P., and Swift, J.: Long-term coordinated changes in the convective activity of the North Atlantic, Progress in Oceanography, 38, 241–295, 1996.
1662
10
Dickson, R. R., Medler, K., and Read, J.: Current meter data report for Workpackage 1.4 Denmark Strait Overflow., available athttp://www.ices.dk/ocean/project/veins, 1998. 1665
Dickson, R. R., Meincke, J., Vassie, I., Jungclaus, J., and Østerhus, S.: Possible predictability in overflow from the Denmark Strait, Nature, 397, 243–246, 1999. 1668
Holfort, J.: FS Poseidon cruise 290 from St.Johns, Canada to Reykjavik, Island, June 6 to June
15
24, 2002, http://www.ifm.uni-hamburg.de/∼wwwro/cruises/Pos290/cruisereport.html, 2002.
1677
Hurrel, J. W., Kushnir, Y., Ottersen, G., and Visbek, M.: An overview of the North Atlantic Os-cillation., in: The North Atlantic Oscillation: climatic significance and environmental impact, edited by: Hurrel, J. W., Kushnir, Y., Ottersen, G., and Visbek, M., American Geophysical
20
Union, p. 1–36, 2003. 1662
Rudels, B. E. F., Meincke, J., Budeus, G., and Eriksson, P.: The Eastgreenland current and its contribution to the Denmark Strait Overflow., J. Mar. Sci., 59, 1133–1154, 2002. 1662,
1664,1666,1667,1668
Saunders, P.: The dense northern Overflows, in: Ocean circulation and climate, observing and
25
modelling the global ocean., edited by: Siedler, G., Church, J., and Gould, J., Academic Press, p. 712, 2001. 1662
Schott, F., Koltermann, K. P., Stramma, L., Sy, A., Zahn, R., and Zenk, W.: North Atlantic, cruise No. 39, 18 April–14 September 1997, available athttp://www.ifm-geomar.de/index.php?id= 1405, 1998. 1677
30
Schott, F., Meincke, J., Meinecke, G., Neuer, S., and Zenk, W.: North Atlantic 1999, Cruise No.45, 18 May–4 November 1999, available at http://www.ifm-geomar.de/index.php?id=
OSD
3, 1661–1680, 2006
DSOW salinity forcing
J. Holfort and T. Albrecht
Title Page Abstract Introduction Conclusions References Tables Figures J I J I Back Close Full Screen / Esc
Printer-friendly Version Interactive Discussion
EGU
1411, 2000. 1677
Schott, F., Fischer, J., Holfort, J., and Zenk, W.: North Atlantic, Cruise No.50, 7 May–12 August 2001, available athttp://www.ifm-geomar.de/index.php?id=1415, 2002. 1677
WOCE Data Products Committee: WOCE Global Data, Version 3.0., WOCE Report, 180/02, 2002. 1663
OSD
3, 1661–1680, 2006
DSOW salinity forcing
J. Holfort and T. Albrecht
Title Page Abstract Introduction Conclusions References Tables Figures J I J I Back Close Full Screen / Esc
Printer-friendly Version Interactive Discussion
EGU
Fig. 1. Sketch of the water masses of the East Greenland Current, which contribute to the formation of DSOW (AW= Atlantic Water, NAC = North Atlantic Current, WSC = West Spitzbergen Current, rAW= return Atlantic Water, AAW = Arctic Atlantic Water, PW= Polar Water, AIW= Arctic Intermediate Water).
OSD
3, 1661–1680, 2006
DSOW salinity forcing
J. Holfort and T. Albrecht
Title Page Abstract Introduction Conclusions References Tables Figures J I J I Back Close Full Screen / Esc
Printer-friendly Version Interactive Discussion EGU 50W 45W 40W 35W 30W 25W 20W 55N 60N 65N 70N
Fig. 2. Position of the hydrographic stations in the main region used in constructing the time
OSD
3, 1661–1680, 2006
DSOW salinity forcing
J. Holfort and T. Albrecht
Title Page Abstract Introduction Conclusions References Tables Figures J I J I Back Close Full Screen / Esc
Printer-friendly Version Interactive Discussion EGU 57N 58N 59N 60N 61N 62N 63N 64N 65N 66N 67N 34.5 34.55 34.6 34.65 34.7 34.75 34.8 34.85 34.9 34.95 35 S=34.881 + −0.0032*(lat− 60.0); Cor=−0.41 latitude salinity at density σ2=37.12
Fig. 3. Salinity at σ2=37.12 kg m−3 as a function of latitude. Data north of 64.5◦N (small crosses) were not used due to the large range of salinities. The line is a fit through all data south of 64.5◦N giving a mean salinity increase towards the south of 0.0032 per degree of latitude.
OSD
3, 1661–1680, 2006
DSOW salinity forcing
J. Holfort and T. Albrecht
Title Page Abstract Introduction Conclusions References Tables Figures J I J I Back Close Full Screen / Esc
Printer-friendly Version Interactive Discussion EGU 1990 1992 1994 1996 1998 2000 2002 2004 34.81 34.82 34.83 34.84 34.85 34.86 34.87 34.88 34.89 34.9 year salinity at density σ 2=37.12
Fig. 4. Time evolution of the DSOW salinity at σ2=37.12 kg m−3and reference latitude of 60◦N. Circles are data from individual hydrographic stations and the black line is the running mean through all data.
OSD
3, 1661–1680, 2006
DSOW salinity forcing
J. Holfort and T. Albrecht
Title Page Abstract Introduction Conclusions References Tables Figures J I J I Back Close Full Screen / Esc
Printer-friendly Version Interactive Discussion EGU 50°00’W 45°00’W 40°00’W 35°00’W 30°00’W 25°00’W 20°03’W 55°N 60°N 65°N 70°N
Fig. 5. Position of the hydrographic stations in the first region used in constructing the time series of DSOW characteristics.
OSD
3, 1661–1680, 2006
DSOW salinity forcing
J. Holfort and T. Albrecht
Title Page Abstract Introduction Conclusions References Tables Figures J I J I Back Close Full Screen / Esc
Printer-friendly Version Interactive Discussion EGU 1990 1992 1994 1996 1998 2000 2002 2004 34.82 34.83 34.84 34.85 34.86 34.87 34.88 34.89 34.9 34.91 34.92 year salinity at density σ 2=37.12
Fig. 6. Time evolution of the DSOW salinity near the southern tip of Greenland at
σ2=37.12 kg m−3. The red circles are data from individual hydrographic stations, the red line is the running mean through these data and the green line is the mean salinity of the main region.
OSD
3, 1661–1680, 2006
DSOW salinity forcing
J. Holfort and T. Albrecht
Title Page Abstract Introduction Conclusions References Tables Figures J I J I Back Close Full Screen / Esc
Printer-friendly Version Interactive Discussion EGU 34.80 34.85 34.9 34.95 0.5 1 1.5 2 2.5 3 3.5 4 salinity
pot. temperature (2000dbar)
37.25 37.20 37.15 37.10 37.05 36.95 36.85
WOCE A1E; Veins Section 6
1991 1992 1993 1994 1995 1996 1997 1998 1999 2000 2001 2002
Fig. 7. Diagram of mean potential temperature and salinity at VEINS sections 6 for individual
sections in different years. The means were calculated in 0.02 kg m−3σ
2-density intervals. The used sections come from the cruises Meteor 18 in 1991, Valdivia 129 in 1992, Meteor 30 in 1994, Valdivia 152 in 1995, Valdivia 161 in 1996, Meteor 39 in 1997 (Schott et al., 1998), Meteor 45/4 in 1999 (Schott et al.,2000), Poseidon 263 in 2000, Meteor 50/3 in 2001 (Schott et al.,2002) and Poseidon 290 in 2002 (Holfort,2002).
OSD
3, 1661–1680, 2006
DSOW salinity forcing
J. Holfort and T. Albrecht
Title Page Abstract Introduction Conclusions References Tables Figures J I J I Back Close Full Screen / Esc
Printer-friendly Version Interactive Discussion EGU −1 −0.8 −0.6 −0.4 −0.2 0 0.2 0.4 0.6 0.8 1 −0.2 − 0 −0.2 0.1 −0.3 0.2 −0.1 0 −0.4 0.3 −0.5 0.1 0.1 0 0 0.4 0.2 −0.6 0 0.3 0.1 0.5 0.3 0 0.3 0.4 −0.4 −0.1 0.2 −0.1 −0.1 0.1 0.1 0.2 −0.4 0 0.4 0.1 0 0.6 0.5 −0.1 0.2 −0.1 −0.5 0.1 0.1 0.2 0 0.2 −0.1 0 −0.2 −0.5 0.2 −0.3 0 0.1 −0.7 0.1 0.2 −0.2 −0.7 0.1 0.5 0.3 0.4 0 0.4 0.2 0 −0.3 0 0.2 0 0.2 0.2 0.2 0.1 longitude latitude
lag correlation at lag −3 months
−80 −60 −40 −20 0 20 30 35 40 45 50 55 60 65 70 75 80 85 (a) −1 −0.8 −0.6 −0.4 −0.2 0 0.2 0.4 0.6 0.8 1 −0.3 −0.2 −0.1 0 0.1 0.2 0.3 0.4 −0.3 0.2 0 0.1 0 0.2 0.3 0 0.2 0.1 −0.1 −0.1 0.5 0.1 0.4 0.1 −0.2 0.2 −0.1 −0.1 0.3 0.2 0.4 0.4 −0.1 −0.2 0.1 0 −0.1 0.2 −0.2 −0.1 0.1 0.3 0.3 −0.1 0 −0.1 0.2 0 0.1 0.4 −0.1 0.1 0.1 −0.2 −0.3 0.2 0.2 0. 0.2 0 −0.1 0 0.5 −0.4 0.5 −0.3 −0.2 0.3 0 0 0 −0.1 0 0 −0.2 −0.1 0.3 0.1 0.5 0.3 −0.2 −0.3 0 0.4 0.2 0.6 −0.1 0 0 −0.1 −0.4 −0.1 0.1 −0.4 longitude latitude
lag correlation at lag −2 months
−80 −60 −40 −20 0 20 30 35 40 45 50 55 60 65 70 75 80 85 (b) −1 −0.8 −0.6 −0.4 −0.2 0 0.2 0.4 0.6 0.8 1 − − −0.4 −0.3 −0.2 0 0.1 0.2 0.3 −0.1 0 0.4 0.1 0.1 0.1 0.2 0.5 0 −0.4 0 −0.1 0.1 0.3 −0.5 0.3 −0 0.1 −0.1 −0.2 0.6 −0.3 0.2 0 −0.2 −0.2 0.2 0.4 0.3 −0.1 0.3 0.4 0.3 0.2 0.4 −0.1 −0.2 −0.6 0 0.2 0.5 0.5 0.2 −0.1 0.2 0.6 −0.5 −0.3 0.3 0 0.1 0.2 0.3 0.3 −0.4 0.3 0.3 0.1 0.2 longitude latitude
lag correlation at lag −1 months
−80 −60 −40 −20 0 20 30 35 40 45 50 55 60 65 70 75 80 85 (c) −1 −0.8 −0.6 −0.4 −0.2 0 0.2 0.4 0.6 0.8 1 −0.5 −0.4 −0. −0.2 −0.1 0 −0.5 0.1 0.2 −0.4 −0.5 −0.4 −0.5 −0.3 −0.6 0.3 −0.6 −0.5 0.3 −0.5 −0.4 −0.3 longitude latitude
lag correlation at lag −2 months
−80 −60 −40 −20 0 20 30 35 40 45 50 55 60 65 70 75 80 85 (d)
Fig. 8. Correlation of monthly atmospheric data (smoothed using a 3 months running mean)
with the DSOW salinity:(a) with the meridional NCEP wind at a time lag of −3 months, (b) with
the meridional ERA40 wind at a time lag of −2 months,(c) with the zonal NCEP wind at a time
lag of −1 month and(d) with the difference of the NCEP mean sea level pressure (mSLP) and
OSD
3, 1661–1680, 2006
DSOW salinity forcing
J. Holfort and T. Albrecht
Title Page Abstract Introduction Conclusions References Tables Figures J I J I Back Close Full Screen / Esc
Printer-friendly Version Interactive Discussion EGU 1990 1992 1994 1996 1998 2000 2002 2004 34.83 34.84 34.85 34.86 34.87 34.88 34.89 34.9 year salinity φ=67.50N λ=−30.00E
Fig. 9. The time series of DSOW salinity (red) and the scaled difference of the mean sea level
OSD
3, 1661–1680, 2006
DSOW salinity forcing
J. Holfort and T. Albrecht
Title Page Abstract Introduction Conclusions References Tables Figures J I J I Back Close Full Screen / Esc
Printer-friendly Version Interactive Discussion EGU 1950 1955 1960 1965 1970 1975 1980 1985 1990 1995 2000 2005 34.78 34.8 34.82 34.84 34.86 34.88 34.9 34.92 34.94 year salinity φ=67.50N λ=−30.00E
Fig. 10. Salinity of individual stations at σ2=37.12 kg m−3 (grey circles) and a running mean through this data giving the time series of the DSOW salinity (red) and the scaled difference of the mean sea level pressure between 67.5◦N 30◦W and Island (cyan) including also data before 1990.