HAL Id: hal-00298218
https://hal.archives-ouvertes.fr/hal-00298218
Submitted on 25 Apr 2008HAL is a multi-disciplinary open access
archive for the deposit and dissemination of sci-entific research documents, whether they are pub-lished or not. The documents may come from teaching and research institutions in France or abroad, or from public or private research centers.
L’archive ouverte pluridisciplinaire HAL, est destinée au dépôt et à la diffusion de documents scientifiques de niveau recherche, publiés ou non, émanant des établissements d’enseignement et de recherche français ou étrangers, des laboratoires publics ou privés.
Amplification of obliquity forcing through mean-annual
and seasonal atmospheric feedbacks
S.-Y. Lee, C. J. Poulsen
To cite this version:
S.-Y. Lee, C. J. Poulsen. Amplification of obliquity forcing through mean-annual and seasonal atmo-spheric feedbacks. Climate of the Past Discussions, European Geosciences Union (EGU), 2008, 4 (2), pp.515-534. �hal-00298218�
CPD
4, 515–534, 2008
Snowfall response to obliquity forcing
S.-Y. Lee and C. J. Poulsen Title Page Abstract Introduction Conclusions References Tables Figures ◭ ◮ ◭ ◮ Back Close
Full Screen / Esc
Printer-friendly Version Interactive Discussion Clim. Past Discuss., 4, 515–534, 2008
www.clim-past-discuss.net/4/515/2008/
© Author(s) 2008. This work is distributed under the Creative Commons Attribution 3.0 License.
Climate of the Past Discussions
Climate of the Past Discussions is the access reviewed discussion forum of Climate of the Past
Amplification of obliquity forcing through
mean-annual and seasonal atmospheric
feedbacks
S.-Y. Lee and C. J. Poulsen
Department of Geological Sciences, University of Michigan, Ann Arbor, MI, USA Received: 17 March – Accepted: 28 March – Published: 25 April 2008
Correspondence to: S.-Y. Lee (shihyu@umich.edu)
CPD
4, 515–534, 2008
Snowfall response to obliquity forcing
S.-Y. Lee and C. J. Poulsen Title Page Abstract Introduction Conclusions References Tables Figures ◭ ◮ ◭ ◮ Back Close
Full Screen / Esc
Printer-friendly Version Interactive Discussion Abstract
Pleistocene benthic δ18O records exhibit strong spectral power at ∼41 kyr, indicating that global ice volume has been modulated by Earth’s axial tilt. This feature, and weak spectral power in the precessional band, has been attributed to the influence of obliq-uity on mean-annual and seasonal insolation gradients at high latitudes. In this study, 5
we use a coupled ocean-atmosphere general circulation model to quantify changes in continental snowfall associated with mean-annual and seasonal insolation forcing due to a change in obliquity. Our model results indicate that insolation changes associated with a decrease in obliquity amplify continental snowfall in two ways: (1) An increase in high-latitude winter insolation is enhanced through a low-cloud feedback, resulting in 10
colder air temperatures and increased snow precipitation. (2) An increase in the sum-mer insolation gradient enhances sumsum-mer eddy activity, increasing vapor transport to high-latitude regions. In our experiments, a decrease in obliquity leads to an annual snowfall increase of 25.0 cm; just over one-half of this response (14.1 cm) is attributed to seasonal changes in insolation. Our results indicate that the role of insolation gradi-15
ents is important in amplifying the relatively weak insolation forcing due to a change in obliquity. Nonetheless, the total snowfall response to obliquity is similar to that due to a shift in Earth’s precession, suggesting that obliquity forcing alone can not account for the spectral characteristics of the ice-volume record.
1 Introduction
20
It has long been known that the Quaternary global ice-volume record, archived in ben-thic δ18O, varies at orbital frequencies (Hays et al., 1976; Imbrie, 1980, 1985, 1993). One of the most puzzling features of this record is the prominence of variability at the obliquity period (Raymo and Nisancioglu, 2003; Lisiecki and Raymo, 2005; Cortijo et al., 1999; Vimeux et al., 2001). Traditionally, orbital cycles in global ice volume have 25
CPD
4, 515–534, 2008
Snowfall response to obliquity forcing
S.-Y. Lee and C. J. Poulsen Title Page Abstract Introduction Conclusions References Tables Figures ◭ ◮ ◭ ◮ Back Close
Full Screen / Esc
Printer-friendly Version Interactive Discussion However, high-latitude summer insolation is influenced most strongly by Earth’s
pre-cession with a period of ∼23 kyr. It is perplexing then that spectral power in benthic δ18O is greater in the obliquity band than the precessional band.
To explain this paradox, two types of hypotheses have been proposed, (i) those that are generally consistent with Milankovitch’s original hypothesis and (ii) those that call 5
upon non-linear climate feedbacks to amplify orbital, and specifically obliquity, forcing. In the first category, Huyber (2006) suggests that obliquity primarily controlled ice vol-ume changes through the integrated summer energy. Precession greatly influences absolute summer insolation but the short duration of the precessional summer leads to lower summer energy than that of obliquity. Raymo et al. (2006) proposes that the 10
change in benthic δ18O due to the increase in the NH ice volume was offset by the melting of the West Antarctic Ice Sheet due to the out-of-phase precessional insolation forcing between the two hemispheres. The strong 41 kyr ice-volume signal was also attributed to the fact that obliquity has nearly twice the period than precession, and therefore twice the time to accumulate snow/ice (Ruddiman, 2003). In the second cat-15
egory, it has been proposed that climate feedbacks, mainly associated with meridional heat and vapor transports, may have modulated orbital forcing (Khodri et al., 2001; Crucifix and Loutre, 2002; Raymo and Nisancioglu, 2003; Loutre et al., 2004; Vettoretti and Peltier, 2004; Kukla and Gavin, 2004; Risebrobakken et al., 2006).
The focus on climate feedbacks on orbital forcing arises from recognition that obliq-20
uity and precession affect Earth’s insolation in different ways. In contrast to precession, obliquity alters the mean-annual equator-to-pole insolation gradient. A reduction in ax-ial tilt from the Plio-Pleistocene maximum (24.5◦) to minimum (22.2◦) reduces annual
insolation by up to ∼16 Wm−2
(∼8%) at high latitudes and increases it by ∼3 Wm−2
(<0.5%) at the equator (calculated from Berger and Loutre, 1991). In a climate model-25
ing study, Crucifix and Loutre (2002) demonstrate that mean-annual insolation changes due to obliquity could account for most of the high-latitude temperature changes during the last interglacial. In addition, Loutre et al. (2004) show that mean-annual insolation has significant spectral power at the obliquity band and hypothesize that paleo-climate
CPD
4, 515–534, 2008
Snowfall response to obliquity forcing
S.-Y. Lee and C. J. Poulsen Title Page Abstract Introduction Conclusions References Tables Figures ◭ ◮ ◭ ◮ Back Close
Full Screen / Esc
Printer-friendly Version Interactive Discussion records of sea-surface temperature and global ice volume can be interpreted as a
re-sponse to changes in mean-annual insolation and insolation gradients.
Obliquity also has a substantial influence on seasonal insolation. A reduction in Earth’s obliquity from the Plio-Pleistocene maximum to minimum reduces solar heat-ing in summer and fall by up to 48 Wm−2 at high latitude and increases it by 7 Wm−2
5
near the equator, enhancing the equator-to-pole insolation gradient by 55 Wm−2. A
number of studies have suggested that an increase in the seasonal equator-to-pole insolation gradient might have enhanced snowfall over ice sheets due to greater la-tent heat transport and internal climate oscillation (Johnson, 1991; Khodri et al., 2001; Vettoretti and Peltier, 2003, 2004; Kukla and Gavin, 2004). In support of these ideas, 10
Raymo and Nisancioglu (2003) show that summer equator-to-pole insolation gradient is strongly correlated to glacial-interglacial ice-volume variations from 3.0 to 0.8 Ma.
Although insolation gradient changes have been frequently linked to ice volume variability, this mechanism has not been explicitly tested. The goal of this study is to systematically quantify the influence of both mean-annual and seasonal insolation 15
changes resulting from Earth’s obliquity on continental snowfall, and to determine the climate mechanisms that respond to these insolation variations. To do this, we have developed coupled ocean-atmosphere model experiments that represent: (1) mean-annual and seasonal insolation changes due to a reduction in Earth’s axial tilt; and (2) mean-annual only insolation changes due to a reduction in Earth’s axial tilt. By 20
comparing results from these two scenarios, we distinguish the climate responses to mean-annual and seasonal forcings.
Our model results indicate that seasonal and mean-annual insolation forcings asso-ciated with a decrease in axial tilt generate comparable changes in annual continental snowfall. In Sect. 3, we describe the snowfall differences and explain the physical 25
mechanisms that account for these changes. In Sect. 5, we compare the snowfall response due to changes in Earth’s obliquity and precession, and discuss the implica-tions of these results for global ice volume variability.
CPD
4, 515–534, 2008
Snowfall response to obliquity forcing
S.-Y. Lee and C. J. Poulsen Title Page Abstract Introduction Conclusions References Tables Figures ◭ ◮ ◭ ◮ Back Close
Full Screen / Esc
Printer-friendly Version Interactive Discussion
2 Experimental design
This study was completed using the Fast Ocean Atmosphere Model (FOAM) version 1.5, a fully coupled mixed-resolution ocean and atmosphere general circulation model (GCM) (Jacob, 1997). The atmospheric model is a parallelized version of the Commu-nity Climate Model 2 (CCM2) with the upgraded radiative and hydrological physics in-5
corporated in CCM3.6 (Kiehl, 1996). The atmospheric component of FOAM was run at a spectral resolution of R15 (4.5◦
×7.5◦) with 18 vertical levels. The oceanic component (OM3) is a z-coordinate ocean model with 128×128 point Mercator grid (1.4◦
×2.8◦), 24 vertical levels, and an explicit free surface. FOAM was designed for long century-scale integrations and exhibits minimal ocean drift with no flux corrections (Wu et al., 2003). 10
FOAM’s simulation of modern climate shows reasonable agreement with present-day observations and NCAR CSM (Harrison et al., 2003). FOAM has been widely used to study climate change through geological time (e.g. Liu et al., 2000; Poulsen et al., 2001; Lee and Poulsen, 2006).
A change in Earth’s axial tilt alters the distribution of insolation, significantly influ-15
encing both mean-annual and seasonal meridional insolation gradients. A decrease in Earth’s obliquity from 24.5 to 22.2◦, for instance, increases the mean-annual gradient
by ∼30 Wm−2
, the summer gradient by ∼55 Wm−2, and reduces the winter gradient
by ∼10 Wm−2. We have designed two sets of experiments to estimate the climate
response to each of these components. The first experimental set is straightforward 20
and includes experiments with high (24.5◦; hobl) and low (22.2◦; lobl) axial tilt
(Ta-ble 1). We have used Earth’s maximum and minimum obliquities over the last five million years (Berger and Loutre, 1991). The difference between hobl and lobl ex-periments yields the climate response resulting from both mean-annual and seasonal insolation changes, which we refer to as ∆TOTAL.
25
A second set of experiments was designed to estimate the climate response to just mean-annual insolation forcing caused by a change in axial tilt. In this case, we first computed the difference in mean-annual insolation between our high (hobl) and low
CPD
4, 515–534, 2008
Snowfall response to obliquity forcing
S.-Y. Lee and C. J. Poulsen Title Page Abstract Introduction Conclusions References Tables Figures ◭ ◮ ◭ ◮ Back Close
Full Screen / Esc
Printer-friendly Version Interactive Discussion (lobl) obliquity experiments, and a present day experiment. We then added these
mean-annual, zonal insolation anomalies to two present-day experiments. These in-solation adjustments increase the annual equator-to-pole inin-solation in one experiment (higrad ) and decrease it in the second (lograd ) (Table 1), but seasonal insolation and in-solation gradients are identical between experiments and unchanged from the present 5
day. The difference between higrad and lograd experiments yields the climate re-sponse to obliquity’s mean-annual forcing, which we refer to as ∆MA.
It is important to note that mean annual insolation in the higrad and lograd exper-iments are identical to those in the hobl and lobl experexper-iments, respectively, and that only seasonal insolation differs between these experiments (Fig. 1). As a result, the 10
mean-annual insolation difference in ∆TOTAL and ∆MA are also the same. Thus, to estimate the climate response to seasonal insolation only (∆SEA), we difference our two sets of experiments. In summary:
– ∆TOTAL = lobl – hobl; represents total insolation difference due to a reduction in
axial tilt 15
– ∆MA = higrad – lograd; represents the mean-annual insolation difference due to
a reduction in axial tilt
– ∆SEA = ∆TOTAL – ∆MA; represents the seasonal insolation difference due to a
reduction in axial tilt.
Because our ultimate objective is to explain variability in the ice-volume record, we 20
focus on the climate response comparison between ∆TOTAL and ∆MA here.
Other than insolation, all model boundary conditions were set to modern values in-cluding trace gas concentrations and geography. The experiments were each inte-grated for 200 yr, bringing the surface ocean into quasi-equilibrium. The model results presented here were averaged over the last 50 model years.
CPD
4, 515–534, 2008
Snowfall response to obliquity forcing
S.-Y. Lee and C. J. Poulsen Title Page Abstract Introduction Conclusions References Tables Figures ◭ ◮ ◭ ◮ Back Close
Full Screen / Esc
Printer-friendly Version Interactive Discussion
3 Result
3.1 Snowfall response
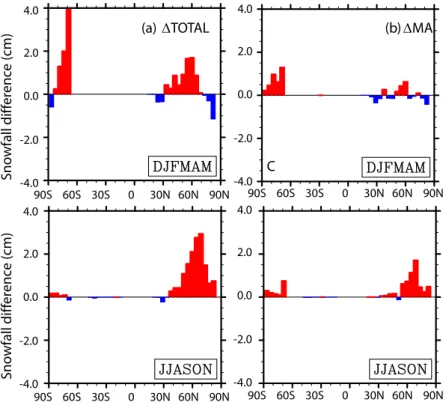
To quantify the possible contribution made by mean-annual and seasonal forcing to ice-sheet mass balance, we examine the high-latitude snowfall responses to both ∆TOTAL and ∆MA. In ∆TOTAL, zonal continental snowfall increases by 25.0 cm (sum of upper 5
and lower panel of Fig. 2a). In contrast, in ∆MA, annual snowfall increases by 10.9 cm (sum of upper and lower panel of Fig. 2b). The seasonal snowfall response (∆SEA) is 14.1 cm, indicating that mean-annual and seasonal insolation changes contribute almost equally to the total continental snowfall response. In both ∆TOTAL and ∆MA, the snowfall response occurs mainly during the summer. In the northern hemisphere, 10
for example, a reduction in obliquity (∆TOTAL) enhances summer half-year snowfall by 78% and winter half-year snowball by 22% (Fig. 2b).
Differences in snowfall are mainly due to differences in non-convective stable snow-fall which are closely related to temperature and moisture transport. Non-convective precipitation in the model forms when an air parcel exceeds vapor saturation, and be-15
comes snow when the lowest level of the atmosphere and the land surface are below the freezing point of water. Obliquity alters insolation in two ways that might enhance the total snow formation in ∆TOTAL relative to ∆MA: (1) by decreasing insolation and temperature at high latitudes; and/or (2) by enhancing the seasonal meridional insola-tion gradient and moisture transport. We examine each of these factors below.
20
3.2 Winter snowfall response
From an energy balance perspective, mean-annual surface-air temperatures (SATs) might be expected to be similar in ∆TOTAL and ∆MA since both sets have the same mean-annual insolation difference (Fig. 1; right column). Over most latitudes this is the case, and SATs are similar between the experimental sets. However, poleward of 25
CPD
4, 515–534, 2008
Snowfall response to obliquity forcing
S.-Y. Lee and C. J. Poulsen Title Page Abstract Introduction Conclusions References Tables Figures ◭ ◮ ◭ ◮ Back Close
Full Screen / Esc
Printer-friendly Version Interactive Discussion summer (Fig. 3b). Most of the zonal SAT difference between ∆TOTAL and ∆MA can
be attributed to a wintertime low-cloud feedback.
In the modern climate, low clouds form when the low-level atmosphere reaches va-por saturation. The extent of low clouds strongly influences the local radiation budget, generally decreasing the downward shortwave flux and increasing the upward long-5
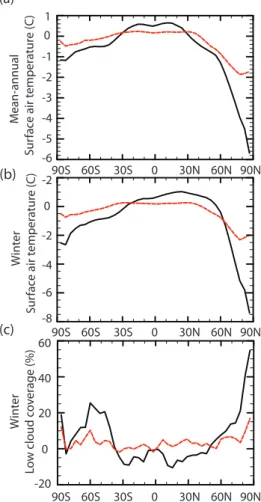
wave flux (Hartmann et al., 1992). In FOAM, low-cloud coverage is the fraction of cloud-covered sky between the surface and 700 mb pressure level. Low-cloud for-mation is favorable when relative humidity is high and convection is weak or absent (Klein et al., 1994). In ∆TOTAL, the greater NH winter solar heating and evaporation (Fig. 1a) increases the relative humidity leading to an increase in low-cloud coverage. 10
In the absence of this winter heating in ∆MA, the relative humidity and low-cloud frac-tion does not change (Figs. 1b and 3c). The difference in winter low cloud-coverage is nearly 40% between the two experimental sets (Fig. 3c). The increase in low-cloud coverage reduces surface radiative heating that cools the NH high-latitude winter SAT in ∆TOTAL, and dominates the mean-annual SAT signal (Fig. 3a and b). The cold SAT 15
is the primary reason for the snowfall difference in boreal winter but can not account for the summer snowfall differences (Fig. 2a and b). In the SH, the relationship between SATs and insolation changes is different than the NH. SATs of the southern high lati-tudes are not particularly sensitive to insolation forcings in either experimental set. This result is likely due to the presence of Antarctic ice sheets, with their high elevation and 20
albedo, dominate the regional climate maintaining very cold air temperature (Fig. 3a) 3.3 Summer snowfall response
In summer, snowfall increases due to both (1) a decrease in air temperature due to a reduction in NH insolation and (2) an increase in seasonal poleward moisture transport. Summer (June) insolation at 80◦N decreases by 48 and 25 Wm−2
in ∆TOTAL and 25
∆MA, leading to decreases in zonal-averaged SATs by 2.5 and 0.5◦C, respectively.
The larger reduction in SAT in ∆TOTAL is mainly due to a greater summer sea-ice extent in the lobl experiment, which increases local albedo. A decrease in high-latitude
CPD
4, 515–534, 2008
Snowfall response to obliquity forcing
S.-Y. Lee and C. J. Poulsen Title Page Abstract Introduction Conclusions References Tables Figures ◭ ◮ ◭ ◮ Back Close
Full Screen / Esc
Printer-friendly Version Interactive Discussion SATs might increase the snowfall response by reducing local saturation vapor pressure.
The saturation vapor pressure decreases exponentially with air temperature. However, condensation due to SAT change does not change the local relative humidity. The increase in relative humidity in both experimental sets (Fig. 4c and d) indicates moisture transport into most of the northern mid- and high-latitude.
5
In addition to absolute insolation, the summer equator-to-pole gradient also changes in ∆TOTAL and ∆MA. A reduction in the axial tilt (∆TOTAL) enhances the summer equator-to-pole insolation gradient by up to 55 Wm−2 (Fig. 1a) leading to a 3◦C
in-crease in summer meridional temperature gradient. In contrast, in ∆MA, the summer equator-to-pole gradient is enhanced by only 30 Wm−2(Fig. 1b) leading to a 0.5◦C
in-10
crease in summer meridional temperature gradient. As a result of differential heat-ing between low- and high-latitudes, the baroclinicity increases in both cases. In the modern climate, transient eddies increase with baroclinicity and are responsible for transporting heat and moisture between the subtropics and mid-latitude (Trenberth and Stepaniak, 2003). FOAM responds in a similar manner; summer mid-latitude baroclin-15
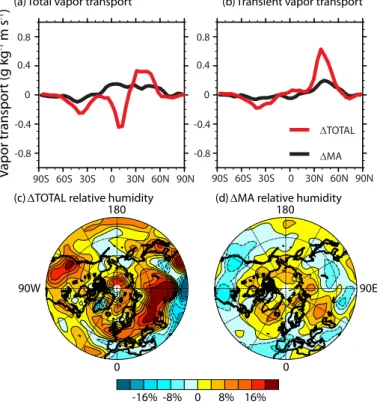
icity is greater in ∆TOTAL than ∆MA. The high baroclinicity in ∆TOTAL enhances the transient eddy activity leading to a 200% increase in summer poleward transient eddy vapor transport at 40◦N and an enhancement in the total vapor transport (Fig. 4a).
The increase in summer vapor transport provides the moisture for additional boreal continental snowfall.
20
4 Summary and caveats
Changes in obliquity cause variations in both mean-annual and seasonal insolation. We have designed numerical experiments to evaluate the relative importance of these insolation changes on continental snowfall. Our model results indicate that the in-fluence of mean-annual and seasonal obliquity forcing are approximately equal and 25
account for 44% and 56% of annual snowfall, respectively. We show in Sect. 3 that the response to insolation forcing through obliquity is amplified in FOAM through winter
CPD
4, 515–534, 2008
Snowfall response to obliquity forcing
S.-Y. Lee and C. J. Poulsen Title Page Abstract Introduction Conclusions References Tables Figures ◭ ◮ ◭ ◮ Back Close
Full Screen / Esc
Printer-friendly Version Interactive Discussion cloud and summer transient eddy feedbacks (Figs. 3 and 4). Our results highlight the
importance of equator-to-pole insolation gradients, and demonstrate that changes in insolation gradients can generate dynamical changes that influence moisture transport and continental snowfall. For perspective, it is worth noting that a decrease in axial tilt (∆TOTAL) led to zonal SAT decreases of 6 and 2◦C in NH winter and summer,
respec-5
tively. Yet, the snowfall response was 3.5x greater in the NH summer, mainly due to enhanced moisture transport through transient eddies.
In our experimental design and analysis, we have made several assumptions that warrant discussion. First, throughout our analysis and interpretation, we assume that an increase in snowfall translates into an increase in ice volume. In reality, the ice 10
volume results from a combination of snowfall accumulation and summer ablation. As a result, the inferred ice-volume changes between our ∆TOTAL and ∆MA cases are probably too small because ∆TOTAL has a lower summer surface temperature and the ablation decreases during cold summer episode (Fig. 1). In the absence of a dynamic ice-sheet component in our model, it is not possible to calculate the exact ice-volume 15
change that would result from the changes in insolation forcing prescribed here; con-sequently, our results may be better viewed as continental ice accumulation potential. In addition, since we simulate the climate response to obliquity insolation changes un-der present-day boundary conditions (i.e. pCO2and land surface types), the snowfall
response described here does not account for Pleistocene boundary conditions, which 20
varied between glacial and interglacial. In a cold climate with low pCO2, it is unclear if
the snowfall response to insolation forcing would increase. A decrease in mid-latitude surface temperature would likely cause an increase in summer snowfall and an en-hanced moisture transport due to a stronger meridional thermal gradient. However, a decrease in surface temperature might also reduce humidity due to a decrease in 25
saturation vapor pressure in a cold climate. Finally, the FOAM experiments were in-tegrated for 200 yr; the surface ocean has reached a quasi-steady state but the deep ocean is still equilibrating. Because we focus our analysis on surface and tropospheric condition, the deep ocean condition should have little effect on surface temperature
CPD
4, 515–534, 2008
Snowfall response to obliquity forcing
S.-Y. Lee and C. J. Poulsen Title Page Abstract Introduction Conclusions References Tables Figures ◭ ◮ ◭ ◮ Back Close
Full Screen / Esc
Printer-friendly Version Interactive Discussion and continental snowfall.
5 Implications for the ice volume record
Meridional insolation gradient changes and associated atmospheric and vapor re-sponses have been hypothesized to cause ice-volume variability (e.g. Khodri et al., 2001; Crucifix and Loutre, 2002; Raymo and Nisancioglu, 2003; Loutre et al., 2004; 5
Vettoretti and Peltier, 2004; Kukla and Gavin, 2004; Risebrobakken et al., 2006). How-ever, this hypothesis has not been explicitly tested in a systematic way before. In support of both gradient hypotheses, our result shows that high-latitude continental snowfall is enhanced with an increase in the meridional insolation gradient and that mean-annual and seasonal insolation gradient have comparable influences on conti-10
nental snowfall, and presumably global ice volume.
To directly compare the snowfall response to obliquity and precession, we have com-pleted two additional precessional sensitivity experiments. In these experiments, north-ern hemisphere summer is positioned at aphelion and perihelion, respectively, in an eccentric orbit (eccentricity=0.056, which represents the maximum value over the last 15
3 Ma, Berger et al., 1993). The shift in the orbital position of NH summer leads to a NH continental snowfall response that is 85% of that calculated for a change in axial tilt. In comparison to a change in obliquity, a change in precession does not influence mean-annual insolation and has only a small influence on summer insolation gradients. However, it has a very large affect (up to ∼70 Wm−2) on absolute summer insolation,
20
which accounts for the large snowfall response. This comparison has important impli-cations for the insolation gradient hypothesis. While mean-annual and summer inso-lation gradient changes associated with a decrease in obliquity may amplify relatively weak insolation forcing, their influence may not be sufficiently large to account for the spectral nature of the ice volume record.
25
Several other ideas have been proposed to explain the link between obliquity and ice ages. To explain the 41 kyr period of ice ages, Huyber (2006) suggests that obliquity
CPD
4, 515–534, 2008
Snowfall response to obliquity forcing
S.-Y. Lee and C. J. Poulsen Title Page Abstract Introduction Conclusions References Tables Figures ◭ ◮ ◭ ◮ Back Close
Full Screen / Esc
Printer-friendly Version Interactive Discussion primarily controlled ice volume changes through the integrated summer energy.
Sum-mer energy is a function of both insolation duration and intensity. When total sumSum-mer energy rather than summer insolation is considered, obliquity becomes the dominant component of the power spectra. However, our orbital sensitivity experiments account for changes in seasonal durations and yet the snowfall response is not substantially 5
greater in our obliquity than precession experiments. Raymo et al. (2006) suggest that because Earth’s orbital precession induces insolation changes that are out of phase between hemispheres, the global ice volume change recorded by benthic δ18O or sea level is small due to the global integration. Our model results show an increase of NH snowfall and a reduction of SH snowfall in response to a shift in precessional phase. 10
It is possible that the cancelling between NH and SH snowfall might play a role; how-ever, the cancelling effect depends on the mass-balance between the δ18O of snow and ice in Antarctic and that in the NH over every precessional cycle. The product of hemispheric snow accumulation and its oxygen isotopic concentration has to be ap-proximately equal. On the basis of this cancelling hypothesis, the ice-volume record 15
should exhibit a strong precessional signal prior to the development of major NH ice sheets. The ice-volume record does not appear to support this expectation. Alterna-tively, the expression of 41 kyr signal may simply be due to the fact that the obliquity period is longer than that of precession, allowing for longer ice accumulation and a greater ice volume change (Ruddiman, 2003). In spectral analyses, power variance is 20
an exponential function of the absolute variance. Thus, if ice volume change associ-ated with obliquity were greater than that due to precession, the power variance would be larger in the obliquity band.
In sum, this contribution systematically identifies climate mechanisms that amplify the climate response to obliquity forcing, and demonstrates that both mean-annual 25
and seasonal changes in the meridional distribution of insolation play important roles in amplifying this forcing. Nonetheless, our model results suggest that these climate feedbacks can not fully explain the large spectral power of the 41-kyr cycles in the ice-volume record, and the 41-kyr paradox remains just that.
CPD
4, 515–534, 2008
Snowfall response to obliquity forcing
S.-Y. Lee and C. J. Poulsen Title Page Abstract Introduction Conclusions References Tables Figures ◭ ◮ ◭ ◮ Back Close
Full Screen / Esc
Printer-friendly Version Interactive Discussion
Acknowledgements. This research was supported by National Science Foundation grant
ATM-0432503 to C. J. Poulsen, and the University of Michigan Barbour Fellowship and Scott Turner Research Fund to S.-Y. Lee.
References
Berger, A. and Loutre, M. F.: Insolation Values for the Climate of the Last 10 000 000 Years,
5
Quaternary Sci. Rev., 10, 297–317, 1991.
Berger, A., Loutre, M. F., and Tricot, C.: Insolation and Earths Orbital Periods, J. Geophys. Res.-Atmos., 98, 10 341–10 362, 1993.
Cortijo, E., Lehman, S., Keigwin, L., Chapman, M., Paillard, D., and Labeyrie, L.: Changes in meridional temperature and salinity gradients in the North Atlantic Ocean (30 degrees–72
10
degrees N) during the last interglacial period, Paleoceanography, 14, 23–33, 1999.
Crucifix, M. and Loutre, M. F.: Transient simulations over the last interglacial period (126– 115 kyr BP): feedback and forcing analysis, Clim. Dynam., 19, 417–433, 2002.
Green, R. J., Fred, U. P., and Norbert, W. P.: Things that go bump in the night, Psych. Today, 46, 345–678, 1900.
15
Harrison, S. P., Kutzbach, J. ., Liu, Z., Bartlein, P. J., Otto-Bliesner, B., Muhs, D., Prentice, I. C., and Thompson, R. S.: Mid-Holocene climates of the Americas: a dynamical response to changed seasonality, Clim. Dynam., 20, 663–688, 2003.
Hartmann, D. L., Ockertbell, M. E., and Michelsen, M. L.: The Effect of Cloud Type on Earths Energy-Balance – Global Analysis, J. Climate, 5, 1281–1304, 1992.
20
Hays, J. D., Imbrie, J., and Shackleton, N. J.: Variations in Earths Orbit – Pacemaker of Ice Ages, Science, 194, 1121–1132, 1976.
Huybers, P.: Early Pleistocene glacial cycles and the integrated summer insolation forcing, Science, 313, 508–511, 2006.
Huynh, T. T. and Poulsen, C. J.: Rising atmospheric CO2 as a possible trigger for the
end-25
Triassic mass extinction. Palaeogeogr. Palaeoecl., 217, 223–242, 2005.
Imbrie, J.: A Theoretical Framework for the Pleistocene Ice Ages, J. Geol. Soc., 142, 417–432, 1985.
Imbrie, J. and Imbrie, J. Z.: Modeling the Climatic Response to Orbital Variations, Science, 207, 943–953, 1980.
CPD
4, 515–534, 2008
Snowfall response to obliquity forcing
S.-Y. Lee and C. J. Poulsen Title Page Abstract Introduction Conclusions References Tables Figures ◭ ◮ ◭ ◮ Back Close
Full Screen / Esc
Printer-friendly Version Interactive Discussion
Imbrie, J., Mix, A. C., and Martinson, D. G.: Milankovitch Theory Viewed from Devils Hole, Nature, 363, 531–533, 1993.
Jacob, R.: Low frequency variability in a simulated atmosphere ocean system, University of Wis.-Madison, Madison, 159 pp., 1997.
Johnson, R. G.: Major Northern-Hemisphere Deglaciation Caused by a Moisture Deficit
140-5
Ka, Geology, 19, 686–689, 1991.
Khodri, M., Leclainche, Y., Ramstein, G., Braconnot, P., Marti, O., and Cortijo, E.: Simulating the amplification of orbital forcing by ocean feedbacks in the last glaciation, Nature, 410, 570–574, 2001.
Kiehl, J. T., Hack, J. J., Bonan, G. B., Boville, B. A., Briegleb B. P., Williamson, D. L., and Rasch,
10
P. J.: Description fo the NCAR Community Climate Model (CCM3) 152 pp., 1996.
Klein, R. I., McKee, C. F., and Colella, P.: On the Hydrodynamic Interaction of Shock-Waves with Interstellar Clouds .1. Nonradiative Shocks in Small Clouds, Astrophys. J., 420, 213– 236, 1994.
Kukla, G. and Gavin, J.: Milankovitch climate reinforcements, Global Planet. Change, 40, 27–
15
48, 2004.
Lee, S. Y. and Poulsen, C. J.: Sea ice control of Plio-Pleistocene tropical Pacific climate evolu-tion, Earth Planet. Sc. Lett., 248, 253–262, 2006.
Lisiecki, L. E. and Raymo, M. E.: A Pliocene-Pleistocene stack of 57 globally distributed benthic delta O-18 records, Paleoceanography, 20, PA1003, doi:10.1029/2004PA001071, 2005.
20
Liu, Z. Y., Kutzbach, J., and Wu, L. X.: Modeling climate shift of El Nino variability in the Holocene, Geophys. Res. Lett., 27, 2265–2268, 2000.
Loutre, M. F., Paillard, D., Vimeux, F., and Cortijo, E.: Does mean annual insolation have the potential to change the climate?, Earth Planet. Sci. Lett., 221, 1–14, 2004.
Milankovitch, M.: Ausbau Und Gegenwartiger Stand Der Astronomischen Theorie Der
25
Erdgeschichtlichen Klimate, Experientia, 4, 413–418, 1948.
Petit, J. R., Jouzel, J., Raynaud, D., et al.: Climate and atmospheric history of the past 420 000 years from the Vostok ice core, Antarctica, Nature, 399, 429–436, 1999.
Poulsen, C. J., Pierrehumbert, R. T., and Jacob, R. L.: Impact of ocean dynamics on the simulation of the Neoproterozoic “snowball Earth”, Geophys. Res. Lett., 28, 1575–1578,
30
2001.
Raymo, M. E., Lisiecki, L. E., and Nisancioglu, K. H.: Plio-pleistocene ice volume, Antarctic climate, and the global delta O-18 record, Science, 313, 492–495, 2006.
CPD
4, 515–534, 2008
Snowfall response to obliquity forcing
S.-Y. Lee and C. J. Poulsen Title Page Abstract Introduction Conclusions References Tables Figures ◭ ◮ ◭ ◮ Back Close
Full Screen / Esc
Printer-friendly Version Interactive Discussion
Raymo, M. E. and Nisancioglu, K.: The 41 kyr world: Milankovitch’s other unsolved mystery, Paleoceanography, 18, 1011, doi:10.1029/2002PA000791, 2003.
Risebrobakken, B., Balbon, E., Dokken, T., Jansen, E., Kissel, C., Labeyrie, L., Richter, T., and Senneset, L.: The penultimate deglaciation: High-resolution paleoceanographic evidence from a north-south transect along the eastern Nordic Seas, Earth Planet. Sc. Lett., 241,
5
505–516, 2006.
Ruddiman, W. F.: Orbital insolation, ice volume, and greenhouse gases, Quaternary Sci. Rev., 22, 1597–1629, 2003.
Trenberth, K. E. and Stepaniak, D. P.: Seamless poleward atmospheric energy transports and implications for the Hadley circulation, J. Climate, 16, 3706–3722, 2003.
10
Vettoretti, G. and Peltier, W. R.: Post-Eemian glacial inception, Part II: Elements of a cryospheric moisture pump, J. Climate, 16, 912–927, 2003.
Vettoretti, G. and Peltier, W. R.: Sensitivity of glacial inception to orbital and greenhouse gas climate forcing, Quaternary Sci. Rev., 23, 499–519, 2004.
Vimeux, F., Masson, V., Delaygue, G., Jouzel, J., Petit, J. R., and Stievenard, M.: A 420 000 year
15
deuterium excess record from East Antarctica: Information on past changes in the origin of precipitation at Vostok, J. Geophys. Res.-Atmos., 106, 31 863–31 873, 2001.
Vimeux, F., Masson, V., Jouzel, J., Stievenard, M., and Petit, J. R.: Glacial-interglacial changes in ocean surface conditions in the southern hemisphere, Nature, 398, 410–413, 1999. Wu, L., Liu, Z., Gallimore, R., Jacob, R., Lee, D., and Zhong, Y.: Pacific decadal variability: The
20
CPD
4, 515–534, 2008
Snowfall response to obliquity forcing
S.-Y. Lee and C. J. Poulsen Title Page Abstract Introduction Conclusions References Tables Figures ◭ ◮ ◭ ◮ Back Close
Full Screen / Esc
Printer-friendly Version Interactive Discussion
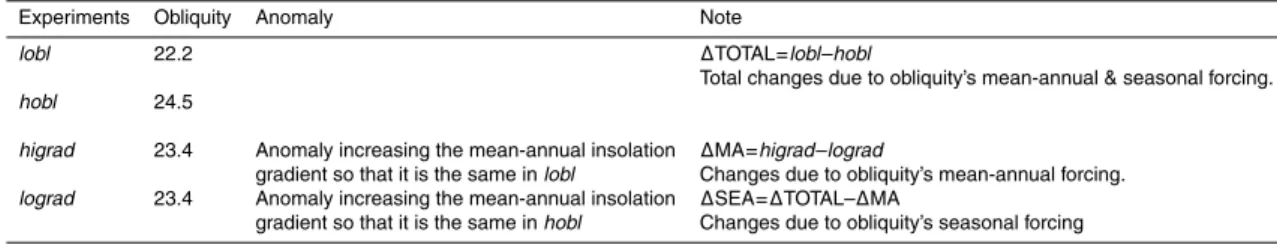
Table 1. Numerical climate experiments.
Experiments Obliquity Anomaly Note
lobl 22.2 ∆TOTAL=lobl–hobl
Total changes due to obliquity’s mean-annual & seasonal forcing.
hobl 24.5
higrad 23.4 Anomaly increasing the mean-annual insolation ∆MA=higrad–lograd
gradient so that it is the same in lobl Changes due to obliquity’s mean-annual forcing.
lograd 23.4 Anomaly increasing the mean-annual insolation ∆SEA=∆TOTAL–∆MA
CPD
4, 515–534, 2008
Snowfall response to obliquity forcing
S.-Y. Lee and C. J. Poulsen Title Page Abstract Introduction Conclusions References Tables Figures ◭ ◮ ◭ ◮ Back Close
Full Screen / Esc
Printer-friendly Version Interactive Discussion J F M A M J J A S O N D-16 -8 0 J F M A M J J A S O N D -16 -8 0 Insolation difference (Wm-2) -40 -20 0 20 40 90N 60N 30N 0 30S 60S 90S 90N 60N 30N 0 30S 60S 90S la titude la titude (a) (b) ∆ ∆ ∆
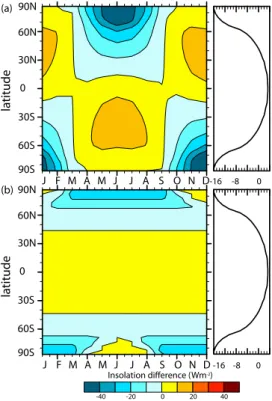
Fig. 1. Mean monthly and annual (right column) insolation difference (Wm−2) between ∆TOTAL
((a) lobl–hobl) and ∆MA ((b) higrad–lograd) experiments. The insolation difference in ∆MA yields the climate response to obliquity’s mean-annual forcing. Contour interval is 10 Wm−2.
Although seasonal insolation differs between these experiments sets, mean-annual insolation is identical between ∆TOTAL and ∆MA.
CPD
4, 515–534, 2008
Snowfall response to obliquity forcing
S.-Y. Lee and C. J. Poulsen Title Page Abstract Introduction Conclusions References Tables Figures ◭ ◮ ◭ ◮ Back Close
Full Screen / Esc
Printer-friendly Version Interactive Discussion 90S 60S 30S 0 30N 60N 90N 90S 60S 30S 0 30N 60N 90N 2.0 4.0 0.0 -2.0 -4.0 2.0 4.0 0.0 -2.0 -4.0 S no wfall diff er enc e (cm) S no wfall diff er enc e (cm) 90S 60S 30S 0 30N 60N 90N 90S 60S 30S 0 30N 60N 90N 2.0 4.0 0.0 -2.0 -4.0 2.0 4.0 0.0 -2.0 -4.0 C (a) ∆TOTAL (b) ∆MA
∆
∆
Fig. 2. Continental snowfall response to orbital forcing. Zonally averaged half-year (December
through May and June through November) differences in total snowfall (cm): (a) ∆TOTAL (lobl–
CPD
4, 515–534, 2008
Snowfall response to obliquity forcing
S.-Y. Lee and C. J. Poulsen Title Page Abstract Introduction Conclusions References Tables Figures ◭ ◮ ◭ ◮ Back Close
Full Screen / Esc
Printer-friendly Version Interactive Discussion M ean-annual Sur fac e air t emp er a tur e (C) 90S 60S 30S 0 30N 60N 90N 90S 60S 30S 0 30N 60N 90N 90S 60S 30S 0 30N 60N 90N 1 0 -1 -2 -3 -4 -5 -6 60 40 20 0 -20 W in ter L o w cloud c o ver age (%) (a) (b) (c) -8 -6 -4 -2 0 -2 W in ter Sur fac e air t emp er a tur e (C) ∆ ∆
Fig. 3. Differences in zonally averaged (a) mean-annual surface air temperature (in degrees
Celsius), (b) winter surface air temperature (in◦Celsius), and (c) winter low-cloud coverage (%)
between experimental sets. Results from ∆TOTAL and ∆MA experiments are shown in solid
CPD
4, 515–534, 2008
Snowfall response to obliquity forcing
S.-Y. Lee and C. J. Poulsen Title Page Abstract Introduction Conclusions References Tables Figures ◭ ◮ ◭ ◮ Back Close
Full Screen / Esc
Printer-friendly Version Interactive Discussion 180 90W 0 180 90E 0 -16% -8% 0 8% 16% (c) ∆TOTAL relative humidity
(a) Total vapor transport (b) Transient vapor transport
(d) ∆MA relative humidity
∆ ∆ ∆ ∆ ∆TOTAL ∆MA 90S 60S 30S 0 30N 60N 90N 90S 60S 30S 0 30N 60N 90N 0.4 0 -0.4 0.8 -0.8 0.4 0 -0.4 0.8 -0.8 V ap or tr ansp or t (g k g -1 m s -1)
Fig. 4. Response of vapor transports and tropospheric relative humidity to orbital changes. (a–b) Difference in zonal-average June-July-August atmospheric meridional vapor transport
(g kg−1ms−1
) by (a) all processes (mean meridional + stationary eddies + transient eddies) and through (b) transient eddies between experimental sets. Results from ∆TOTAL and ∆MA experiments are shown in red and black line, respectively. Positive values represent an in-crease in the northward vapor transport or a reduction in the southward vapor transport. (c–d) Difference maps in lower tropospheric (700 mb) June-July-August relative humidity (%) as a result of a increase in vapor tranport in (c) ∆TOTAL and (d) ∆MA. The polar projection map begins at 30◦N and the contour interval is 4%.