HAL Id: hal-00298174
https://hal.archives-ouvertes.fr/hal-00298174
Submitted on 2 Feb 2007HAL is a multi-disciplinary open access
archive for the deposit and dissemination of sci-entific research documents, whether they are pub-lished or not. The documents may come from teaching and research institutions in France or abroad, or from public or private research centers.
L’archive ouverte pluridisciplinaire HAL, est destinée au dépôt et à la diffusion de documents scientifiques de niveau recherche, publiés ou non, émanant des établissements d’enseignement et de recherche français ou étrangers, des laboratoires publics ou privés.
Two modes of glacial climate during the late stage 5
identified in Greenland ice core records
M.-L. Siggaard-Andersen, P. D. Ditlevsen, A. Walløe Hansen, S. J. Johnsen
To cite this version:
M.-L. Siggaard-Andersen, P. D. Ditlevsen, A. Walløe Hansen, S. J. Johnsen. Two modes of glacial climate during the late stage 5 identified in Greenland ice core records. Climate of the Past Discussions, European Geosciences Union (EGU), 2007, 3 (1), pp.285-299. �hal-00298174�
CPD
3, 285–299, 2007The climate of the late stage 5 in the
North Atlantic M.-L. Siggaard-Andersen et al. Title Page Abstract Introduction Conclusions References Tables Figures ◭ ◮ ◭ ◮ Back Close Full Screen / Esc
Printer-friendly Version Interactive Discussion
Clim. Past Discuss., 3, 285–299, 2007 www.clim-past-discuss.net/3/285/2007/ © Author(s) 2007. This work is licensed under a Creative Commons License.
Climate of the Past Discussions
Climate of the Past Discussions is the access reviewed discussion forum of Climate of the Past
Two modes of glacial climate during the
late stage 5 identified in Greenland ice
core records
M.-L. Siggaard-Andersen1,2, P. D. Ditlevsen1, A. Walløe Hansen1, and S. J. Johnsen1
1
The Niels Bohr Institute, University of Copenhagen, Juliane Maries Vej 30, 2100 Copenhagen Ø, Denmark
2
Alfred Wegener Institute for Polar and Marine Research, Columbusstrasse, 27568, Bremerhaven
Received: 24 January 2007 – Accepted: 31 January 2007 – Published: 2 February 2007 Correspondence to: M.-L. Siggaard-Andersen ([email protected])
CPD
3, 285–299, 2007The climate of the late stage 5 in the
North Atlantic M.-L. Siggaard-Andersen et al. Title Page Abstract Introduction Conclusions References Tables Figures ◭ ◮ ◭ ◮ Back Close Full Screen / Esc
Printer-friendly Version Interactive Discussion
Abstract
From a detailed analysis of marine and terrestrial aerosol tracers in the NGRIP ice core we identified two distinct glacial atmospheric flow patterns. The climate transition from Marine Isotope Stage 5 (MIS 5) to MIS 4, at approximately 75 kyr BP, marks a shift between two different atmospheric flow regimes. Before this transition, during
5
MIS 5d-a, the state of atmospheric flow was alternating between the two modes of different flow patterns, while a more persistent flow pattern was prevailing through the glacial period afterwards. These changes are accompanied by strong changes in an independent Greenland ice core proxy, namely the deuterium excess from the GRIP ice core, reflecting changes in the hydrological cycle and moisture source temperatures
10
as well. The changes in atmospheric flow pattern are correlated with changed extent of ice-rafted detritus (IRD) deposition in the North Atlantic, indicating that the state of the atmospheric flow was highly sensitive to the waxing and waning of the Laurentide ice sheet.
1 Introduction
15
The Marine Isotope Stage 5 (MIS 5) was identified in marine isotope records as a generally warm period (Emiliani, 1955) beginning with the onset of the last interglacial (sub stage 5e) (Shackleton, 1969) approximately 130 kyr BP, and extending long into the last glacial period (sub stages 5a–5d). Most information on the climate during MIS 5 in the North Atlantic region are from ocean sediment records, pollen records and ice
20
core records, providing proxies for temperature, oceanic flow and ice volume. Little is known about changes in the state of the atmospheric flow. Atmospheric transport proxies in the Greenland ice cores are regional in nature, adding to the detailed picture of the glacial climate.
In Greenland ice cores the fraction of stable water isotopes (18O and D) reflect
25
changes both in temperatures and in the hydrological cycle (Jouzel et al., 1982), while 286
CPD
3, 285–299, 2007The climate of the late stage 5 in the
North Atlantic M.-L. Siggaard-Andersen et al. Title Page Abstract Introduction Conclusions References Tables Figures ◭ ◮ ◭ ◮ Back Close Full Screen / Esc
Printer-friendly Version Interactive Discussion
the concentrations of passive aerosol tracers provide information about atmospheric transport, flow patterns and storm intensities (Mayewski et al., 1997; Fischer et al., 2007). Concentrations of soluble Ca2+and Na+ in Greenland ice cores are indicators for respectively mineral dust and sea salt aerosol (Fuhrer et al., 1999), with distinct source areas respectively in the Western Chinese desert areas (Biscaye et al., 1997;
5
Svensson et al., 2000) and in open ocean areas (Herron, 1982; De Angelis et al., 1997). Changing correlations with time between these aerosol species identify reorga-nizations of the atmospheric flow patterns. Here we present a detailed analysis of the correlations between the NGRIP ice core concentrations of Ca2+ and Na+ (Siggaard-Andersen et al., 2006) covering the glacial period back to MIS 5d. We have compared
10
these correlations with other climate proxies of the glacial period and found systematic changes in the behavior of all the records during time sections of the late MIS 5. Based on this finding we have identified two different modes of glacial climate during the late MIS 5.
2 The climate of the late stage 5
15
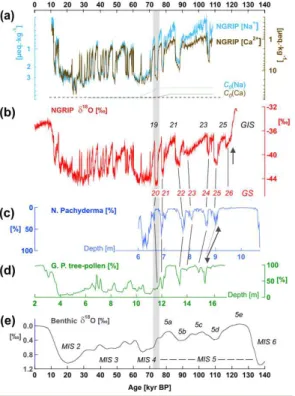
The NGRIP ice core (North Greenland Ice-Core Project (NorthGRIP) Members, 2004) constitutes the most detailed record for Greenland and the North Atlantic region of the early part of the last glacial period and the transition from the previous inter-glacial. In the NGRIP isotopes (Fig. 1b) the last interglacial ended with a gradual cooling and an earlier onset into glacial conditions than seen in the North Atlantic
po-20
lar fauna record (McManus et al., 1994; Chapman and Shackleton, 1999) (Fig. 1c) and in the European pollen record (Woillard, 1979) (Fig. 1d). The same asynchrony was observed in a direct comparison between marine and terrestrial proxies from the margin of the Iberian Peninsula (Shackleton et al., 2003). The glacial climate in the North Atlantic region is characterized by abrupt variations between warm Greenland
25
Interstadials (GIS) (Greenland Ice-Core Project (GRIP) Members, 1993), also called Dansgaard-Oeschger (DO) events, and cold Greenland Stadials (GS) (Walker et al.,
CPD
3, 285–299, 2007The climate of the late stage 5 in the
North Atlantic M.-L. Siggaard-Andersen et al. Title Page Abstract Introduction Conclusions References Tables Figures ◭ ◮ ◭ ◮ Back Close Full Screen / Esc
Printer-friendly Version Interactive Discussion
1999) (Fig. 1b). The climate of the late MIS 5 is characteristic for generally earlier and more prominent cooling at high latitudes than at low latitudes. The marine and terres-trial records (Fig. 1c and Fig. 1d) show in general little sub polar climate response to the beginning northern glaciations until the transition from MIS 5 to MIS 4 at around 75 kyr BP, where a global cooling took place. Notable exceptions from interglacial
con-5
ditions during MIS 5 are the cold spells (Rousseau et al., 2006) related to the Greenland stadials GS-25 and GS-22 (Kukla et al., 1997; McManus et al., 1994).
2.1 The MIS 5 to MIS 4 transition
Figure 1a shows the NGRIP records of soluble Ca2+ and Na+ concentrations, [Na+] and [Ca2+], plotted on reversed logarithmic scales. We notice that [Na+] and [Ca2+]
10
resemble the δ18O curve (Fig. 1b). This indicates that deposition of aerosol in Green-land directly depends on the local North Atlantic climate conditions. The vertical scales on Fig. 1A are adjusted so that the two curves match up at the Last Glacial Maximum (LGM). The match, reflecting the dominating atmospheric flow pattern, does not ex-tend over MIS 5, indicating a difference in the atmospheric flow regimes before and
15
after 75 kyr BP. [Na+] and [Ca2+] are generally increasing during the MIS 5 to MIS 4 transition, in line with the cooling trend. The long term trends, C0(Ca) and C0(Na), in concentrations are shown (shifted for clarity) on Fig. 1a as solid lines. There is a delay of a few kyr in the increase for the marine tracer (Na+) in comparison to the ter-restrial tracer (Ca2+), suggesting a geographical asynchrony in the onset of full glacial
20
conditions. Such an asynchrony was previously observed during GS-20 between the Greenland δ18O records and N. Pachyderma in the sub polar North Atlantic Ocean (McManus et al., 1994).
The increase in atmospheric tracer concentrations at 75 kyr BP could be indicating a more effective uplift of aerosols and an intensification of the atmospheric flow, probably
25
associated with changes in the hydrological cycle. For Ca2+the increase could further be an indicator for increased extent of semi-arid areas or decreased vegetation cover (Tegen, 2003) in the dust source area. Normalizing [Na+] and [Ca2+] with respect to
CPD
3, 285–299, 2007The climate of the late stage 5 in the
North Atlantic M.-L. Siggaard-Andersen et al. Title Page Abstract Introduction Conclusions References Tables Figures ◭ ◮ ◭ ◮ Back Close Full Screen / Esc
Printer-friendly Version Interactive Discussion
the long term trends, i.e.{Na}=[Na+]/C0(Na) and{Ca}=[Ca2+]/C0(Ca), and matching
these factors over LGM (Fig. 2a) we see that the match is established in the MIS 5 part of the record as well, except for the relatively warm sections of MIS 5, marked with grey bands. The tracer records in Fig. 1a and Fig. 2a has been filtered for comparison purposes. Figure 2b shows the unfiltered [Na+] record.
5
Another sign of a change in the atmospheric flow regime at around 75 kyr BP is found in the NGRIP record of insoluble particle size mode (Ruth et al., 2003) (Fig. 2c). The abrupt increase in particle sizes at around 75 kyr BP could be related to changed conditions at the dust source, changed intensity of the atmospheric flow or to changed scavenging parameters. Furthermore, in the GRIP deuterium (δD) and excess (d
=δD-10
8·δ18O) records (Masson-Delmotte et al., 2005) (Fig. 2d), remarkable different be-haviours are seen before and after 75 kyr BP. In rough terms δ18O and δD are related to the regional temperature while d is a measure of the temperature at the source (Jouzel et al., 1982). The striking anti-correlation between δD and d over the DO events after 75 kyr BP has been assigned to latitudinal changes in the position of the polar front,
15
and thus the dominating west wind flow patterns bringing precipitation from the North Atlantic ocean to Greenland (Masson-Delmotte et al., 2005). The high values of d prior to 75 kyr BP indicate a different moisture cycle with precipitation from a relatively warm sea surface in the North Atlantic.
2.2 Identification of two different atmospheric flow patterns
20
In order to investigate the atmospheric tracers, Na+ and Ca2+ in terms of the state of the atmospheric flow in more detail, we have analyzed their correlation in a scatter plot. In Fig. 3 it is seen that the concentrations plotted on logarithmic axes show a linear trend, which is not the same throughout the record. The data from the warm parts of MIS 5 (Fig. 3e) show the slope α=0.86±0.02 (determined on logarithmic data), which is
25
significantly larger than α=0.51±0.01 for the period after 75 kyr BP (Fig. 3c), while the intervening intervals (Fig. 3d) show the same slope as after 75 kyr BP. We interpret the
CPD
3, 285–299, 2007The climate of the late stage 5 in the
North Atlantic M.-L. Siggaard-Andersen et al. Title Page Abstract Introduction Conclusions References Tables Figures ◭ ◮ ◭ ◮ Back Close Full Screen / Esc
Printer-friendly Version Interactive Discussion
slope, α, between the logarithmic tracer concentrations as an indicator for the dominant transport route, so in the warm parts of MIS 5 we see a changed flow pattern, while in contrast, the sections of MIS 5 with the same slope as after 75 kyr BP have a flow pattern similar to the period after 75 kyr BP. This implies that the increasing trends in tracer concentrations across the MIS 5 to MIS 4 transition, resulting in the shift between
5
the red and the yellow data points in Fig. 3b, are not resulting from changes in the flow patterns but to other factors associated with the climate change. Very importantly, the slopes are nearly the same in the two distinct clusters of points corresponding to the stadial and interstadial states. This indicates that the atmospheric flow pattern did not change significantly during a DO event. The observation in the NGRIP ice core
10
of very little stadial-interstadial changes in atmospheric flow-patterns after 75 kyr BP, despite changing latitude of the moisture source, strongly suggests that the DO events observed in Greenland temperature proxies are not caused by changing atmospheric flow patterns but more related to temperature changes in the North Atlantic associated with changing (Atlantic) ocean flow.
15
2.2.1 Detailed comparison with other records
Looking into details in the climate of the late MIS 5 (Fig. 2), we see that the time sections of different Na-Ca correlations (marked with grey bands) are initiating simul-taneously with DO events, while their terminations are unrelated to DO events. The section containing GS-23 and GIS-23 correspond roughly to MIS 5c, while GS-22
cor-20
respond to MIS 5b and the succeeding grey bands roughly to MIS 5a. Interestingly, the other records in Fig. 2 show changed characteristics in the grey band sections as well, indicating that they are periods of a markedly different climate state: The unfiltered Na+ concentrations (Fig. 2b) show frequent spikes, indicating highly variable conditions for sea salt; the insoluble particle size modes (Fig. 2c) are significantly smaller, suggesting
25
a longer transport path for the Asian dust; the GRIP deuterium excess record (Fig. 2d) shows high values and very little variation, indicating a changed hydrological cycle; and the record from the sub polar North Atlantic shows very little or no IRD deposition
CPD
3, 285–299, 2007The climate of the late stage 5 in the
North Atlantic M.-L. Siggaard-Andersen et al. Title Page Abstract Introduction Conclusions References Tables Figures ◭ ◮ ◭ ◮ Back Close Full Screen / Esc
Printer-friendly Version Interactive Discussion
(Fig. 2e), indicating limited iceberg discharge from the Laurentide ice sheet. In the intervals between the grey bands, the records show features very similar to the period after 75 kyr BP, although their levels are changed, pointing to a climate state during these periods that is similar to the one after 75 kyr BP. The changed transport route for aerosol into Greenland during the warm parts of MIS 5 is likely to have been similar to
5
the present one i.e. following the west wind belt from the south west, while the glacial period in general have been dominated by a markedly different transport route, which is likely to have been north-westerly, following the northerly branch of a split jet-stream.
3 Discussion
Based on variations in NGRIP tracer concentrations and dust particle sizes we clearly
10
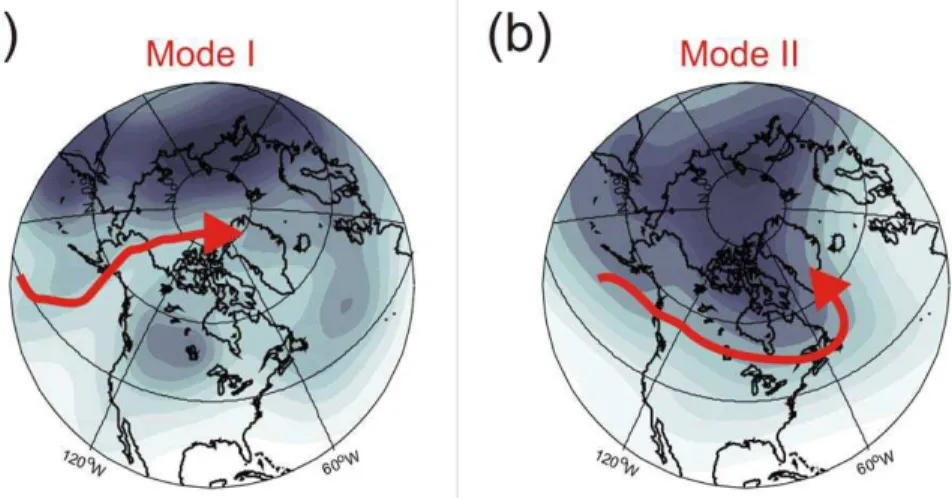
identify two different regional atmospheric modes, which we propose to be the fol-lowing: the first mode, Mode I, persisting after 75 kyr BP, is characteristic for a strong northern branch of a split jet stream pattern around the Laurentide ice-sheet. The dom-inant route for aerosols in Northern Greenland is, as indicated schematic in Fig. 4a by an arrow, along the northern branch from the North Pacific, across the polar ocean
15
and into Greenland, while precipitation is related to the southern branch, reflecting the latitudinal position in the deuterium excess values. An independent measure of the relatively short transport route for aerosol in Mode I is also indicated by relatively large dust grain sizes (Fig. 2c). The other mode, Mode II (Fig. 4b), persisted during MIS 5, intermittently interrupted by periods of Mode I. The atmospheric Mode II is closer
20
related to the present mode of circulation, where the jet stream follows the west wind belt across the North Atlantic, bringing marine and terrestrial aerosols to Greenland from the south west. This is accompanied by relatively low aerosol concentrations and independently reflected in smaller particle sizes than during Mode I. The unstable con-ditions for sea salt in Mode II, indicated by spikes in the unfiltered Na+ record (Fig. 2b),
25
could be indicating invasions of sea salt from a source that was not permanent during Mode II.
CPD
3, 285–299, 2007The climate of the late stage 5 in the
North Atlantic M.-L. Siggaard-Andersen et al. Title Page Abstract Introduction Conclusions References Tables Figures ◭ ◮ ◭ ◮ Back Close Full Screen / Esc
Printer-friendly Version Interactive Discussion
In order to exemplify the possible structure of the planetary wave pattern in the two modes, the 500 hPa geopotential height field for 30 December 1978 from the NCEP re-analysis (Kalnay et al., 1996) is shown together with the Mode I main trajectory in Fig. 4a. This was an anomalous weather situation for present day’s conditions, com-pared with the January, 1964 mean, shown together with Mode II in Fig. 4b, illustrating
5
that although the physical conditions for a permanent situation are not present, a split jet stream pattern with a branch migrating north of North America is physical possible. The proposed Mode I agrees with a recently simulated LGM winter atmospheric flow patterns (Bromwich et al., 2004).
The changed hydrological cycle during periods of Mode II, identified in the deuterium
10
excess record (Fig. 2d), may have made up an important feedback mechanism during the early phase of ice sheet growth, carrying larger amounts of precipitation from the North Atlantic into the Labrador Sea area. However, as suggested by the IRD deposi-tion record (Fig. 2e), growth of the Laurentide ice sheet has been inhibited during peri-ods of Mode II due to melting. Reduced melting during periperi-ods of Mode I, as indicated
15
by increased IRD depositions, may have been a more important feedback process favouring ice sheet growth at this stage. This could have been a direct consequence of a split atmospheric flow pattern, where less heat would be carried to Greenland with the southward shifted southern branch, compared to the westerly circulation in a non split configuration.
20
4 Conclusions
From the NGRIP tracer records, we have identified a new regional atmospheric mode (Mode II) in the climate in the beginning of the last ice age (MIS 5). This mode was interrupted by periods of glacial climate associated with Mode I. The climate changed permanently into this state around 75 kyr BP. The permanence of this change could
25
be related to a critical size of the Laurentide ice sheet, disfavouring the Mode II flow pattern. During MIS 5, changes between the two different modes of atmospheric
CPD
3, 285–299, 2007The climate of the late stage 5 in the
North Atlantic M.-L. Siggaard-Andersen et al. Title Page Abstract Introduction Conclusions References Tables Figures ◭ ◮ ◭ ◮ Back Close Full Screen / Esc
Printer-friendly Version Interactive Discussion
lation reflect changes in the size of the Laurentide ice sheet.
Acknowledgements. This work is a contribution to the North-GRIP ice core project, which is
directed and organized by the Department of Geophysics at the Niels Bohr Institute for As-tronomy, Physics and Geophysics, University of Copenhagen. It is being supported by funding agencies in Denmark (SNF), Belgium (FNRS-CFB), France (IFRTP and INSU/CNRS),
Ger-5
many (AWI), Iceland (RannIs), Japan (MEXT), Sweden (SPRS), Switzerland (SNF) and the United States of America (NSF).
References
Biscaye, P. E., Grousset, F. E., Revel, M., Van der Gaast, S., Zielinski, G. A., Vaars, A., and Kukla, G.: Asian provenance of glacial dust (stage 2) in the Greenland Ice Sheet Project 2
10
Ice Core, Summit, Greenland, J. Geophys. Res., 102, 26 765–26 781, 1997.
Bromwich, D. H., Toracinta, E. R., Wei, H., Oglesby, R. J., Fastook, J. L., and Hughes, T. J.: Polar MM5 simulations of the winter climate of the Laurentide Ice Sheet at the LGM, J. Climate, 17, 3415–3433, 2004.
Chapman, M. R. and Shackleton, N. J.: Global ice-volume fluctuations, North Atlantic ice-rafting
15
events, and deep-ocean circulation changes between 130 and 70 ka, Geology,27, 795–798, 1999.
De Angelis, M., Steffensen, J. P., Legrand, M., Clausen, H., and Hammer, C.: Primary aerosol (sea salt and soil dust) deposited in Greenland ice during the last climatic cycle: Comparison with east Antarctic records, J. Geophys. Res.,102, 26 681–26 698, 1997.
20
Emiliani, C.: Plestocene temperatures, J. Geol., 63, 538–578, 1955.
Fischer, H., Siggaard-Andersen, M.-L., Ruth, U., R ¨othlisberger, R., and Wolff, E.: Glacial/interglacial changes in mineral dust and sea salt records in polar ice cores: Sources, transport, and deposition, Rev. Geophys., in press, 2007.
Fuhrer, K., Wolff, E. W., and Johnsen, S. J.: Timescales for dust variability in the Greenland Ice
25
Core Project (GRIP) ice core in the last 100 000 years, J. Geophys. Res.,104, 31 043–31 052, 1999.
Greenland Ice-Core Project (GRIP) Members: Climate instability during the last interglacial period recorded in the GRIP ice core, Nature,364, 203–207, 1993.
CPD
3, 285–299, 2007The climate of the late stage 5 in the
North Atlantic M.-L. Siggaard-Andersen et al. Title Page Abstract Introduction Conclusions References Tables Figures ◭ ◮ ◭ ◮ Back Close Full Screen / Esc
Printer-friendly Version Interactive Discussion
Herron, M. M.: Impurity Sources of F−,Cl−, NO−3and SO2−4 in Greenland and Antarctic Precipi-tation, J. Geophys. Res.,87, 3052–3060, 1982.
Johnsen, S. J., Dahl-Jensen, D., Gundestrup, N., Steffensen, J. P., Clausen, H. B., Miller, H., Masson-Delmotte, V., Sveinbj ¨ornsdottir, A. E., and White, J.: Oxygen isotope and palaeotem-perature records from six Greenland ice-core stations: Camp Century, Dye-3, GRIP, GISP2,
5
Renland and NorthGRIP, J. Quat. Sci.,16, 299–307, 2001.
Jouzel, J., Merlivat, L., and Lorius, C.: Deuterium excess in an East Antarctic ice core suggests higher relative humidity at the oceanic surface during the last glacial maximum, Nature,299, 688–691, 1982.
Kalnay, E., Kanamltsu, M., Kistler, R., et al.: The NCEP/NCAR 40-year reanalysis project, Bull.
10
Am. Meteorol. Soc.,77, 437–471, 1996.
Kukla, G., McManus, J. F., Rousseau, D.-D., and Chuine, I.: How long and how stable was the Last Interglacial?, Quat. Sci. Rev.,16, 605–612, 1997.
Masson-Delmotte, V., Jouzel, J., Landais, A., Stievenard, M., Johnsen, S. J., White, J. W. C., Werner, M., Sveinbjornsdottir, A., and Fuhrer, K.: GRIP deuterium excess reveals rapid and
15
orbital-scale changes in Greenland moisture origin, Science,309, 118–121, 2005.
Mayewski, P. A., Meeker, L. D., Twickler, M. S., Whitlow, S., Yang, Q., Lyons, W. B., and Prentice, M.: Major features and forcing of high-latitude Northern Hemisphere atmospheric circula-tion using a 110 000-year-long glaciochemical series, J. Geophys. Res.,102, 26 345–26 366, 1997.
20
McManus, J. F., Bond, G. C., Broecker, W. S., Johnsen, S. J., Labeyrie, L., and Higgins, S.: High-resolution climate records from the North Atlantic during the last interglacial, Nature,371, 326–329, 1994.
North Greenland Ice-Core Project (NorthGRIP) Members: High resolution Climate Record of the Northern Hemisphere reaching into the last Glacial Interglacial Period, Nature,431, 147–
25
151, 2004.
Rousseau, D.-D., Kukla, G., and McManus, J.: What is what in the ice and the ocean?, Quat. Sci. Rev.,25, 2025–2030, 2006.
Ruth, U., Wagenbach, D., Steffensen, J. P., and Bigler, M.: Continuous record of microparticle concentration and size distribution in the central Greenland NGRIP ice core during the last
30
glacial period, J. Geophys. Res.,108, 4098, doi:4010.1029/2002JD002376, 2003.
Shackleton, N. J.: The last interglacial in the marine and terrestrial records. Proceedings of the Royal Society, London B, Biol. Sci.,174, 135–154, 1969.
CPD
3, 285–299, 2007The climate of the late stage 5 in the
North Atlantic M.-L. Siggaard-Andersen et al. Title Page Abstract Introduction Conclusions References Tables Figures ◭ ◮ ◭ ◮ Back Close Full Screen / Esc
Printer-friendly Version Interactive Discussion
Shackleton, N. J., S ´anchez-Go ˜ni, M. F., Pailler, D., and Lancelot, Y.: Marine Isotope Substage 5e and the Eemian Interglacial, Global Planet. Change,36, 151–155, 2003.
Siggaard-Andersen, M., Hansson, M., Fischer, H., et al.: A continuous IC glaciochemical record of the last glacial period from NGRIP ice core, Geophys. Res. Abstracts,8, 07796, 2006. Svensson, A., Biscaye, P. E., and Grousset, F. E.: Characterization of late glacial continental
5
dust in the Greenland Ice Core Project ice core, J. Geophys. Res.,105, 4637–4656, 2000. Tegen, I.: Modeling the mineral dust aerosol cycle in the climate system, Quat. Sci. Rev.,22,
1821–1834, 2003.
Waelbroeck, C., Labeyrie, L., Michel, E., Duplessy, J. C., McManus, J. F., Lambeck, K., Balbon, E. and Labracherie, M.: Sea-level and deep water temperature changes derived from benthic
10
foraminifera isotopic records, Quat. Sci. Res.,21, 295–305, 2002.
Walker, M. J. C., Bj ¨orck, S., Lowe, J. J., Cwynar, L. C., Johnsen, S., Knudsen, K.-L., Wohlfarth, B., and INTIMATE group: Isotopic ”events” in the GRIP ice core: A stratotype for the Late Pleistocene, Quat. Sci. Rev.,18, 1143–1150, 1999.
Woillard, G.: Abrupt end of the last interglacial s.s. in north-east France, Nature,281, 558–562,
15
1979.
CPD
3, 285–299, 2007The climate of the late stage 5 in the
North Atlantic M.-L. Siggaard-Andersen et al. Title Page Abstract Introduction Conclusions References Tables Figures ◭ ◮ ◭ ◮ Back Close Full Screen / Esc
Printer-friendly Version Interactive Discussion
Fig. 1. (a) The NGRIP Ca2+and Na+ records (Siggaard-Andersen et al., 2006) and their long
term trends, C0 (shifted for clarity). (b) The NGRIP δ18O record (North Greenland Ice-Core Project (NorthGRIP) Members, 2004) with numbers indicating Greenland Stadials (GS) and Interstadials (GIS). (c) N. Pachyderma (polar fauna) from the sub polar North Atlantic marine core V29-191 (McManus et al., 1994). (d) Tree Pollen from La Grande Pile in North East France (Woillard, 1979). (e) Benthic stacked δ18O (global sea level) (Waelbroeck et al., 2002), with labels indicating Marine Isotope Stages (MIS) and sub stages. The NGRIP data are shown on the ss09sea age scale (Johnsen et al., 2001). The chronology across the curves is shown with dashed lines and asynchronous onsets of the glacial climate in (b, c, and d) are marked with arrows.
CPD
3, 285–299, 2007The climate of the late stage 5 in the
North Atlantic M.-L. Siggaard-Andersen et al. Title Page Abstract Introduction Conclusions References Tables Figures ◭ ◮ ◭ ◮ Back Close Full Screen / Esc
Printer-friendly Version Interactive Discussion
Fig. 2. (a) The normalized concentrations{Na} and {Ca} shown on arbitrary logarithmic scales
and matched together. (b) The unfiltered [Na+] record. (c) The NGRIP record of particle size modes (Ruth et al., 2003). (d) The GRIP records of deuterium (δD, right axis) and deuterium excess (d , left axis) (Masson-Delmotte et al., 2005). (e) IRD (left axis) and N. Pachyderma (right axis) from the V29-191 core (McManus et al., 1994) synchronized to the ice core records using characteristic features in the N. Pachyderma record. All data are shown on the ss09sea age scale (Johnsen et al., 2001).
CPD
3, 285–299, 2007The climate of the late stage 5 in the
North Atlantic M.-L. Siggaard-Andersen et al. Title Page Abstract Introduction Conclusions References Tables Figures ◭ ◮ ◭ ◮ Back Close Full Screen / Esc
Printer-friendly Version Interactive Discussion
Fig. 3. (a) The [Ca2+] record with colouring indicating sections of different Na+– Ca2+
correla-tions. (b)–(e) [Na+] versus [Ca2+] scatter plots on log-axes with colouring according to (a).
CPD
3, 285–299, 2007The climate of the late stage 5 in the
North Atlantic M.-L. Siggaard-Andersen et al. Title Page Abstract Introduction Conclusions References Tables Figures ◭ ◮ ◭ ◮ Back Close Full Screen / Esc
Printer-friendly Version Interactive Discussion
Fig. 4. The dominant aerosol transport routes for the last glacial drawn schematic on examples
of present day mean 500 hPa geopotential height fields from the NCEP re-analysis (Kalnay et al., 1996): (a) Mode I together with the field from 30 December 1978. (b) Mode II together with the monthly mean from January, 1964.