HAL Id: halshs-02549886
https://hal.archives-ouvertes.fr/halshs-02549886v2
Submitted on 28 Apr 2020HAL is a multi-disciplinary open access archive for the deposit and dissemination of sci-entific research documents, whether they are pub-lished or not. The documents may come from teaching and research institutions in France or abroad, or from public or private research centers.
L’archive ouverte pluridisciplinaire HAL, est destinée au dépôt et à la diffusion de documents scientifiques de niveau recherche, publiés ou non, émanant des établissements d’enseignement et de recherche français ou étrangers, des laboratoires publics ou privés.
reconstruction of channel evolution and facies
distributions in fluvial meander-belt deposits
Marion Parquer, Na Yan, Luca Colombera, Nigel Mountney, Pauline Collon,
Guillaume Caumon
To cite this version:
Marion Parquer, Na Yan, Luca Colombera, Nigel Mountney, Pauline Collon, et al.. Combined in-verse and forward numerical modelling for reconstruction of channel evolution and facies distributions in fluvial meander-belt deposits. Marine and Petroleum Geology, Elsevier, 2020, 117, pp.104409. �10.1016/j.marpetgeo.2020.104409�. �halshs-02549886v2�
1
Combined inverse and forward numerical modelling for reconstruction
of channel evolution and facies distributions in fluvial meander-belt
deposits
Marion PARQUER
a, b, Na YAN
c, Luca COLOMBERA
c, Nigel P. MOUNTNEY
c, Pauline COLLON
b,
Guillaume CAUMON
ba – Geological survey of Canada, Ottawa, ON K1A 0E9, Canada
b – Université de Lorraine, CNRS, GeoRessources, ENSG, F-54000 Nancy, France
c – Fluvial & Eolian Research Group, School of Earth and Environment, University of Leeds, Leeds, LS2 9JT, UK
Abstract
The sedimentary record of meandering rivers contains a diverse and complex set of lithological heterogeneities, which impact natural resource management. Different methods exist to model such accumulated successions present in the subsurface by integrating knowledge of system evolutionary behaviour and geometries visible on seismic time or stratal slices. With reference to case-study examples, we review, discuss and employ two of these methods: (i) ChaRMigS generates possible scenarios for channel evolution and meander cut-offs by a reverse migration process; (ii) PB-SAND is a forward stratigraphic model which simulates fluvial point-bar geometry and facies distributions from known palaeo-channel geometries. We introduce a workflow to demonstrate how these two methods can be applied in combination to predict fluvial meander-belt facies distributions, using a subsurface dataset on a Pleistocene succession from the Gulf of Thailand where abandoned channels are visible on seismic time slices, but for which bar-accretion geometries and the exact timing of channel abandonment are unclear. Results show the value of a combined modelling approach to automate the stochastic generation of facies distributions constrained by seismic interpretations.
Keywords: fluvial, channel, point bar, facies, abandoned meander, simulation
Received: 10 December 2019 / Accepted: 18 April 2020
Published online in Marine and Petroleum Geology: 27 April 2020 DOI: 10.1016/j.marpetgeo.2020.104409
2
1. Introduction
The deposits of meandering river systems are important hosts for natural resources including water, hydrocarbons and ore minerals (Fitterman et al., 1991, García-Gil et al., 2015, Mayall et al., 2006). In subsurface successions, reflection seismic imaging is a primary tool used to document the architecture of reservoirs composed of the deposits of meandering channel belts (Maynard & Murray, 2003, Reijenstein et al., 2011). Depending on their resolution, seismic images commonly reveal (i) the last (pre-avulsion) channel path, (ii) remnant meander-loop fragments delineated by abandoned channel elements (Lonsdale & Hollister, 1979; Erskine et al., 1992), and (iii) remnant point-bar fragments, some with associated accretion patterns evident in planview (e.g., Maynard & Murray, 2003; Hubbard et al., 2011; Durkin et al., 2018a). Abandoned channel paths are commonly imaged clearly on seismic time or stratal slices, since they tend to be infilled with fine-grained sediment (mudstone) that exhibits a marked acoustic-impedance contrast relative to adjacent sand-rich point-bar deposits (Posamentier & Kolla, 2003; Veeken, 2006; Issautier et al., 2014; Miall, 2014). Assessing the juxtaposition of preserved architectural elements is key to understand the history of channel-belt evolution. The nature of channel cut-offs and the partial overprinting of abandoned channel and bar elements can commonly be used to reconstruct the relative chronology of the evolution of a channel belt (Durkin et al., 2018a; Parquer et al., 2019). Where architectural features of meandering channel belts – for example architectural elements composed of palaeo-channel loops – can be observed in planform, it is possible to use such observations to condition models for prediction of facies architectures. This can be done in the frame of stochastic modelling. The deposits of meandering fluvial systems are characterised by strong lithological heterogeneities at different spatial scales, which makes prediction of subsurface sedimentary architecture and natural resource characterization challenging (Fustic et al., 2012). At the scale of architectural elements, sand-prone point-bar elements are commonly partitioned by mud-sand-prone abandoned channel deposits (Musial, et al., 2012; Colombera et al., 2017). These types of architectural elements are themselves composed internally of various lithofacies, which commonly occur in a predictable order. Importantly, for these types of succession, mud-prone packages of strata, or individual mud-prone beds that may only comprise a volumetrically minor part of an overall point-bar element, can significantly partition sand-dominated bar deposits (Nanson, 1980; Thomas et al., 1987, Pyrcz et al., 2009; Cojan et al., 2005; Jackson et al., 2009; Labrecque et al., 2011; Colombera et al., 2018). This is notably the case where thin but laterally continuous and inclined mudstone beds are draped over sandy lateral-accretion units within point-bar elements (Yan et al., 2019). Conversely, mud-dominated abandoned channel elements commonly have thin, sand-rich components in their basal-most part, which permit the flow of fluids through overall low-permeability channel-plug deposits (Donselaar & Overeem, 2008). Consequently, the internal distribution of lithofacies inside these bodies exerts a major control on porous fluid-flow pathways (Bridge, 1982; Brownlie, 1983; Sun et al., 2001a, 2001b; Willis & Sech, 2019a, 2019b). Knowledge of the expected internal facies arrangement within architectural elements is therefore an essential requirement for effective groundwater or hydrocarbon reservoir evaluation (e.g., Jackson & Muggeridge, 2000; Jackson et al., 2009). However, in many subsurface settings, internal facies arrangements and proportions are at best only poorly constrained by sparse wells that provide wireline or core data (Miall, 1994; Kostic & Aigner, 2007; Musial et al., 2012). In such cases, databases are commonly employed to provide information about the distributions of facies known from analogous modern rivers and outcropping successions (e.g., Colombera et al., 2012a, 2012b, 2013; Colombera & Mountney, 2019). Such databases are used to inform reservoir models that seek to depict the expected distribution of facies and elements within subsurface successions (Arnold et al., 2019).
In general, these static reservoir models represent the internal anatomy, lithological configuration and petrophysical properties of hydrocarbon reservoirs as cell-based corner-point reservoir grids (Farmer,
3 2005; Ringrose & Bentley, 2015). For each reservoir, or sector thereof, the uncertainty relating to geological and petrophysical features is usually addressed by generating multiple equiprobable models built using stochastic modelling methods (Caumon, 2018). The approaches that are typically used to model the distributions of meander-belt facies associations in subsurface fluvial successions consist of general-purpose geostatistical modelling tools, such as those based on two-point statistics (e.g., sequential indicator simulations; Journel & Alabert, 1989; Deutsch & Journel, 1992) or on multi-point statistics (e.g., Srivastava, 1994; Strebelle, 2002; Straubhaar & Malinverni, 2014; Arnold et al., 2019; Calderon et al., 2019). However, pixel-based geostatistical methods commonly struggle to reproduce the geometry and connectivity of complex facies configurations in three dimensions (Renard et al., 2011; Rongier et al., 2016).
Alternatively, object-based methods can be used to reproduce complex sedimentary architectures through the distribution of objects that represent sedimentary bodies within a modelled volume, for example channel bodies of given geometry (e.g. width, length, sinuosity) (Deutsch & Wang, 1996; Keogh et al., 2007; Hassanpour et al., 2013; Ruiu et al., 2016; Rongier et al., 2017a; Colombera et al., 2019). In these methods, each object is randomly sampled and modelled independently from the others combining statistical point processes and Monte Carlo sampling of shape parameters. In these approaches, conditioning to well or seismic data is notably challenging when the observation density is large relative to the sizes of the simulated objects (Wang et al., 2018). In classical object-based simulation, architectural elements are also modelled independently one from another, meaning that natural depositional processes are not captured by the simulation algorithm.
This shortcoming motivates another family of methods that seeks to mimic the geological processes producing specific types of sedimentary deposits; these are so-called dynamic, event-based or rule-based approaches (Pyrcz et al, 2015). Several variants of this approach have been proposed for modelling the architecture of meandering channel systems, such as those of fluvial and submarine channels. Among these, process-based methods seek to model physical deposition by a forward geometric evolution depending on curvature of meanders (e.g., Ikeda et al., 1981; Cojan et al., 2005; Lemay et al, 2020; Sylvester et al., 2019). Descriptive-based methods, by contrast, are concerned with the reproduction of the geometry generated by the sedimentary processes (Labourdette et al., 2006; Pyrcz et al., 2009; Ruiu et al., 2016; Rongier et al., 2017b). For these dynamic methods, stratal configurations are modelled with consideration of how the system evolves through time. However, a common challenge for meandering channelized systems is the difficulty in making the models fit closely to fragmentary observations of the channel remnants, such as abandoned meanders that are evident on seismic images (Labourdette et al., 2006; Ruiu et al., 2015, Rongier et al., 2017a; the ChaRMigS method of Parquer et al., 2017; the PB-SAND method of Yan et al., 2017). A solution to this is offered by inverse (i.e., reverse) stratigraphic modelling methods (e.g., ChaRMigS method of Parquer, et al., 2017), which honour observations of abandoned meanders by integrating them into a vector-based modelling structure that can be used to determine the temporal evolution of a river channel. In all cases, the question of uncertainty assessment remains central and calls for considering multiple realizations of reservoir geometry (Pyrcz et al., 2015; Caumon, 2018; Arnold et al., 2019). Overall, these rule-based approaches have been shown to be a promising way to address the shortcomings of pixel-based and object-based methods, in particular towards honouring all quantitative spatial observations while maintaining consistent relationships between the simulated architectural elements. However, only a limited number of these methods (e.g., PB-SAND method of Yan et al., 2017) permit simulation of the distribution of facies inside the reconstructed architectures.
The aim of this study is to highlight how two numerical modelling approaches – ChaRMigS (Parquer et al., 2017) and PB-SAND (Yan et al., 2017), can be jointly employed to model the internal architecture of the accumulated deposits of meandering fluvial successions, with consideration of how this architecture
4 varies in relation to the likely evolutionary scenarios of the formative river system. The modelling approach seeks to account for deposition and erosion over time and space as a fundamental control on preserved sedimentary architecture. Specific research objectives are as follows: (i) to compare the contexts of application, the inputs and outputs, and the relative merits and limitations of two modelling approaches used to predict the sedimentary architecture of meandering fluvial channel belts, based on inverse and forward modelling, respectively; (ii) to illustrate how the two modelling approaches can be linked and used sequentially to obtain several fully stochastic realizations of the facies architecture of large fluvial meander-belt successions whose channel fills are imaged in three-dimensional seismic datasets.
2. Methods
The ChaRMigS and PB-SAND models both use geometric, vector-based approaches (Parquer, et al., 2017; Yan et al., 2017). Characteristics of the two modelling methods are described below and summarized in Table 1.
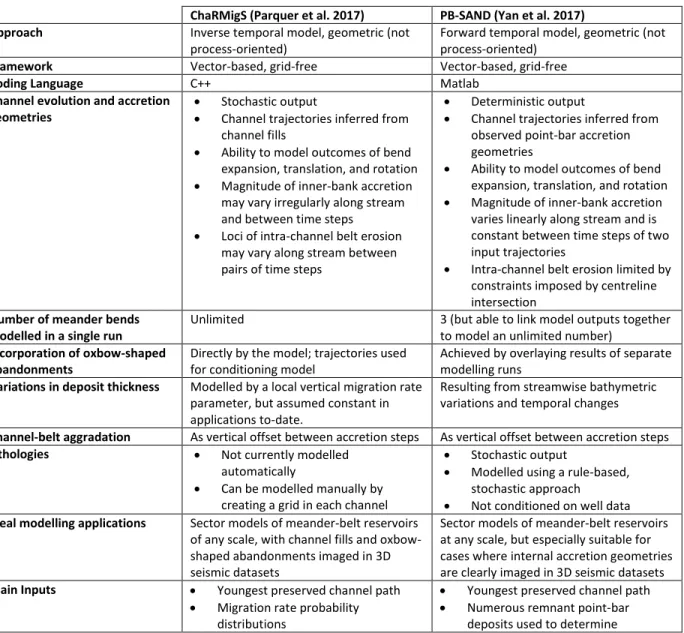
Table 1: Summary of main characteristics and differences between the two modelling approaches used in this work.
ChaRMigS (Parquer et al. 2017) PB-SAND (Yan et al. 2017) Approach Inverse temporal model, geometric (not
process-oriented)
Forward temporal model, geometric (not process-oriented)
Framework Vector-based, grid-free Vector-based, grid-free
Coding Language C++ Matlab
Channel evolution and accretion geometries
• Stochastic output
• Channel trajectories inferred from channel fills
• Ability to model outcomes of bend expansion, translation, and rotation • Magnitude of inner-bank accretion
may vary irregularly along stream and between time steps
• Loci of intra-channel belt erosion may vary along stream between pairs of time steps
• Deterministic output
• Channel trajectories inferred from observed point-bar accretion geometries
• Ability to model outcomes of bend expansion, translation, and rotation • Magnitude of inner-bank accretion
varies linearly along stream and is constant between time steps of two input trajectories
• Intra-channel belt erosion limited by constraints imposed by centreline intersection
Number of meander bends modelled in a single run
Unlimited 3 (but able to link model outputs together to model an unlimited number)
Incorporation of oxbow-shaped abandonments
Directly by the model; trajectories used for conditioning model
Achieved by overlaying results of separate modelling runs
Variations in deposit thickness Modelled by a local vertical migration rate parameter, but assumed constant in applications to-date.
Resulting from streamwise bathymetric variations and temporal changes
Channel-belt aggradation As vertical offset between accretion steps As vertical offset between accretion steps
Lithologies • Not currently modelled automatically
• Can be modelled manually by creating a grid in each channel
• Stochastic output
• Modelled using a rule-based, stochastic approach • Not conditioned on well data
Ideal modelling applications Sector models of meander-belt reservoirs of any scale, with channel fills and oxbow-shaped abandonments imaged in 3D seismic datasets
Sector models of meander-belt reservoirs at any scale, but especially suitable for cases where internal accretion geometries are clearly imaged in 3D seismic datasets
Main Inputs • Youngest preserved channel path • Migration rate probability
distributions
• Youngest preserved channel path • Numerous remnant point-bar
5
• Cut-off rate probability distribution • Abandoned meander loop paths
trajectories of channel-paths at key times
• Scroll-bar number and migration rate between two consecutive
trajectories • Facies associations • Facies trends
See Fig. A.1 in Yan et al. (2017) for a fuller account of input parameters.
Outputs Multiple scenarios of reconstructed 3D channelized system geometry
3D modelled geometry of fluvial meander-belt and internal facies composition of point-bar and related architectural elements in 3D
2.1 ChaRMigS approach
The Channel Reverse Migration Simulation (ChaRMigS) model (Parquer et al., 2017) uses an inverse stratigraphic modelling approach to propose a wide range of possible reconstructed temporal evolutions of meandering channel planforms, which could have originated via several possible migration patterns. These migration patterns can be the products of meander-bend expansion, translation and rotation (Daniel, 1971; Hickin, 1974; Holbrook, 2017), and these processes can be punctuated by channel abandonment, or by neck or chute cut-off of individual meander loops.
ChaRMigS simulates channel migration patterns in the form of time-lapse channel trajectories. Multiple stochastic outputs of temporal channel evolution are generated for each set of input parameters, consisting of the centreline of the youngest active channel and, optionally, of centrelines associated with multiple oxbow-shaped abandoned meander loops, as well as probability distributions of migration offset and cut-off rates. Both distributions can be inferred based on analogues or knowledge of the system under study. The spatial organization of the abandoned meanders is used to determine likely histories of planform evolution of the channel belt, with consideration of gradual channel migration and meander-bend cut-off processes. Abandoned meander loops are integrated into the output scenarios of channel evolution in different orders, which are consistent with potentially different bend cut-off chronologies. The global chronology of bend cut-off emerges from the simulation process: at every simulation time step, the probability of integrating a particular abandoned meander loop in the channel trajectory is computed, based on the current floodplain geometry; the older channel trajectory corresponding to the next simulation time step then reflects gradual migration and integrates loops which have been randomly selected by Monte Carlo sampling (Parquer et al., 2019). A history of events can also be imposed when the chronology of abandonment is known (Parquer et al., 2017).
The channel trajectories simulated by ChaRMigS appear naturally sinuous, therefore tend to result in irregular streamwise variations in the magnitude of accretion and erosion. In ChaRMigS, temporal and spatial variations in the thickness of channel deposits resulting from along-channel bathymetric variations are included as model parameters, but are not reproduced in the outputs presented herein for the sake of simplicity. Channel-belt aggradation can be modelled as a global or vertical offset of channel centrelines between accretion steps. Establishing a close fit to accretion geometries (e.g., as evidenced by scroll bars) may be achieved in principle by interactive NURBS editing (Ruiu et al., 2015), but has not been considered in the ChaRMigS workflow. Facies simulation is not incorporated in this modelling approach.
6
2.2 PB-SAND approach
The Point-Bar Sedimentary Architecture Numerical Deduction (PB-SAND) model (Yan et al., 2017) uses a forward geometric-based modelling approach. This model has been devised as a tool for the reconstruction and prediction of the complex spatio-temporal evolution of fluvial meanders, their generated 3D lithofacies distributions and resulting heterogeneity. The PB-SAND model permits the reconstruction of point-bar geometries and internal sedimentary architectures using a deterministic approach to simulate accretion patterns as they evolve over a series of time steps (Yan et al., 2019). The input trajectories that control the planform morphology of point bars can be digitized from seismic images, from remotely sensed images of modern systems, or devised based on field observations of ancient outcropping successions. Output channel trajectories are linearly interpolated and extrapolated between two input trajectories, and are therefore deterministic (i.e., a single solution is obtained for each set of input trajectories). The approach can be used to model up to three consecutive meander bends in a single run. Multiple model outputs can then be chained together to model larger river reaches (Yan et al., 2020). The accretion patterns between two successive time steps are extrapolated based on the type of meander transformation and a specified number of accretion increments. As a result, different accretion patterns can be generated, arising from any combination of meander expansion, rotation, and downstream translation (cf. Daniel, 1971; Ghinassi et al., 2014; Holbrook, 2017).
The PB-SAND model additionally permits the stochastic simulation of the internal facies arrangement of point bars developed through different modes of meander transformation (expansion, translation, rotation). This is done using a rule-based method that is derived from and constrained by known examples of fluvial meandering systems (Yan et al., 2019). Trends of fining upwards, fining outwards through meander expansion, and fining downstream beyond a meander apex and in concave-bank areas, can all be reproduced, for example (see details in Yan et al., 2017). Parameters that control the geometry of facies transitions within accretion packages (e.g., inclination of boundaries) are stochastically drawn from predefined probability curves (e.g., Gaussian distributions; see Fig. A.1 in Yan et al., 2017). Variations in the thickness of channel deposits might result from streamwise bathymetric variations (from riffle to pool) and temporal changes (in sinuosity or hydraulic geometry). Aggradation of the channel floor can also be modelled (Yan et al., 2020). In PB-SAND, incorporation of abandoned cut-off meander loops is achieved through integration of the outputs of separate modelling steps. It is difficult to incorporate abandoned meander loops specifically in a temporal sequence, because the evolutionary trajectories of the point-bar elements (for example, as sometimes recorded in accretion patterns observed in seismic slices) commonly have been heavily overprinted by more recently developed point-bar elements. The modelling approach of PB-SAND can therefore be used to generate stochastic models of the internal facies architecture of meander belts, but only in cases where the planview accretion geometries of the channel belt can be inferred with confidence, as is sometimes the case with 3D seismic datasets (Colombera et al., 2018; Yan et al., 2019).
2.3 FAKTS database
The Fluvial Architecture Knowledge Transfer System (FAKTS; Colombera et al., 2012b) is a relational database storing descriptions of the sedimentary architecture of many modern river systems and ancient fluvial successions, themselves classified on several parameters (e.g., climate, age, drainage area). FAKTS currently contains data from over 300 sedimentological case studies, and incorporates data derived from both original field studies and the published literature. FAKTS provides a quantitative characterization of sedimentary architectures at multiple scales (e.g., lithofacies, point bars, channel belts). This database serves to provide input parameters to PB-SAND, relating to the geometry of architectural elements (e.g., bar and channel-fill dimensions) and to the proportion and geometry of lithofacies (e.g., proportion, thickness and length of mud drapes).
7
3. Applied comparisons of ChaRMigS and PB-SAND
3.1 Channel belt of the Oulanka River (Finland)
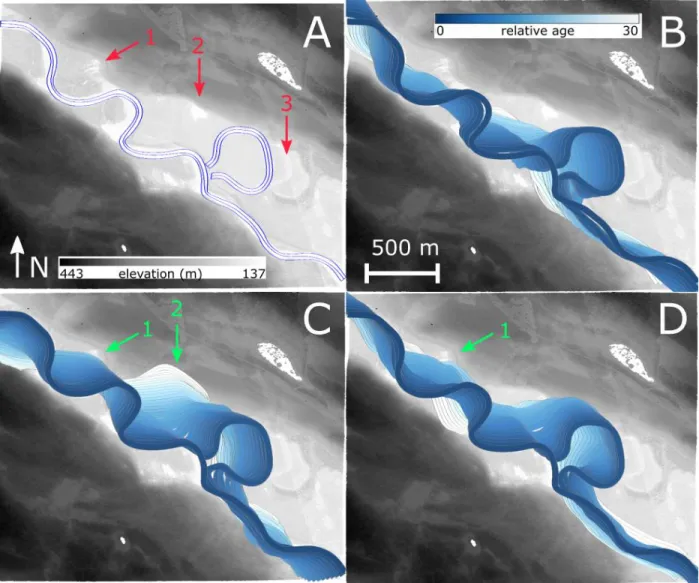
To demonstrate an application of the two modelling approaches considered in this work, ChaRMigS and PB-SAND were applied separately to model the planform evolution of a stretch of the meandering channel belt of the present-day Oulanka River (Finland), which occupies a pre-glacial valley (Koutaniemi, 1980). The planform evolution can be inferred from a cursory analysis of the valley topography, as seen in a LiDAR acquisition from National Land Survey of Finland and of satellite imagery (Figure 1A). In addition to the current river path and an abandoned meander loop, the high-resolution topographic dataset allows the identification and digitization of scroll topographies (see the red arrows 1 and 2 and 3 in Figure 1A).
Figure 1 A- LiDAR data of the Oulanka River, Finland. One abandoned meander shape can be clearly identified and used to constrain the reverse migration. Three areas with marked scroll topographies (arrows 1, 2 and 3) are clearly
observable, but not used as input constraints in the ChaRMigS method
(https://tiedostopalvelu.maanmittauslaitos.fi/tp/kartta?lang=en). B- C- D- Three stochastic equiprobable realizations obtained using only the ChaRMigS method in 30 time steps with a probability distribution of horizontal
offset equal to a Gaussian probability distribution G (36,2.62 [m]), and a probability distribution of cut-off equal to triangular probability distribution (min = 0, mode = 1, max = 2 at a given time step). The relative age is expressed
8 Three equiprobable ChaRMigS reconstructions are presented (Figure 1B-D), each showing different possible river-migration histories. The counter-point bars present on the western part of the abandoned meander (Figure 1A, red arrow number 1) are reconstructed in part by the realizations in Figure 1C,D (green arrow 1). However, none of the reconstructed geometries fits to the scroll-bar patterns of point bars observed on the eastern side of the abandoned meander (Figure 1A, red arrow number 3). Furthermore, on the northern part of the study area, the observed scroll patterns (Figure 1A, red arrow number 2) are also not well reproduced by the model. For this area, only one of the three realizations (Figure 1C, green arrow 2) reproduces channel migration by translation. These two limitations are due to the reverse-migration vectors, which attract the main channel path upstream and towards the centreline in order to reproduce the most likely migration patterns (Parquer et al, 2017). In the ChaRMigS approach, the point bars observed on the eastern side (red arrow number 3) could only be reproduced by significantly shifting or enlarging the range of the migration offset probability distribution, or by generating an additional abandoned meander bordering the point bars.
In parallel to the ChaRMigS application on this dataset, and in order to enable a comparison with ChaRMigS outputs, PB-SAND was used to reproduce the accretion history of the north-western part of the channel belt, on the basis of three manually digitized channel trajectories (corresponding to the current river course and to two earlier river paths inferred from observed scroll geometries). Downstream-translating point bars are modelled. This point-bar type is typical of meandering rivers developed in confined valleys where bend expansion is inhibited by confinement by the valley walls (Smith et al., 2009; Nicoll & Hickin, 2010). The modelled scroll-bar patterns match closely those that can be identified in the LiDAR image (Figure 2A).
9
Figure 2 Application of the PB-SAND method to the LiDAR data of the Oulanka River on the basis of three observed channel stages detailed in A. Realization detailed in B for point bars stage 1 (t1 - t2) and C for point bars stage 2
(t1-t2-t3).
This case study highlights how the two modelling approaches provide different insights in the channelized system in terms of both geometry and dynamics. ChaRMigS proposes multiple scenarios of how a meander is abandoned and its relation to the chronology of cut-offs during channel evolution, the style of meander-bend transformation, and the influence of these events on the planview geometries of meander-belt deposits. By contrast, PB-SAND produces a deterministic model of planform channel evolution that aligns with observations of local point-bar accretion geometries arising from specified histories of channel migration, so that it becomes possible to predict the expected lithological heterogeneity (e.g., sandier point bars vs muddier counter-point bars; cf. Smith et al., 2009; Durkin et al., 2018b) from styles of accretion (e.g., meander expansion vs downstream translation).
t1 t2 t3 E 29°36'00'' N 6 6 ° 1 8 '3 6 ''
N
500 mA
B
C
X (m) X (m) Y ( m ) Y ( m )10
3.2 Pleistocene succession of the Gulf of Thailand
In a second case-study example, ChaRMigS and PB-SAND were again applied separately, in this case to model the planform evolution of a meandering channel belt seen on a time slice from a 3D reflection-seismic survey of a Pleistocene succession from the Gulf of Thailand (Reijenstein, et al., 2011). FAKTS was used to provide input parameters on channel-bar scaling relationships and on the proportions of lithologies, for modelling the geometry and facies distributions of point-bar and channel-fill deposits. The seismic data clearly reveals the planform bar geometry of the channel belt, within which the path of the last abandoned (avulsed) channel can be recognized, together with abandoned meanders that have undergone cut-offs. The internal accretion geometry of the point bars can be mapped to infer the paths taken through time by the river channel. Some of the inputs of ChaRMigS and PB-SAND are the same; for example, the input channel trajectory immediately prior to avulsion, digitized directly from the seismic image, as well as the channel width.
11
Figure 3 A- Seismic image of a palaeo-channelized system from the Gulf of Thailand (Reijenstein et al., 2011). B- Input trajectories of the last avulsed channel path and of two abandoned meander loops. Two counter point-bar domains are clearly observable in the seismic image (labelled 1 and 2) and are used to discuss realization quality (see text). C-, D-, E- Three stochastic equiprobable realizations of reconstruction of the palaeo-channelized system
made using only the ChaRMigS inverse model.
Results from ChaRMigS are shown in Figure 3. The three reconstructions of the channelized system (Figure 3C-E) represent different stochastic realizations generated with ChaRMigS, each in 30 steps with a Gaussian probability distribution of offset of horizontal migration (mean = 333 m, standard deviation = 166 m) and a triangular probability distribution of channel cut-off (minimum = 0, mode = 1, maximum = 2 [number of cut-offs per time step], at a given time step). For each realization, the actual values are
12 randomly sampled from these distributions, as described in Parquer et al. (2017). These realizations vary with regards to the direction and magnitude of channel migration (offset between trajectories) between any two time steps, which thus implies variable downstream channel migration relative to the degree of bend expansion. In some realizations, counter-point bars develop, as observed on the seismic image (see red circle 1 in B and model output in C, D and E), but also in areas where they are not visible (see red circle 2 in B and model output in C, D and E). This emerges from the stochastic nature of the ChaRMigS method, which samples the reverse migration rate randomly for each half-meander. The two abandoned meanders (Figure 3) are integrated for each realization in the same relative order but not necessarily at the same modelling time steps. The chronology according to which abandoned loops are integrated in the model is due to the integration probability inferred by the geometry and organization of the channel belt and updated at each time step (Parquer et al., 2019): on the seismic slice, meander loop A (Figure 3B) displays a channel trajectory that is more perpendicular to that of meander loop B, and is located closer to the main channel path than meander loop B (Figure 3B). This makes loop A a better candidate for integration in the reverse migration process than meander loop B, in the first stages of reconstruction. This is because the probability of integration is directly related to the angular separation between the main channel path and the meander loop, as well as the distance between the two (Parquer et al., 2019). Therefore, consistency in the relative chronology of cut-off occurrence reflects limited uncertainty in the actual relative timing. The absolute timing of cut-off integration is determined stochastically in the algorithm used to simulate the reverse migration of the main channel path for each time step. The probability of integration of an abandoned meander is recomputed at each time step and controlled by the random sampling migration offset. Therefore, the relative location of the reverse migrated channel path will be different for each realization due to difference in the integration probability.
13
Figure 4 PB-SAND modelling results of the seismic image from the Gulf of Thailand (Reijenstein et al., 2011) presented in Figure 3A. A- Input lines for PB-SAND reconstruction. B- Modelled accretion surfaces between two
consecutive input trajectories are denoted from blue to red in a temporal sequence. C- Cross-sections of the reconstruction shown in B. The reconstruction here is based on four channel-path centrelines. Then, a simulation of
the internal facies architecture of the point-bar deposits has been undertaken to reveal the expected facies distribution within the reconstructed system. The cross sections depict the expected spatial distribution of six different facies within the point-bar elements. Facies distributions are determined from distributions from known
natural point-bar examples stored in the FAKTS database.
The PB-SAND model has also been employed separately to reconstruct the same channelized system by using the point-bar accretion geometries evident in the seismic imagery and which reflect the evolutionary history of the formative river channel, together with the trajectory of the last (pre-avulsion) channel path (Figure 4A). An overall fining-upward facies arrangement – as is common for the deposits of these types of meandering fluvial systems (Nanson, 1980) – is used to depict the internal facies distribution within the modelled lateral-accretion packages, as shown in cross sections (Figure 4C). Contrasting facies proportions have been selected for deposits of point-bars (gravel: 10%, coarse sand: 20%, medium sand: 40%, fine sand: 10%, silt: 10%, clay-rich mud: 10%) and counter-point-bars (gravel: 10%, coarse sand: 10%, medium sand: 10%, fine sand: 20%, silt: 40%, clay-rich mud: 10%). These values of facies proportions are taken
14 from the FAKTS database of geological analogues and are representative of meander belts of this scale (Colombera et al., 2013). The proportion for each facies varies systematically between -5 % to +5%, to mimic inherent natural variability (Yan et al., 2017). The modelled facies architecture can be rendered in cross sections (Figure 4C) that permit visualisation of the sedimentary heterogeneity created by the different migration patterns. For example, the finer counter-point-bar deposits in the left-hand part of cross section A-A’, and the transition from sandier point-bar deposits to finer counter-point-bar deposits in cross section F-F’ are reconstructed in a similar way to that observed on the seismic image and reproduced by ChaRMigS in Figures 3D and E. The 3D geometries of lateral accretion packages and the facies distribution of point-bar deposits is similar to those of comparable outcrop successions (e.g., Ghinassi et al., 2014, 2016; Durkin et al., 2018b).
3.3 Considerations on the modelling approaches
Based on the separate application of the two modelling techniques to the two datasets presented above, the weaknesses and strengths of the two approaches can be discussed. The case-study example presented above highlights how PB-SAND is able to model meander-belt sedimentary architectures in 3D using input channel trajectories that can be inferred from clearly identifiable point-bar accretion geometries, in situations where these geometries can be seen in 3D seismic surveys. However, integration of abandoned meanders cannot be achieved directly in PB-SAND, and the trajectories of these meander loops cannot be used to condition the model outputs. This can, however, be achieved using ChaRMigS, which produces a range of possible planform geometries associated with equiprobable scenarios of channel evolution while being conditioned to abandoned meander loops. As such, the two modelling methods can be used in a complementary manner as demonstrated in the combined workflow that is presented next.
4. Application of the combined workflow: a case study (Pleistocene,
Gulf of Thailand)
4.1 Workflow and dataset
The ChaRMigS and PB-SAND modelling approaches each have advantages and limitations. This naturally leads us to propose a combined use of both methods following the workflow illustrated in Figure 5. The main idea of this workflow is to generate scenarios of palaeo-channel evolution from incomplete observations on a seismic slice using ChaRMigS, then to use the channel trajectories in PB-SAND to generate facies models, using parameters gathered from the FAKTS database. We employed this approach to generate 3D models of the internal facies architecture of meander-belt deposits imaged in seismic data from the Pleistocene of the Gulf of Thailand. In this work, sets of channel trajectories representing stochastic outputs of ChaRMigS have been smoothed, trimmed and loaded as input into PB-SAND, together with analogue data relating to the geometry of element and facies proportions from the FAKTS database (see below).
15
Figure 5 Workflow combining ChaRMigS and PB-SAND, together with inputs from 3D seismic data and FAKTS database analogues, to create stochastic models of meander-belt architectures.
The proposed workflow is applied to show how the ChaRMigS and PB-SAND modelling approaches, augmented and supported by information from the FAKTS database, can be used to reveal complementary insights into the evolution of fluvial systems and their preserved meander-belt architectures. This case study was chosen to demonstrate how the two modelling approaches can be used in combination to provide a novel workflow for subsurface modelling (Figure 5). Such an approach is especially useful for situations in which channel belts of meandering fluvial systems (including associated channel fills) are recognizable in 3D seismic surveys, but where internal point-bar accretion geometries cannot be discerned. In this case, ChaRMigS is applied to generate multiple stochastic realizations of the internal accretion history of a meander belt in a way that is compatible with the observable geometries of abandoned channel fills seen on a seismic time or stratal slice. The ChaRMigS model outputs channel trajectories of different stochastic realizations, which can then be transferred as input to PB-SAND for simulation of the facies heterogeneities. Such a situation is exemplified in a 3D reflection seismic time slice from a meander belt sitting inside a valley fill in the Pleistocene succession of the Gulf of Thailand (Reijenstein et al., 2011). In the considered time slice (Figure 6A), the internal anatomy of individual point-bar elements cannot be resolved from the seismic data alone. Therefore, channel trajectories with which to attempt the direct application of PB-SAND cannot be inferred with confidence. In this case, five abandoned meanders that have undergone cut-off prior to channel-belt abandonment (Figure 6A) have been used to condition ChaRMigS to generate possible planform evolution histories. This particular time slice has been selected for illustrating this combined workflow for two specific reasons: (i) it reveals substantial architectural complexity of the channelized system (i.e., high number of abandoned meander loops with highly sinuous channel fills); and (ii) it exemplifies a situation in which this approach would be most useful (i.e., a case where internal point-bar accretion geometries cannot be seen directly in the seismic data).
ChaRMigS
PB-SAND
trajectories tracking channel evolution 3D facies distributions in point bars and channel fillsIN
IN OUT
smoothing & trimming
smoothed channel trajectories
inverse model
forward model
3D seismic data
trajectories of abandoned channel fills channel-form widthFAKTS
analogue data on meander-belt facieschannel- and bar-form thickness
IN IN
IN
16
4.2 Results
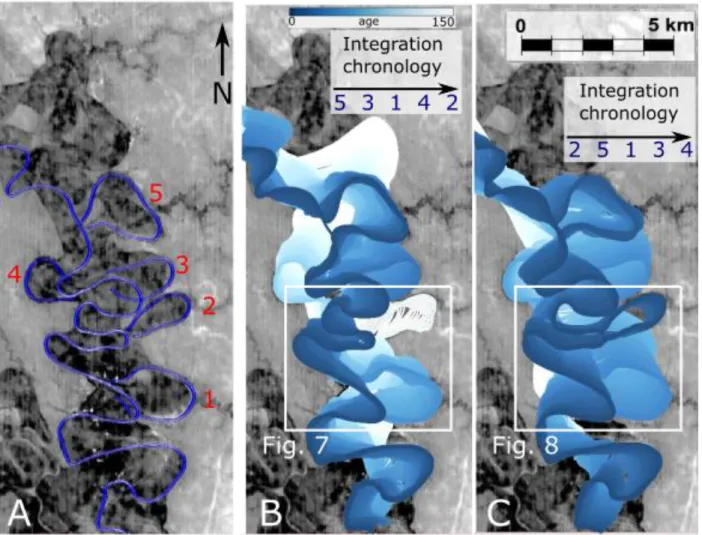
Figures 6B-C show two examples of proposed stochastic ChaRMigS reconstructions of the planform geometry of channelized systems observed on the seismic image. These results have been obtained with a Gaussian probability distribution of horizontal migration offset (mean = 60, standard deviation = 15 [m]) and a triangular probability distribution of cut-off (minimum = 0, mode = 1, maximum = 2 [number of cut-offs per time step]). For both presented realizations, all five observed abandoned meanders have been integrated. However, the chronology of integration is markedly different. This is due to the difference in the migration pattern of the bar deposits in each reconstruction: the migration pattern is mainly expansional in Figure 6B and mainly translational in Figure 6C. This highlights the ability of ChaRMigS to develop models of channel-belt architecture with markedly contrasting accretion geometries for a given set of starting conditions.
Figure 6 A-Seismic image of a channelized system from the Pleistocene of the Gulf of Thailand (Reijenstein et al, 2011). B-C- Two stochastic and equiprobable realizations obtained with ChaRMigS within 150 time steps. In parts B and C, the numbers to which integration chronologies are associated (1 to 5) refer to meander loops labelled in part
A. The white boxes denote the area that has been modelled in 3D using PB-SAND, as shown in figures 7 and 8.
Both the relative chronology of integration of the abandoned meanders and the channel migration patterns vary significantly across the two realizations (see the arrow that indicates the temporal order of integration on the top of Figure 6B, C). The abandoned meander loop 2 (Figure 6A) is the first one to be integrated in the realization in Figure 6C (i.e., it corresponds to the most recent cut off in this scenario),
17 but the last one to be integrated in realization Figure 6B (i.e., it corresponds to the oldest cut off in this scenario).
The integration of ChaRMigS and PB-SAND for the creation of static reservoir models effectively requires the use of the stochastic inverse modelling outputs from ChaRMigS, (i.e., channel trajectories) as inputs to the forward modelling runs of PB-SAND, which is used to generate realizations of the expected internal architecture of selected parts of the modelled channel belt.
For the channel belt depicted within the white boxes in Figure 6, PB-SAND has been applied to model the southern sector (Figure 7 and Figure 8). The deterministic planform realizations created by PB-SAND were conditioned using the ChaRMigS output channel trajectories resulting from both equiprobable realizations. In each realization, a reduced number of ChaRMigS output channel trajectories have been manually chosen, that are sufficient to control the transformation styles of point bars at their different evolutional stages (Figure 6): 15 and 12 bends, respectively. PB-SAND runs for multiple meander bends and associated point-bar and channel-fill elements have been incorporated in two resulting planform architectures, one for each ChaRMigS realization (Figures 6B, C), as presented in Figure 7E and Figure 8E. These outputs from PB-SAND embody smoother accretion geometries compared to the ChaRMigS realizations (Figure 6). Indeed, input trajectories from ChaRMigS were smoothed to meet the requirements of PB-SAND, which requires that each input trajectory defining a point bar has the same number of points (definition nodes). The accretion histories and styles predicted using ChaRMigS are maintained overall, however. This is recognizable when comparing, for example, the reconstruction of the lateral migration of the abandoned meander 2 in Figure 7E and the downstream migration of abandoned meander 1 in Figure 8E.
18
Figure 7. Parts A-D show input channel paths for PB-SAND realization 1, corresponding to fifteen selected time steps of the ChaRMigS realization of Figure 6B (inside the white box). Part E shows PB-SAND results for the ChaRMigS simulation presented in Figure 6B. The yellow, dark-grey, and light-grey areas denote relatively sandy point-bar deposits, finer counter-point-bar deposits, and a transitional zone between point bar and counter-point bars where downstream fining takes place, respectively. Grey and blue channel fills have been abandoned by cut off and avulsion, respectively. Thin lines of different colours denote accretion surfaces at different time steps. Pink lines
19
Figure 8 Parts A-D show input channel paths for PB-SAND realization 2, corresponding to twelve selected time steps of the ChaRMigS realization of Figure 6C (inside the white box). Part E shows PB-SAND results for the ChaRMigS simulation presented in Figure 6C. The yellow, dark-grey, and light-grey areas denote relatively sandy point-bar deposits, finer counter-point-bar deposits, and a transitional zone between point bar and counter-point bars where
downstream fining takes place, respectively. Grey and blue channel fills have been abandoned by cut off and avulsion, respectively. Thin lines of different colours denote accretion surfaces at different time steps. Pink lines
indicate cross-sections shown in Figure 11.
The two planform realizations produced by PB-SAND (Figures 7 and 8) have been used as frameworks for modelling cross-sectional geometries and facies distributions. The internal facies architecture of the modelled point-bar elements has been simulated using data on the proportions of facies in a range of
20 successions that act as geological analogues contained in the FAKTS database (Colombera et al., 2012b, 2013), as presented in Figure 9.
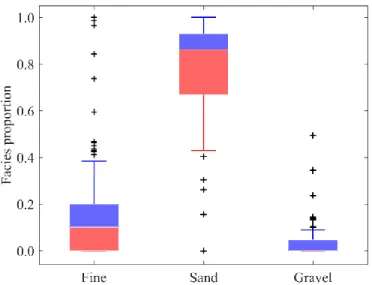
Figure 9 Facies proportions extracted from the FAKTS database for point-bar elements in meandering fluvial systems. The part of each distribution between the first and second quartiles is denoted in red; the part between the second and third quartiles is denoted in blue; the white bar inside each box denotes the median; the whiskers on both sides denote the minimum and maximum values excluding outliers shown as black crosses (outside of 1.5 times the interquartile range). Data relate to 99 point bars containing 593 facies units. “Fine” refers to clay and silt
sediment fractions.
The proportions of each facies (fines, sand, and gravel) are randomly sampled between the first and third quartile in such way that they add up to 100 %, using the approach adopted in Yan et al. (2019). This enables the sampled facies proportions to be representative whilst ensuring reasonable variability between samples. As the modelled point-bar elements are relatively sand-rich overall (Feng, 2000; Reijenstein et al., 2011), differences between samples are limited, and therefore only one facies association is used in the model presented here.
Input facies proportions are as follows: 3% gravel, 81% sand, and 16% fines. To represent grain-size trends more clearly, sands are differentiated into three classes (coarse, medium and fine) of equal proportion (each 27% of the total), whereas fines are divided into two classes (silt and clay-prone) of equal proportion (each 8% of the total). To simulate and represent lithological contrasts in planview, the proportion of fines in counter-point-bar deposits is increased at the expense of sand classes (clay: 24 %; silt: 24 %; fine sand: 16 %; medium sand: 16 %; coarse sand: 17 %; gravel: 3 %). Abandoned-channel fills are modelled as homogeneous mud plugs. The thickness of the channel fills and of the associated point-bar deposits reflect scaling relationships between channel-fill width – which is observed in the seismic data – and thickness, as based on geological analogues from the FAKTS database. For the sake of simplicity, temporal variations in river depth that match observed changes in channel-fill width have not been modelled in this case, although such functionality is incorporated in PB-SAND.
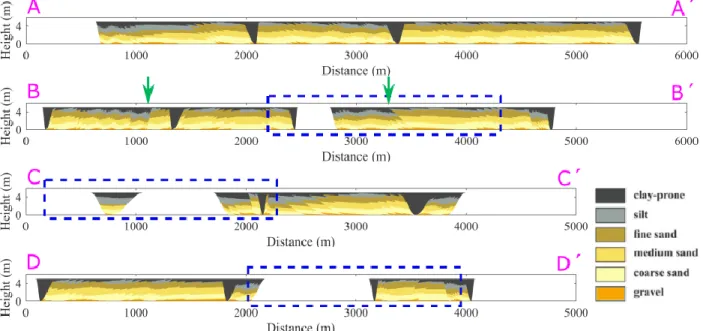
The facies architecture of the modelled meander belt is presented on cross-sections, which have been
21 Figure 11, respectively). Together with the planview model outputs (Figure 7E and Figure 8E) these cross-sections convey the variability in facies architecture that results from the contrasting accretion styles
associated with the stochastic planform evolutions provided by ChaRMigS. It is evident that local abrupt
changes of migration direction induce point-bar reactivation and juxtaposition of sandier and muddier sediment volumes (e.g., cross-section B-B’ in Figures 7E and 10). It is also evident, for example, how facies distributions vary across realizations in relation to downstream-fining trends observed within point-bar
deposits and through their transition to counter-point-bar deposits (e.g., cross section C-C’ in Figure 8E
and Figure 11). These architectural styles can cause significant petrophysical heterogeneity and can locally
compartmentalize part of the meander-belt reservoir (see the green arrows in Figures 10 and 11).
Figure 10 Cross-sections made in the PB-SAND realization of Figure 7E. The differences with the realization in Figure 8E are highlighted by these cross-sections (compare the blue dashed boxes here with those shown in Figure 11). Green arrows point to contacts between accretion packages in point-bar units with contrasting accretion style and
22
Figure 11 Cross-sections made in the PB-SAND realization Figure 8E. The differences with the realization in Figure 7E are highlighted by these cross-sections (compare the blue dashed boxes here with those shown in Figure 10). Green arrows point to contacts between accretion packages in point-bar units with contrasting accretion style and
lithological make-up.
5. Discussion
5.1 Reservoir-modelling applications
Seismic data are routinely used for constraining subsurface reservoir models. For example, seismic attributes are employed as soft-data (e.g., facies probability) for conditioning geostatistical models (e.g., Strebelle, 2002; Yao, 2002; Rongier et al., 2017a), or can be used to determine outputs of process-based forward models that best honour subsurface observations (Koneshloo et al., 2017). However, geological insight that can be drawn from geometries of sedimentary units seen in 3D seismic datasets is typically underused in reservoir-modelling practice. The presented workflow leverages on planview observations of meander-belt architectural elements, i.e. point bars and channel fills, to build stochastic models of facies heterogeneity that honour the distribution of these elements, through the sequential application of two algorithms: ChaRMigS and PB-SAND.
ChaRMigS permits the creation of different equiprobable 3D geometries resulting for meandering-channel evolution, through an inverse modelling approach, based on observations of the youngest channel trajectory and of abandoned meander loops. PB-SAND allows the creation of stochastic facies distributions that consider the type of planform evolution of a meander belt, using a forward modelling approach. PB-SAND complements ChaRMigS in that it can be used to model lithologies, whereas ChaRMigS complements PB-SAND in its ability to generate stochastic planforms that incorporate abandoned meanders. These two complementary methods can therefore be integrated effectively to build 3D geocellular models of subsurface meander-belt successions that are seen in 3D reflection seismic surveys. This approach is particularly applicable to cases in which the internal accretion geometry of point-bar elements cannot be resolved from the available data, but the trajectory of channel fills can be identified in horizontal slices, for example in pre-drill situations. The integration of these two methods, which is exemplified in the applications described herein and summarized in Figure 5, represents a novel
23 approach to reservoir modelling. The application to the subsurface of the Gulf of Thailand (above) shows how this integrated workflow can provide additional insight to subsurface characterization in data-limited settings, and how the combined modelling approach significantly enhances our ability to predict lithological heterogeneity and facies distributions in a way that is consistent with possible depositional history. The proposed workflow can be readily applied in pre-drill situations where well conditioning is not necessary. It can also be applied in conjunction with pixel-based geostatistical modelling algorithms to reservoir units that have been drilled and for which well conditioning is required (Colombera et al., 2018).
5.2 Future research
The effective combination of the two modelling methods can be further improved and refined by (i) increasing the internal consistency of channel trajectories, facies distributions and the level of integration of both methods, and (ii) improving the automation in matching all available observations. Both aspects would lead to a reduction of uncertainties and would further improve the predictive ability of the produced reservoir models.
In ChaRMigS, improvements can be made in the morphodynamic realism of trajectories that are produced in some circumstances. For example, better interpolation between channel centrelines is needed to fill gaps determined in certain cases by the integration of abandoned meanders, particularly in association with closely spaced meander bends. Also, the way in which ChaRMigS incorporates abandoned meander loops in the model outputs may, at times, result in river planforms that are not realistic, because they would represent situations whereby the inception of a channel path following cut-off results in a very highly sinuous trajectory (see, for example, the evolution of meander 2 of Figure 6C as modelled in Figure 8E). The same abandoned meander highlights limitations of PB-SAND, with regards to its ability to handle sinuous input trajectories and to its requirement for centreline smoothing. Such smoothing may have an impact on the reproduction of architectures that are delivered by ChaRMigS, such as abandoned loops integrated into the main channel path. In terms of method integration, modelling the architecture of bars and channel fills associated with meander belts containing several abandoned meanders is currently a cumbersome process. Indeed, PB-SAND models short stretches of a channel reach, with up to three meander bends, and therefore requires that the results of multiple modelling steps be merged when a complex amalgamated meander belt is modelled. The application of the combined workflow to the Pleistocene Gulf of Thailand clearly demonstrates the value of implementing a tighter integration between ChaRMigS and PB-SAND.
In terms of facies prediction, PB-SAND, uses geological rules that link facies to accretion styles (e.g., downstream fining to counter-point-bar regions, Figure 7E and Figure 8E; fining upward, Figure 10 and Figure 11). ChaRMigS fulfils the need to generate planform geometries of meandering reaches, which are required to model these 3D facies architectures by PB-SAND. Future research goals to complete the 3D consideration of reservoirs include the introduction of additional components of lithological heterogeneity within the facies using geostatistics, incorporation of the effects of vertical sand-body stacking, plus incorporation of additional architectural elements, such as levees and crevasse splays. Such model features could be used to account for external forcing parameters (see, for example, Yan et al., 2019).
A second general avenue for further research is to better and more effectively honour features seen on seismic sections and stratal or time slices or other types of subsurface data. One way of achieving this more effectively is by finding ways to infer model parameters to generate more models that automatically honour all observations. In the present state of the methods, some model results need to be eliminated by experts. For example, when applying ChaRMigS on the Pleistocene Gulf of Thailand data set, we
24 observed that several realizations could not incorporate all abandoned loops. This may occur in particular when the channel path crosses an abandoned meander, as it may then need to migrate for a large number of time steps before the integration can be considered. In a sense, this represents a “missed opportunity” for meander loop integration, which can hardly be recovered as the interpreted older loop should then no longer be visible. Therefore, when this happens, the considered realization should be rejected as incompatible with observations. In this case, a possible strategy to explore the uncertainties and obtain a wide range of realizations requires changing the migration rate distributions. More generally, parameter inference for the proposed method is clearly an aspect which calls for further research.
A second way towards honouring all observations is to augment the input of the methods to automatically allow for new types of observations. For example, some of the stochastic channel trajectories simulated by ChaRMigS sit outside the confines of the channel belt imaged in the seismic data (i.e., they are placed on the valley interfluves where in reality the formative river had never wandered) (Figures 6B-C). To prevent problems of this type, it would be ideal to be able to define spatial domains within which the model would operate. Along the same lines, more types of hard and soft data should be incorporated for model conditioning (e.g., channel-belt limits, boreholes, vertical facies proportions). The difficulty in honouring heterogeneous data sets is a limitation that affects this class of modelling methods more widely (Pyrcz et al., 2015). The evaluation of model outputs is currently based on visual screening: a quantitative and automatic approach for screening of model results would be preferable.
6. Conclusions
This work has presented applications of inverse (ChaRMigS) and forward (PB-SAND) models for the architecture of fluvial meander belts; these models have been applied to modern and ancient fluvial systems for scopes of comparison and to demonstrate how they can be linked sequentially in a new workflow for geocellular reservoir modelling.
Based on input trajectories of the planform of channel fills, including those of oxbow-shaped abandoned meander loops, ChaRMigS generates several equiprobable migration patterns that can be used to assess uncertainty about internal reservoir architectures. PB-SAND instead uses input channel trajectories, such as those produced by ChaRMigS, to generate a geometric framework of meander-belt accretion and to populate this framework by facies of different types, stochastically, based on suitable analogue data, for example as provided by FAKTS, a database of real-world case-study examples.
When working with a 3D seismic dataset in which abandoned meander scars and avulsed channel fills are observed, but in which internal point-bar growth geometries are below seismic resolution, the proposed workflow, which combines ChaRMigS with PB-SAND, makes it possible to explore a range of meander-belt facies architectures that are realistic with respect to expected styles of accretion and associated lithological heterogeneity. This novel approach is valuable for quantification of subsurface uncertainty.
Acknowledgements
The authors thank Hernan Reijenstein for authorizing the use of seismic data from Reijenstein et al. (2011). MP was supported by an award from the International Association of Sedimentologists (IAS). NY, LC and NPM acknowledge sponsors of the Fluvial & Eolian Research Group (Aker BP, Anadarko, Areva [now Orano], BHP Billiton, Cairn India [Vedanta], Chevron, ConocoPhillips, Equinor, Murphy Oil, Nexen-CNOOC, Occidental, Saudi Aramco, Shell, Tullow Oil, Woodside, and YPF) and our partner Petrotechnical Data Systems (PDS) for financial support. LC has been supported by the Natural Environment Research Council (Catalyst Fund award NE/M007324/1, Follow-on Fund NE/N017218/1). PC, GC and MP acknowledge the support of the RING Consortium managed by ASGA (ANDRA, CCR, Chevron, Equinor, ExxonMobil, IFPEN, Emerson, Petrobras, PDS, Repsol, Saudi Aramco, Schlumberger, Total, WintershallDEA and the associate
25 members listed on http://ring.georessources.univ-lorraine.fr/consortium/members) for funding that has enabled the development of ChaRMigS, and Emerson for donating SKUA-GOCAD License. We thank an anonymous reviewer who provided constructive comments that improved the paper.
References
Arnold, D., Demyanov, V., & Rojas, T. (2019). Uncertainty Quantification in Reservoir Prediction: Part 1 Model Realism in History Matching Using Geological Prior Definitions. Mathematical
Geosciences, 51(2), 209-240. doi: 10.1007/s11004-018-9774-6
Bridge, J. S. (1982). A revised mathematical model and FORTRAN IV program to predict flow, bed topography, and grain size in open-channel bends. Computers and Geosciences, 8(1), 91-95. doi:10.1016/0098-3004(82)90038-3
Brownlie, W. R. (1983). Flow depth in sand-bed channels. Journal of Hydraulic Engineering-ASCE, 109(7), 959-990. doi:10.1061/(ASCE)0733-9429(1983)109:7(959)
Calderon, H., Santibañez, F., Silva, J.F., Ortiz, J.M., Egaña, A. (2019). Geological Facies Recovery Based on Weighted ℓ 1 -Regularization. Mathematical Geosciences. doi: 10.1007/s11004-019-09825-5 Caumon, G. (2018). Geological Objects and Physical Parameter Fields in the Subsurface: A Review, in:
Daya Sagar, B.S., Cheng, Q., Agterberg, F. (Eds.), Handbook of Mathematical Geosciences. Springer International Publishing, pp. 567–588. doi:10.1007/978-3-319-78999-6_28
Cojan, I., Fouché, O., Lopez, S., & Rivoirard, J. (2005). Process-based reservoir modelling in the example of meandering channel. Geostatistics Banff 2004, 611-619. doi:10.1007/978-1-4020-3610-1_62 Colombera, L., Mountney, N. P., McCaffrey, W. D. (2013). A quantitative approach to fluvial facies
models: methods and example results. Sedimentology, 60, 1526-1558. doi:10.11111/sed.12050 Colombera, L., & Mountney, N. (2019). The lithofacies organization of fluvial channel deposits: A
meta-analysis of modern rivers. Sedimentary Geology, 383, 16-40. doi:10.1016/j.sedgeo.2019.01.011 Colombera, L., Felletti, F., Mountney, N. P., & McCaffrey, W. D. (2012a). A database approach for
constraining stochastic simulations of the sedimentary heterogeneity of fluvial reservoirs. AAPG Bulletin, 96(11), 2143-2166. doi:10.1306/04211211179
Colombera, L., Mountney, N. P., & McCaffrey, W. D. (2012b). A relational database for the digitization of fluvial architecture: concepts and example applications. Petroleum Geoscience, 18, 129-140. doi:10.1144/1354-079311-021
Colombera, L., Mountney, N. P., Medici, G., & West, L. J. (2019). The geometry of fluvial channel bodies: Empirical characterization and implications for object-based models of the sub-surface. AAPG Bulletin, 103, 905-929. doi:10.1306/10031817417
Colombera, L., Mountney, N. P., Russell, C. E., Shiers, M. N., & McCaffrey, W. D. (2017). Geometry and compartmentalization of fluvial meander-belt reservoirs at the bar-form scale: Quantitative insight from outcrop, modern and subsurface analogues. Marine and Petroleum Geology, 82, 35-55. doi:10.1016/j.marpetgeo.2017.01.024
26 Colombera, L., Yan, N., McCormick-Cox, T., & Mountney, N. P. (2018). Seismic-driven geocellular
modeling of fluvial meander-belt reservoirs using a rule-based method. Marine and Petroleum Geology, 93, 553-569. doi:10.1016/j.marpetgeo.2018.03.042
Daniel, J. F. (1971). Channel movement of meandering Indiana streams. US Government Printing Office. U.S. Geological Survey, Professional Paper 732A, 18 P.
Deutsch, C. V., & Journel, A. G. (1992). GSLIB : Geostatistical Software Library and User’s Guide. New York: Oxford University Press.
Deutsch, C. V., & Wang, L. (1996). Hierarchical Object-Based Stochastic Modeling of Fluvial Reservoirs. Mathematical Geology, 28(7), 857-880. doi:10.1007/BF02066005
Donselaar, M. E., & Overeem, I. (2008). Connectivity of fluvial point-bar deposits: An example from the Miocene Huesca fluvial fan, Ebro Basin, Spain. AAPG Bulletin, 92(9), 1109-1129.
doi:10.1306/04180807079
Durkin, P. R., Hubbard, S. M., Holbrook, J., & Boyd, R. (2018a). Evolution of fluvial meander-belt deposits and implications for the completeness of the stratigraphic record. GSA Bulletin, 130(5-6), 721-739. doi:10.1130/B31699.1
Durkin, P. R., Hubbard, S. M., Smith, D. G., & Leckie, D. A. (2018b). Predicting heterogeneity in
meandering fluvial and tidal-fluvial deposits: The point-bar to counter point-bar transition. In M. Ghinassi, L. Colombera, N. P. Mountney, & A. J. Reesink, Fluvial meanders and their sedimentary products in the rock record (Vol. 48, pp. 231-250). International Association of Sedimentologists Special Publication.
Erskine, W., McFadden, C., Bishop, P. (1992). Alluvial cutoffs as indicators of former channel conditions. Earth Surface Processes and Landforms, 17(1), 23-37. doi:10.1002/esp.3290170103
Farmer, C. L. (2005). Geological modelling and reservoir simulation. In: A. Iske, T. Randen (eds)
Mathematical methods and modelling in hydrocarbon exploration and production (pp. 119-212). Springer, Berlin, Heidelberg.
Feng, Z. Q. (2000). An investigation of fluvial geomorphology in the Quaternary of the Gulf of Thailand, with implications for river classification. PhD Thesis, University of Reading.
Fitterman, D. V., Menges, C. M., Al Kamali, A. M., Jama, F. E. (1991). Electromagnetic mapping of buried paleochannels in eastern Abu Dhabi Emirate, UAE. Geoexploration, 27, 111-133.
doi:10.1016/0016-7142(91)90018-8
Fustic, M., Bennett, B., Huang, H., & Larter, S. (2012). Differential entrapment of charged oil - New insights on McMurray Formation oil trapping mechanisms. Marine and Petroleum Geology, 36(1), 50-69. doi:10.1016/j.marpetgeo.2012.05.004
García-Gil, A., Vázquez-Suñe, E., Alcaraz, M. M., Juan, A. S., Sánchez-Navarro, J. Á., Montlleó, M., Rodríguez, G., Lao, J. (2015). GIS-supported mapping of low-temperature geothermal potential taking groundwater flow into account. Renewable Energy, 77, 268 -278.
doi:10.1016/j.renene.2014.11.096
Ghinassi, M., Ielpi, A., Aldinucci, M., & Fustic, M. (2016). Downstream-migrating fluvial point bars in the rock record. Sedimentary Geology, 334, 66-96. doi: 10.1016/j.sedgeo.2016.01.005
27 Ghinassi, M., Nemec, W., Aldinucci, M., Nehyba, S., Özaksoy, V., & Fidolini, F. (2014). Plan-form
evolution of ancient meandering rivers reconstructed from longitudinal outcrop sections. Sedimentology, 61(4), 952-977. doi:10.1111/sed.12081
Hassanpour, M. M., Pyrcz, M. J., & Deutsch, C. V. (2013). Improved geostatistical models of inclined heterolithic strata for McMurray Formation, Alberta, Canada. AAPG Bulletin, 97, 1209-1224. doi:10.1306/01021312054
Hickin, E. J. (1974). The development of meanders in natural river-channels. American journal of
science, 274(4), 414-442. doi:10.2475/ajs.274.4.414
Holbrook, J. (2017). Expansion to contraction, translation to retreat, osculation or toggle, and degree of wobble, and the many means by which a meander may move. 11th International Conference on Fluvial Sedimentology, Calgary, Canada.
Hubbard, S. M., Smith, D. G., Nielsen, H., Leckie, D. A., Fustic, M., Spencer, R. J., & Bloom, L. (2011). Seismic geomorphology and sedimentology of a tidally influenced river deposit, Lower Cretaceous Athabasca oil sands, Alberta, Canada. AAPG Bulletin, 95(7), 1123-1145. doi:10.1306/12131010111
Ikeda, S., Parker, G., & Sawai, K. (1981). Bend theory of river meanders. Part 1. Linear development. Journal of Fluid Mechanics, 112, 363-377. doi:10.1017/S0022112081000451
Issautier, B., Viseur, S., Audigane, P., & Le Nindre, Y. M. (2014). Impacts of fluvial reservoir heterogeneity on connectivity : Implications in estimating geological storage capacity for CO2. International
Journal of Greenhouse Gas Control,, 333-349. doi:10.1016/j.ijggc.2013.11.009
Jackson, M. D., & Muggeridge, A. H. (2000). Effect of discontinuous shales on reservoir performance during horizontal waterflooding. SPE Journal, 5(4), 446-455. doi:10.2118/69751-PA
Jackson, M. D., Hampson, G. J., & Sech, R. P. (2009). Three-dimensional modeling of a shoreface-shelf parasequence reservoir analog: Part 2. Geologic controls on fluid flow and hydrocarbon recovery. AAPG Bulletin, 93(9), 1183-1208. doi:10.1306/05110908145
Journel, A., & Alabert, F. (1989). Focusing on spatial connectivity of extreme-valued attributes: stochastic indicator models of reservoir heterogeneities. AAPG Bulletin, 73(3).
Keogh, K. J., Martinius, A. W., & Osland, R. (2007). The development of fluvial stochastic modelling in the Norwegian oil industry: A historical review, subsurface implementation and future directions. Sedimentary Geology, 202(1-2), 249-268. doi:10.1016/j.sedgeo.2007.05.009
Koneshloo, M., Aryana, S. A., Grana, D., & Pierre, J. W. (2017). A workflow for static reservoir modelling guided by seismic data in a fluvial system. Mathematical Geosciences, 49(8), 995-1020. doi: 10.1007/s11004-017-9696-8
Kostic, B., & Aigner, T. (2007). Sedimentary architecture and 3D ground-penetrating radar analysis of gravelly meandering river deposits (Neckar Valley, SW Germany). Sedimentology, 54(4), 789-808. doi:10.1111/j.1365-3091.2007.00860.x
Koutaniemi, L. (1980). Some aspects of the palaeohydrology connected with the development of the relief in the Oulanka river valley, NE Finland. Bulletin de l'Association française pour l'étude du Quaternaire, 17(1-2), 71-75. doi:10.3406/quate.1980.1375