HAL Id: hal-00304226
https://hal.archives-ouvertes.fr/hal-00304226
Submitted on 3 Jun 2008HAL is a multi-disciplinary open access
archive for the deposit and dissemination of sci-entific research documents, whether they are pub-lished or not. The documents may come from teaching and research institutions in France or abroad, or from public or private research centers.
L’archive ouverte pluridisciplinaire HAL, est destinée au dépôt et à la diffusion de documents scientifiques de niveau recherche, publiés ou non, émanant des établissements d’enseignement et de recherche français ou étrangers, des laboratoires publics ou privés.
Mesospheric N2O enhancements as observed by MIPAS
on Envisat during the polar winters in 2002?2004
B. Funke, M. López-Puertas, M. García-Comas, G. P. Stiller, T. von
Clarmann, N. Glatthor
To cite this version:
B. Funke, M. López-Puertas, M. García-Comas, G. P. Stiller, T. von Clarmann, et al.. Mesospheric N2O enhancements as observed by MIPAS on Envisat during the polar winters in 2002?2004. Atmo-spheric Chemistry and Physics Discussions, European Geosciences Union, 2008, 8 (3), pp.10561-10596. �hal-00304226�
ACPD
8, 10561–10596, 2008 Mesospheric N2O enhancements observed by MIPAS B. Funke et al. Title Page Abstract Introduction Conclusions References Tables Figures ◭ ◮ ◭ ◮ Back CloseFull Screen / Esc
Printer-friendly Version Interactive Discussion
Atmos. Chem. Phys. Discuss., 8, 10561–10596, 2008 www.atmos-chem-phys-discuss.net/8/10561/2008/ © Author(s) 2008. This work is distributed under the Creative Commons Attribution 3.0 License.
Atmospheric Chemistry and Physics Discussions
Mesospheric N
2
O enhancements as
observed by MIPAS on Envisat during the
polar winters in 2002–2004
B. Funke1, M. L ´opez-Puertas1, M. Garc´ıa-Comas1, G. P. Stiller2, T. von Clarmann2, and N. Glatthor2
1
Instituto de Astrof´ısica de Andaluc´ıa (CSIC), Granada, Spain
2
Forschungszentrum Karlsruhe, Institut f ¨ur Meteorologie und Klimaforschung (IMK), Karlsruhe, Germany
Received: 12 March 2008 – Accepted: 16 May 2008 – Published: 3 June 2008 Correspondence to: B. Funke (bernd@iaa.es)
ACPD
8, 10561–10596, 2008 Mesospheric N2O enhancements observed by MIPAS B. Funke et al. Title Page Abstract Introduction Conclusions References Tables Figures ◭ ◮ ◭ ◮ Back CloseFull Screen / Esc
Printer-friendly Version Interactive Discussion Abstract
N2O abundances ranging from 0.5 to 6 ppbv were observed in the polar upper strato-sphere/lower mesosphere by the MIPAS instrument on the Envisat satellite during the Arctic and Antarctic winters in the period July 2002 to March 2004. A detailed study of the observed N2O–CH4 correlations shows that such enhancements are of chemical
5
rather than dynamical origin. The N2O enhancements observed at 58 km occurred in presence of NOx intrusions from the upper atmosphere which were related to en-ergetic particle precipitation. Further, the inter-annual variability of mesospheric N2O correlates well with observed precipitating electron fluxes. The analysis of possible chemical production mechanisms shows that the major part of the observed N2O
en-10
hancements is most likely generated under dark conditions by the reaction of NO2 with atomic nitrogen at altitudes around 70–75 km in the presence of energetic parti-cle precipitation. A possible additional source of N2O in the middle and upper polar atmosphere is the reaction of N2(A3Σ+u), generated by precipitating electrons, with O2, which would lead to N2O production peaking at altitudes around 90–100 km. N2O
15
produced by the latter mechanism could then descend to the mesosphere and upper stratosphere during polar winter.
1 Introduction
Nitrous oxide is the main precursor of odd nitrogen in the middle atmosphere. Its major sources, both natural and man-made, are located at the surface from where it
20
is transported into the stratosphere. Photolysis by solar UV is its major sink and the reaction with O(1D) leads to the formation of NO.
Due to its long chemical lifetime and the apparent absence of sources in the mid-dle atmosphere, N2O is an excellent tracer for stratospheric transport processes. In particular, correlations of observed N2O abundances with other tracers such as CH4
25
ACPD
8, 10561–10596, 2008 Mesospheric N2O enhancements observed by MIPAS B. Funke et al. Title Page Abstract Introduction Conclusions References Tables Figures ◭ ◮ ◭ ◮ Back CloseFull Screen / Esc
Printer-friendly Version Interactive Discussion
et al.,2000;Ray et al.,2002).
Recently, however,Funke et al.(2008) reported polar stratospheric and mesospheric N2O enhancements in the Northern hemisphere (NH) in the aftermath of the large solar proton event (SPE) which took place in October–November 2003. These N2O enhancements were attributed to chemical production of N2O by
5
NO2+ N(4S) → N2O + O. (R1)
Both species were largely enhanced as a consequence of ionization caused by solar protons. Semeniuk et al. (2007)1 reported polar mesospheric N2O enhance-ments in the NH observed by the Fourier Transform Spectrometer on SCISAT-1 during February–April 2004 which were also attributed to the reaction of NO2 and atomic
10
nitrogen. Since no major SPE occurred in this period, these authors assumed that en-hanced N abundances, required for the formation of N2O, were generated by ionization caused by auroral electron precipitation.
An alternative production mechanism of middle and upper atmospheric N2O was proposed byZipf and Prasad(1980): i.e., metastable N2(A3Σ+u) is produced by electron
15
impact during auroral substorms and reacts with O2to form N2O:
N2(A3Σ+u) + O2→ N2O + O. (R2)
In accordance with laboratory measurements (Zipf,1980), these authors considered an efficiency of 0.6 to form N2O by the reaction of N2(A
3
Σ+u) with molecular oxygen,
which would then result in production of enormous amounts of N2O around 90–100 km
20
during geomagnetic perturbations. However, the observation of such a high efficiency for producing N2O by Reaction (R2), initially reported by Zipf (1980), has not been confirmed by other groups, and the branching ratio for this channel is probably less than 0.02 (de Sousa et al.,1985;Iannuzzi et al.,1982).
1
Semeniuk, K., McConnell, J. C., Jin, J. J., Jarosz, J. R., Boone, C. D., and Bernath, P. F.: N2O production by high energy auroral electron precipitation, J. Geophys. Res., submitted, 2007.
ACPD
8, 10561–10596, 2008 Mesospheric N2O enhancements observed by MIPAS B. Funke et al. Title Page Abstract Introduction Conclusions References Tables Figures ◭ ◮ ◭ ◮ Back CloseFull Screen / Esc
Printer-friendly Version Interactive Discussion
Here, we report upper stratospheric and mesospheric N2O enhancements observed by the Michelson Interferometer for Passive Atmospheric Sounding (MIPAS) instrument on Envisat in polar winters during 2002–2004. In Sect.2, we present the observed spa-tial distributions of polar winter N2O and their temporal evolution. The chemical origin of these N2O enhancements is demonstrated in Sect.3by means of an analysis of N2
O-5
CH4 tracer-tracer correlations, and possible production mechanisms are discussed in Sect.4.
2 MIPAS observations and data analysis
MIPAS is a limb emission Fourier transform spectrometer designed for the measure-ment of trace species from space (Fischer and Oelhaf,1996;European Space Agency,
10
2000;Fischer et al.,2007). It is part of the instrumentation of the Environmental Satel-lite (ENVISAT) which was launched into its sun-synchronous polar orbit of 98.55◦N inclination at about 800 km altitude on 1 March 2002. MIPAS operated from July 2002 to March 2004 at full spectral resolution of 0.035 cm−1(unapodized) in terms of full width at half maximum and has resumed operation with reduced resolution, after an
15
instrument failure, since August 2004. MIPAS observes the atmosphere during day and night with global coverage from pole to pole. Within its standard observation mode at full spectral resolution, MIPAS covers the altitude range from nominally 68 km down to 6 km with tangent altitudes at 68, 60, 52, 47, and then at 3 km steps from 42 to 6 km. Occasionally, MIPAS also operates in several upper atmospheric measurement
20
modes scanning up to 170 km. The field of view of MIPAS is 30 km in the horizontal and approximately 3 km in the vertical. MIPAS passes the equator in southerly direc-tion at 10.00 a.m. local time 14.3 times a day. During each orbit up to 72 limb scans are recorded. The Level-1b processing of the data (version 4.61/62 was used here), including processing from raw data to calibrated phase-corrected and geolocated
radi-25
ance spectra, is performed by the European Space Agency (ESA) (Nett et al.,1999,
ACPD
8, 10561–10596, 2008 Mesospheric N2O enhancements observed by MIPAS B. Funke et al. Title Page Abstract Introduction Conclusions References Tables Figures ◭ ◮ ◭ ◮ Back CloseFull Screen / Esc
Printer-friendly Version Interactive Discussion
2.1 Analysis of IMK/IAA-generated N2O data
Data presented and discussed in this section are vertical profiles of abundances of N2O and CH4 retrieved with the scientific IMK-IAA data processor (von Clarmann
et al.,2003a) developed and operated by the Institute of Meteorology and Climate Re-search (IMK) in Karlsruhe together with the Instituto de Astrof´ısica de Andaluc´ıa (IAA)
5
in Granada. This data processor is based on a constrained non-linear least squares algorithm with Levenberg-Marquardt damping and line by line radiative transfer calcula-tions with the Karlsruhe Optimized and Precise Radiative Transfer Algorithm (KOPRA) (Stiller et al., 2002). The first step in the L2 processing is the determination of the spectral shift, followed by the retrieval of temperature and elevation pointing (von Clar-10
mann et al.,2003b), where pressure is implicitly determined by means of hydrostatic equilibrium. The retrieval of volume mixing ratio (vmr) profiles of species is carried out in the following order: O3, H2O, HNO3, and then CH4 and N2O simultaneously. The results of the species firstly retrieved are used in the retrievals of the subsequent species. The N2O vmr is retrieved from the MIPAS spectra around 1284.9 cm−1, where
15
the v1band of N2O is located (Glatthor et al.,2005). The retrievals are performed from selected spectral regions (micro-windows) which vary with tangent altitudes in order to optimize computation time and minimize systematic errors (Echle et al.,2000). Thus, height dependent combinations of micro-windows were selected with a trade-off be-tween computation time and total retrieval error. The retrieval noise error in the N2O
20
vmr is typically 3% at 10–44 km and 22% at 50 km. The total error varies between 10 and 20% at 10–35 km and is about 30% between 35–50 km (Glatthor et al.,2005). The resulting vertical resolution was about 4 km in the altitude range 15–40 km and decreased to more than 10 km below and above this region. More details on the N2O retrieval strategy can be found inGlatthor et al.(2005).
25
Two data sets with different retrieval versions are used in this study: The first one in-cludes N2O and CH4data (Version V3O 8.0) and covers 45 days between 13 Septem-ber 2002 and 21 OctoSeptem-ber 2003. The second one was derived with an updated retrieval
ACPD
8, 10561–10596, 2008 Mesospheric N2O enhancements observed by MIPAS B. Funke et al. Title Page Abstract Introduction Conclusions References Tables Figures ◭ ◮ ◭ ◮ Back CloseFull Screen / Esc
Printer-friendly Version Interactive Discussion
version V3O 12.0 and includes 54 days between 9 September 2003 and 25 March 2004. The retrieval updates applied to the latter data set include a weaker regular-ization of N2O at altitudes above 45 km in order to achieve a more realistic shape of the retrieved profiles in the presence of extraordinary mesospheric N2O enhancements such as those found in the aftermath of the 2003 “Halloween” SPE and the Arctic winter
5
2004. It should be noted, however, that above 60 km, retrieved profiles of enhanced N2O tend to be low-biased in both data sets due to the regularization. In consequence, the peak altitudes of the derived mesospheric N2O enhancements could appear lower than in reality.
In order to analyze the retrieved trace gas profiles in a dynamical context, potential
10
vorticity data from ECMWF analysis has been used for the representation of N2O and CH4data in equivalent latitudes.
Figure1 shows potential temperature-equivalent latitude daily mean cross sections of N2O and CH4 vmr on representative days in the NH winter 2002/2003, SH winter 2003, and NH winter 2003/2004. Mesospheric polar winter N2O enhancements are
15
clearly visible during all days, being most pronounced at equivalent latitudes higher than 60◦. Their magnitudes, however, vary significantly, reaching 0.8, 1.7, and 10 ppbv on 8 December 2002, 8 June 2003, and 9 February 2004, respectively. The peak altitudes of the retrieved N2O enhancements are located around 60 km. Due to reg-ularization effects in the retrieval, however, it cannot be excluded that the true peak
20
altitudes are located at higher altitudes. The corresponding CH4 distributions show generally low vmr values at the N2O peak positions which are typical for polar winter descent of mesospheric air. Further, lowest CH4 vmrs appeared on 9 February 2004 when highest N2O amounts were observed. This anti-correlation of CH4 and N2O at high latitudes indicates that a dynamical origin of the observed N2O enhancements is
25
rather unlikely. The latitudinal extension of the mesospheric N2O layer is much nar-rower in February 2004 than in the other winters, showing a pronounced gradient at 60◦N equivalent latitude and background N
2O abundances at lower latitudes. A strong gradient is also found in the CH4distributions, although with opposite sign, indicating
ACPD
8, 10561–10596, 2008 Mesospheric N2O enhancements observed by MIPAS B. Funke et al. Title Page Abstract Introduction Conclusions References Tables Figures ◭ ◮ ◭ ◮ Back CloseFull Screen / Esc
Printer-friendly Version Interactive Discussion
that the polar vortex boundary was located at 60◦N equivalent latitudes. Indeed, an unusual strong vortex together with a very fast and efficient descent of mesospheric air has been observed in this particular Arctic winter (Manney et al.,2005). N2O en-hancements observed during the other two polar winters do not show such pronounced gradients and extend towards low latitudes, reaching background values around 30◦.
5
Thus, it seems that in the 2002-2003 winters stronger mixing of polar and tropical air occurred through a weaker polar vortex boundary.
Figure2shows the temporal evolution of mean N2O and CH4abundances (Version V3O 8.0) within 70–90◦S equivalent latitudes in the period September 2002 to Novem-ber 2003. In SeptemNovem-ber 2002, characterized by a major warming which led to a split
10
of the stratospheric polar vortex (e.g., Newman and Nash,2005), mesospheric N2O abundances around 0.5 ppbv were observed. Given the unusual dynamical situation which allowed for intrusions of tropical air masses into the polar region, it is not clear whether these small N2O enhancements are of chemical or dynamical origin. The apparent descent visible in the temporal evolution of N2O and CH4 abundances
dur-15
ing the following polar summer (i.e. December to April) is originated by photochemical losses of both species involving photolysis and reactions with OH and O(1D). Later on, a tongue of enhanced CH4 can be seen, localized around 60 km in March and descending to 30 km in July/August. These CH4 enhancements were generated by an accelerated Brewer-Dobson circulation with strong poleward transport of tropical air
20
masses rich in CH4preceding the downward motion during polar winter. The temporal evolution of N2O shows a similar behavior, though transport-generated N2O enhance-ments appear later and at lower altitudes compared to the corresponding CH4 distribu-tions. During June–August 2003, three N2O peaks reaching values higher than 1 ppbv show up at altitudes around 55–65 km while CH4vmrs were generally low due to polar
25
winter descent. As already seen in the N2O zonal mean distributions on 8 June, these N2O peaks are most likely related to chemical production. From August until the final breakup of the polar vortex in October, CH4abundances started to increase above 40 km due to stronger mixing across a weakened vortex boundary (Funke et al.,2005).
ACPD
8, 10561–10596, 2008 Mesospheric N2O enhancements observed by MIPAS B. Funke et al. Title Page Abstract Introduction Conclusions References Tables Figures ◭ ◮ ◭ ◮ Back CloseFull Screen / Esc
Printer-friendly Version Interactive Discussion
These intrusions of tropical air into the polar regions makes it more difficult to distin-guish whether mesospheric N2O enhancements in August and September are related to chemistry or to transport.
The temporal evolution of mean N2O and CH4 abundances within 70–90◦N equiv-alent latitudes are shown in Fig. 3 (Version V3O 8.0 covering September 2002 to
5
November 2003) and Fig.4 (Version V3O 12.0 covering September 2003 to March 2004). The general patterns of the temporal evolution of CH4 distributions in the NH are similar to the SH, except that during the NH Arctic winters major warmings occurred which led to pronounced polar vortex excursions towards mid-latitudes and hence, to enhanced mixing of polar and tropical air masses in the stratosphere and
meso-10
sphere in January 2003 and 2004. In consequence, high CH4 vmrs were observed during these events. Several episodes of upper stratospheric and mesospheric N2O enhancements were found in the Arctic winters 2002–2004. In November/December 2002, enhancements of 0.5–0.8 ppbv occurred around 60 km. As already seen in the zonal mean distributions on 8 December 2002 (Fig.1), these N2O enhancements went
15
along with low CH4vmrs and are thus most likely of chemical origin. The mesospheric enhancements were interrupted by the warming event in January 2002, but showed up again in February inside of descending air masses with even lower CH4 vmrs than in December 2002. Similar as in the SH, the NH polar summer 2003 was characterized by mesospheric air masses very poor in N2O.
20
The temporal evolution of N2O in the Arctic winter 2003/2004 (Fig. 4) was rather unusual due to the “Halloween” solar proton event which led to efficient and instanta-neous N2O production by Reaction (R1) of up to 5 ppbv in the 50–70 km region on 29 October 2003. As discussed in detail inFunke et al.(2008), these N2O enhancements descended with the meridional circulation in the following weeks down to 40 km.
Sev-25
eral smaller enhancements (up to 2 ppbv) occurred around 60 km in the second half of November and mid-December which cannot be attributed to SPEs. These enhance-ments disappeared by the end of December during the major warming event. Around 15 January 2004, mesospheric N2O abundances started suddenly to increase to
val-ACPD
8, 10561–10596, 2008 Mesospheric N2O enhancements observed by MIPAS B. Funke et al. Title Page Abstract Introduction Conclusions References Tables Figures ◭ ◮ ◭ ◮ Back CloseFull Screen / Esc
Printer-friendly Version Interactive Discussion
ues up to 7 ppbv (see also Fig.1, lower left panel), coinciding with the period where strongest polar winter descent occurred. These air masses rich in N2O of chemical origin descended down to altitudes around 45 km until end of March 2004.
2.2 Analysis of ESA-generated N2O data
Since episode-based scientific MIPAS-IMK-IAA data are available only for selected
5
days, we have also analysed the operational ESA N2O, NO2, and CH4 data (repro-cessed data version 4.61/4.62). This further allows to corroborate the evidence for chemically-produced mesospheric N2O enhancements found in the IMK/IAA data with data generated with an independent retrieval algorithm and, hence to exclude retrieval artifacts as a possible explanation. ESA data are retrieved with the operational retrieval
10
algorithm as described byRaspollini et al.(2006). ESA 4.61/4.62 data include all MI-PAS observations taken with full spectral resolution between June 2002 and March 2004, representing thus a quasi-continuous data set. However, care has to be taken when statistically analyzing ESA data products (i.e. zonal mean values) which are close to the detection limit since negative vmrs are not supported by this retrieval algorithm.
15
Whenever negative vmrs occur at a given altitude during an iteration of the retrieval, the corresponding vmr profile points are set arbitrarily to a value of 10−10ppmv. The rationale of this procedure is to avoid numerical retrieval instabilities. This truncation of negative values, however, results in a positive bias of ESA vmr mean values, if the ”true” mean value is close to the noise error or below. In order to correct for this
20
bias, the following procedure was applied: Assuming zonal homogeneity at a given altitude and a Gaussian distribution of N2O measurements affected by random errors, the expectation value ε of all truncated negative values to be zonally averaged can be determined by ε= Z0 −∞ x σ√2πexp " −(x − x0 )2 2σ2 # dx, (1) 25
ACPD
8, 10561–10596, 2008 Mesospheric N2O enhancements observed by MIPAS B. Funke et al. Title Page Abstract Introduction Conclusions References Tables Figures ◭ ◮ ◭ ◮ Back CloseFull Screen / Esc
Printer-friendly Version Interactive Discussion
where x0 is the “true” zonal mean value and σ is the standard deviation assumed to be identical to the zonally averaged noise error. After determination of ε by resolving numerically the integral in Eq. (1), the corrected zonal mean can be calculated by substitution of all truncated profile points by ε and subsequent averaging. Since the “true” zonal mean value is unknown at the beginning, we start with the uncorrected
5
value and iterate until x0 changes by less than 2%. This convergence criterion was usually fulfilled after a few iterations.
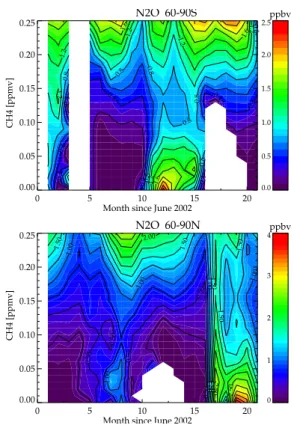
Figure5shows the temporal evolution of ESA N2O vmr averaged within 70–90◦ ge-ographical latitudes at 58 km before and after the statistical correction, together with IMK/IAA-retrieved N2O averages and mean noise errors. Excellent agreement
be-10
tween the corrected averaged ESA and IMK/IAA data is found, while the uncorrected ESA data shows a positive bias up to 1.2 ppbv in dependence of the noise error. We thus conclude that the statistical correction applied to the zonally averaged ESA N2O works satisfactorily. It can further be excluded that the N2O enhancements discussed in the previous section are generated by a retrieval artifact in any of the data sets, given
15
that they appear with good quantitative agreement in two independently retrieved data sets.
3 Analysis of N2O-CH4correlations
In the tropics and middle latitudes, N2O and CH4show compact correlations, only vary-ing little between seasons and years (Michelsen et al.,1998a,b). N2O vmrs generally
20
increase monotonically with increasing CH4with a curved relationship. In polar spring, this relationship tends to be more linear due to mixing of subsided vortex air and mid-latitude air masses. Without mesospheric sources, N2O should increase with CH4 in any case, while the presence of such source should invert this dependence for low CH4 vmrs. Therefore, N2O-CH4correlations represent an excellent tool for the detection of
25
mesospheric N2O sources.
ACPD
8, 10561–10596, 2008 Mesospheric N2O enhancements observed by MIPAS B. Funke et al. Title Page Abstract Introduction Conclusions References Tables Figures ◭ ◮ ◭ ◮ Back CloseFull Screen / Esc
Printer-friendly Version Interactive Discussion
basis, using all available observations between 45 km and 60 km within 60–90◦S and 60–90◦N. We first performed a histogramming of the observations within bins of ∆CH4=10 ppbv and ∆N2O=0.1 ppbv. Median values of the obtained N2O probability density function (PDF) at a given CH4level were then determined in a second step.
Figure6 shows the obtained temporal evolution of the N2O-CH4 correlation for 60–
5
90◦S and 60–90◦N. Deviations from the typical correlation, characterized by mono-tonically increasing N2O with CH4, are clearly visible in all four polar winters at CH4 levels below 0.1 ppmv, providing an additional proof for mesospheric N2O sources. Maximum median values of the N2O PDFs of 2.2 and 4 ppbv are found at the lowest CH4 levels during June 2003 (month 12) in the SH and January 2004 (month 19) in
10
the NH, respectively. During these months, a pronounced anti-correlation of N2O and CH4 below 0.1 ppmv was observed. During the Antarctic winter 2002 and Arctic win-ter 2002/2003, deviations from the typical correlation were less pronounced. In these winters, maximum median values of the N2O PDFs of 1 ppbv are found at CH4levels of 0.03–0.05 ppmv.
15
A further anomaly is found during November 2003 (month 17) in the NH, when N2O was significantly increased after the “Halloween” SPE. In contrast to the perturbed polar winter correlations discussed above, however, enhanced N2O is found at nearly all CH4 levels. This is expected, since solar protons led to in situ production of N2O at altitudes above 45 km. The fact that polar winter episodes of enhanced N2O are
20
characterized by inverted N2O-CH4 correlations at CH4 levels smaller than 0.5 ppbv hints thus at descent of air masses enriched in N2O from higher altitudes rather than in situ production.
Increased median values of N2O PDFs at CH4 levels higher than 0.1 ppmv are not only found in the aftermath of the “Halloween” SPE. Tongues of high N2O are visible
25
during July 2002 (month 2), June 2003 (month 12), and September 2003 (month 15) in the SH, as well as February 2003 (month 8) and January 2004 (month 19) in the NH. Such enhancements hint at mixing of descended N2O-rich and CH4-poor mesospheric air masses with ambient air masses from lower latitudes.
ACPD
8, 10561–10596, 2008 Mesospheric N2O enhancements observed by MIPAS B. Funke et al. Title Page Abstract Introduction Conclusions References Tables Figures ◭ ◮ ◭ ◮ Back CloseFull Screen / Esc
Printer-friendly Version Interactive Discussion
The finding that chemical production of N2O occurred in the mesosphere during all polar winters in the period 2002–2004, though with variable magnitude, makes it rather unlikely that mesospheric N2O enhancements are sporadic singular phenomena. It is further evident that polar N2O-CH4 correlations are significantly perturbed by this mesospheric N2O source.
5
4 Discussion
In order to understand which are the chemical mechanisms responsible for the ob-served polar winter N2O enhancements and which are the atmospheric parameters affecting their magnitudes and inter-annual variations, we have assessed the temporal evolutions of polar mesospheric N2O, CH4, and NO2 at 58 km from the ESA data set,
10
jointly with precipitating electron fluxes observed by the MEPED instrument on NOAA 16 (poes.ngdc.noaa.gov/data/avg) and calculated ion pair production rates due to solar protons (Jackman et al.,2008).
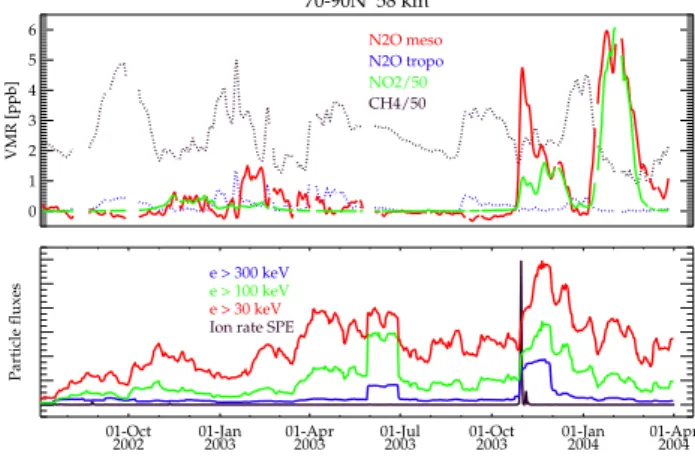
The temporal evolution of these quantities are shown in Figs.7and8for the SH and NH, respectively. In order to isolate the N2O amount generated by the mesospheric
15
source from the contribution of N2O of tropospheric origin, we have estimated the lat-ter by applying a typical N2O-CH4correlation to the CH4observations. This correlation has been determined from an average of the monthly N2O-CH4correlations presented above, excluding the polar winter periods (June–September in the SH and November– February in the NH) perturbed by mesospheric N2O generation. A dominant
contribu-20
tion of tropospheric N2O at 58 km was found in the SH polar regions from September 2002 to December 2002 and from October 2003 to January 2004. In the NH, we found smaller amounts of tropospheric N2O with dominant contributions during the major warming in January 2003 and from April to May 2003. Except for these episodes, N2O observed at 58 km was produced near entirely by the mesospheric source.
25
Possible mesospheric N2O production mechanisms based on Reactions (R1) and (R2) rely on the availability of atomic nitrogen or metastable N2(A
3
ACPD
8, 10561–10596, 2008 Mesospheric N2O enhancements observed by MIPAS B. Funke et al. Title Page Abstract Introduction Conclusions References Tables Figures ◭ ◮ ◭ ◮ Back CloseFull Screen / Esc
Printer-friendly Version Interactive Discussion
largely enhanced during episodes of energetic particle precipitation. It has already been demonstrated byFunke et al. (2008) that the N2O enhancements observed af-ter the 2003 “Halloween” SPE in the Arctic stratosphere and lower mesosphere were generated locally by Reaction (R1) in the presence of enhanced N produced under the impact of solar protons. In the following discussion, we focus on the other N2O
5
enhancements observed in the polar winters during 2002–2004. In order to assess whether solar protons could have played a role in these N2O enhancements, we looked for other SPEs during this period. However, the atmospheric ionization rates due to solar protons at 0.3 hPa (Figs. 7and 8, lower panels), which represent a direct mea-sure of SPE-induced N production, shows only very small peaks apart of the October–
10
November 2003 event. It is thus very unlikely that SPE-induced N2O production had significantly contributed to the observed N2O enhancements under discussion.
A further source of enhanced N or N2(A 3
Σ+u) could be energetic electron precipitation
(EEP). Precipitating electron fluxes of different energies observed by the MEPED in-strument are shown in Figs.7and8(lower panels). These fluxes have been averaged
15
over a 30-day period in order to reflect that N2O losses are very small during polar winter and EEP-induced N2O production would therefore tend to accumulate. Fluxes of precipitating electrons of energies 30 keV, 100 keV and 300 keV included in Figs.7
and8cause ionization peaks at altitudes around 85, 75, and 60 km, respectively (
Cal-lis et al.,1998). Since only relative temporal variations of these fluxes are of interest
20
when comparing them to the evolution of polar winter N2O enhancements, fluxes of different energies have been scaled arbitrarily for the sake of a better representation. Electron flux increases coincident with SPEs (i.e., 29 May and 29 October 2003) should be interpreted with caution since MEPED electron measurements are compromised by the presence of protons, although SPEs are thought to be associated with elevated
25
electron fluxes inside the polar caps.
It becomes evident from Figs. 7and 8 that strongest N2O enhancements at 58 km occur in polar winters with highest electron precipitation, i.e. the Antarctic winter 2003 and the Arctic winter 2004. The correlated inter-annual variations of mesospheric N2O
ACPD
8, 10561–10596, 2008 Mesospheric N2O enhancements observed by MIPAS B. Funke et al. Title Page Abstract Introduction Conclusions References Tables Figures ◭ ◮ ◭ ◮ Back CloseFull Screen / Esc
Printer-friendly Version Interactive Discussion
and electron fluxes hint at an implication of EEP in the production of N2O. On the other hand, no temporal correlation of the N2O evolution with the short-term fluctuations in any of the electron fluxes is visible. This suggests that a dominant local contribution of an EEP-related source at altitudes as low as 58 km is rather unlikely.
N2O enhancements of mesospheric origin seem to occur always in presence of
ele-5
vated NO2, although the observed NO2vmrs vary drastically from winter to winter (see Figs.7and8, upper panels). This could hint at an implication of NO2in the chemical production of N2O. On the other hand, mesospheric NO2enhancements during polar winters are known to be generated by descent of upper atmospheric NOxproduced by energetic particle precipitation (Callis et al.,1998;Siskind,2000;Funke et al.,2005;
10
Randall et al.,2007). Then, the simultaneous occurrence of both species could simply reflect that their sources are located above the observed altitude (58 km) and their de-scended contributions are modulated by the meridional circulation in the same manner. A common modulation of N2O and NO2 by variable descent velocities and horizontal mixing is further supported by the good temporal correlation of small-scale structures
15
in the evolution of both species which, in turn, is anti-correlated with the evolution of CH4vmrs. It is also evident from Figs.7and8that polar winter enhancements of N2O are by far not proportional to the available NO2amounts. The average N2O/NO2ratios observed during the periods with strongest N2O enhancements, i.e. in June – August 2003 in the SH and January – March 2004 in the NH, were considerably smaller than
20
those observed in periods with weak N2O enhancements. Further, mesospheric N2O enhancements tended to start earlier and lasted longer than the NO2enhancements.
In order to qualitatively assess the relative magnitudes and peak altitudes of the EEP-related N2O sources, we have estimated N2O production rates due to Reactions (R1) and (R2) for different atmospheric conditions.
25
N(4S) is generated in presence of EEP by a chain of ionization processes from N2. It is commonly assumed that each ion pair produced by electron impact leads to the formation of 0.55 N(4S) atoms (e.g., Jackman et al., 2005). During night, this mech-anism represents the only source of N(4S), while at daytime, NO photolysis leads to
ACPD
8, 10561–10596, 2008 Mesospheric N2O enhancements observed by MIPAS B. Funke et al. Title Page Abstract Introduction Conclusions References Tables Figures ◭ ◮ ◭ ◮ Back CloseFull Screen / Esc
Printer-friendly Version Interactive Discussion
additional N production. The dominating losses of atomic nitrogen are
N + NO → N2+ O, (R3)
N + O2→ NO + O, (R4)
and Reaction (R1). Assuming atomic nitrogen to be in steady state and an efficiency of Reaction (R1) to form N2O of 0.5 (Funke et al.,2008), the N2O production rate P1
5
due to Reaction (R1) is
P1=0.5 × (0.55p + JNO[NO]) × k1[NO2] k3[NO] + k4[O2] + k1[NO2]
, (2)
where p is the ion pair production rate, JNO the photolysis rate of NO, and k1, k3, and
k4are the rate coefficients for the atomic nitrogen loss Reactions (R1), (R3), and (R4),
respectively.
10
N2(A 3
Σ+u) is also produced by the impact of precipitating electrons. Quenching by
atomic oxygen, i.e.
N2(A3Σ+u) + O → N2+ O, (R5)
and radiative emissions in the Vegard-Kaplan bands with an Einstein coefficient of 0.52 s−1 are the prominent losses in the thermosphere, while at lower altitudes
Re-15
action (R2) becomes dominant. As reported by Zipf and Prasad (1980), we assume that each ion pair produces 0.35 metastable N2(A
3
Σ+u) molecules. In accordance with
the more recent laboratory work ofde Sousa et al. (1985), we apply an efficiency of 0.02 to form N2in Reaction (R2) as an upper limit. The N2O production rate P2due to Reaction (R2) is then
20
P2=0.02 × 0.35p × k2[O2]
k2[O2] + k5[O] + 0.52, (3)
ACPD
8, 10561–10596, 2008 Mesospheric N2O enhancements observed by MIPAS B. Funke et al. Title Page Abstract Introduction Conclusions References Tables Figures ◭ ◮ ◭ ◮ Back CloseFull Screen / Esc
Printer-friendly Version Interactive Discussion
As a representative profile of atmospheric ionization due to EEP, we took the aver-age ion pair formation rates calculated byCallis et al.(1998) from MEPED data taken in the period 1979–1987 (see Fig. 2a of their work). These rates might underestimate the EEP-induced ionisation for conditions of elevated geomagnetic activity as encoun-tered during 2003. On the other hand, due to the averaging over nearly an entire
5
solar cycle, they are useful for the estimation of an average N2O production to be ex-pected during any polar winter. Calculations of the N2O production rates have been performed for different scenarios of polar winter NOxdescent. In the nominal scenario, NOxabundances are 20 ppbv at 50 km and increase to 800 ppbv at 75 km (10 ppmv at 100 km). The “high NOx” scenario reflects the NOxabundances observed in February
10
2004 when the unusual descent of upper atmospheric air occurred in the NH polar vortex. In agreement with observations of ACE-FTS (Rinsland et al.,2006) and MIPAS (Funke et al.,2007), we have assumed in this scenario 100 ppbv at 50 km, increasing to 4 ppbv at 75 km (20 ppmv at 100 km). The NOx partitioning was taken from WACCM model calculations (Garcia et al., 2007) for January, 90◦N (polar night) and 60◦N at
15
noon (i.e. 80◦SZA). In these simulations, the polar night NO
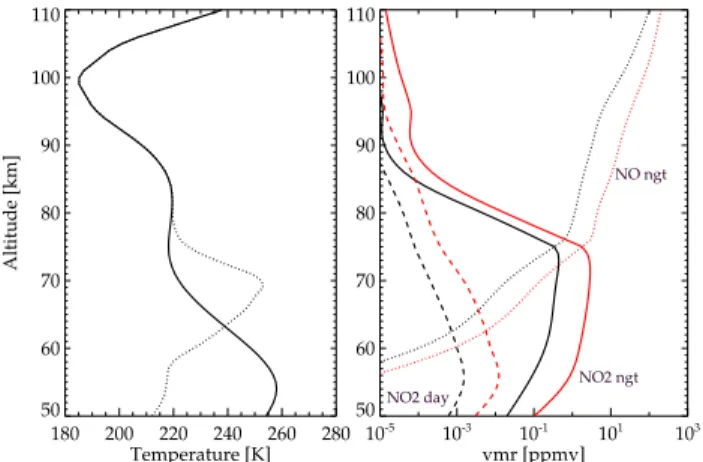
x partitioning in the meso-sphere shows only small inter- and intra-annual variations. Nominal temperatures were taken from NRLMSISE-00 (Picone et al.,2002) for January, 90◦N. We also included an additional temperature scenario for “strong descent” conditions which reflects the thermal structure over the North pole during end of January 2004, when temperatures
20
30 K higher (40 K lower) than MSIS were observed at 70 km (50 km) by the SABER instrument (Hauchecorne et al.,2007). Profiles of temperature and vmrs of NO and NO2 for the different scenarios are shown in Fig.9. Atomic oxygen densities required for the calculation of P2have been taken from WACCM calculations for January, 90◦N. Rate constants for Reactions (R1–4) were taken fromSander et al.(2006), while the
25
quenching rate k5of Reaction (R5) was taken fromZipf and Prasad(1980).
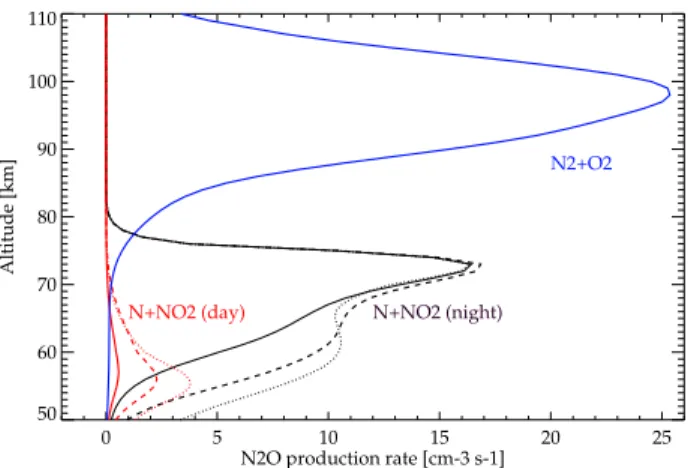
Figure10shows the estimated N2O production rates P1and P2due to Reactions (R1) and (R2), respectively, in the presence of EEP. Apart of the nominal scenario, P1is also shown for the “high NOx” scenario combined with the nominal and the “strong descent”
ACPD
8, 10561–10596, 2008 Mesospheric N2O enhancements observed by MIPAS B. Funke et al. Title Page Abstract Introduction Conclusions References Tables Figures ◭ ◮ ◭ ◮ Back CloseFull Screen / Esc
Printer-friendly Version Interactive Discussion
temperature scenarios. Since P1 depends on illumination, both, polar night and sun overhead conditions have been considered. N2O production due to Reaction (R2) are independent on temperature and the NOx abundance. Thus, we have considered the nominal scenario only for the estimation of P2.
The peak nighttime production rate P1 due to Reaction (R1), located around 73 km,
5
is on the order of 15 cm−3s−1 (see Fig. 10). The daytime contribution of this reaction has its maximum around 55 km with a N2O production rate considerably smaller than the corresponding nighttime contribution. This is expected, since daytime NO2 abun-dances are very small due to NO2 photolysis. Daytime N concentrations are driven by NO photolysis rather than by electron impact, which induces a pronounced
depen-10
dence of P1 on the NOx availability during day (compare dashed and solid red line in Fig.10). This dependence on NOxis, however, negligible at the P1peak height, around 73 km, during night. The reason is that for the atmospheric conditions there, atomic nitrogen losses are dominated by Reactions (R1) and (R3), both involving NOx. In con-sequence, the N2O production is mainly driven by the ionization rate and the NO/NO2
15
partitioning, there. The latter, however, is expected to introduce only a small variability of P1. At altitudes below the peak height, the nighttime production rate P1 depends more strongly on the NOxvmr, since atomic nitrogen losses due to Reaction (R4) are getting more important towards lower altitudes. An 800% increase of NOx in the “high NOx” scenario compared to the nominal scenario results in a 50% increase in the N2O
20
production at 60 km.
Temperature also affects the N2O production by Reaction (R1). This is related to the strong temperature dependence of the atomic nitrogen losses by Reaction (R4), lead-ing to a loss at temperatures around 255 K faster by one order of magnitude compared to temperatures around 220 K. When considering the “strong descent” temperature
25
scenario, reflecting the conditions during the Arctic mid-winter 2004, the P1 profiles are significantly increased below 63 km and slightly decreased above, compared to the nominal temperature scenario (compare dotted and dashed lines in Fig.10).
pro-ACPD
8, 10561–10596, 2008 Mesospheric N2O enhancements observed by MIPAS B. Funke et al. Title Page Abstract Introduction Conclusions References Tables Figures ◭ ◮ ◭ ◮ Back CloseFull Screen / Esc
Printer-friendly Version Interactive Discussion
duction by Reaction (R1), it is necessary to assess the dependence of P1during night on both temperature and NOxavailability in more detail. Therefore, we have performed calculations of P1 for various temperatures between 220 and 270 K and NOx vmrs up to 4 ppmv (not shown). It turned out that for typical polar winter temperatures of 220 K at 70 km, P1 is rather proportional to NOx up to approximately 20 ppbv, while for NOx
5
abundances larger than 100 ppbv the impact of the NOx abundance on P1 is weak. NOx abundances of more than 100 ppbv are generally found above 70 km during typ-ical polar winters. For perturbed temperatures of 255 K, the linear dependence on NOx is extended up to 150 ppbv. The region of weak NOx dependence starts at NOx vmrs around 500 ppbv. Since such high temperatures are generally found in winters
10
with strong subsidence and hence high NOx availability, P1 is expected to be rather independent on NOx at its peak height also in presence of high temperatures.
The maximum of the production rate P2 is located at 95–100 km with a magnitude of 25 cm−3s−1 and decreasing to values smaller than 1 cm−3s−1 below 75 km. P
2 is mainly driven by the EEP ionization rate, though above 90 km, increasing atomic
oxy-15
gen densities make P2 dependent on the O/O2 partitioning. At the P2 peak height, around half of the EEP-generated N2(A
3
Σ+u) molecules are quenched by atomic
oxy-gen before they can react with O2to form N2O.
Despite this dependence on the O/O2partitioning, N2O production by Reaction (R2) shows similarities with the EEP-induced NO production in terms of both source
re-20
gion and variability. The magnitude of the NO production, however, is higher than our estimates of the N2O production by Reaction (R2) by approximately a factor of 200, assuming that 0.7 NO molecules are produced by each ion pair (Jackman et al.,2005). In consequence, we would expect that during polar winter, when photochemical losses are small, the N2O produced by Reaction (R2) is about 0.5% of the NOxabundance in
25
air masses descended from the upper atmosphere.
During mid winter, the average polar NO2abundances at 58 km, as shown in Figs.7
and8, represent a good proxy of total NOx. During the 2002 Antarctic and 2002/2003 Arctic winters, observed NO2abundances at 58 km were generally lower than 15 ppbv.
ACPD
8, 10561–10596, 2008 Mesospheric N2O enhancements observed by MIPAS B. Funke et al. Title Page Abstract Introduction Conclusions References Tables Figures ◭ ◮ ◭ ◮ Back CloseFull Screen / Esc
Printer-friendly Version Interactive Discussion
Hence, a negligible contribution by Reaction (R2) to the observed N2O enhancements of less than 0.07 ppbv would be expected at this altitude. However, during the Antarctic winter 2003, when NO2abundances of more than 100 ppbv were measured, this contri-bution could have made up to 0.5 ppbv, which is about 40% of the N2O enhancements observed in this period. During January–March 2004 in the Arctic, the contribution due
5
to Reaction (R2) could have even been as high as 1.5 ppbv which makes up 25% of the observed N2O enhancements. We recall, however, that these estimates represent an upper limit for a possible contribution of Reaction (R2).
In the lower thermosphere, N2O abundances on the order of several 100 ppbv would then be expected due to Reaction (R2). Unfortunately, there are no thermospheric N2O
10
measurements available which would support such high N2O amounts. We thus have looked at MIPAS spectra taken in the upper atmospheric observation mode on 11 June 2003, which includes tangent heights up to 100 km. No evidence for N2O emissions at tangent heights around 90–100 km was found in any of the N2O bands included in the MIPAS spectra. However, due to the low signal-to-noise ratio at these altitudes,
15
only N2O abundances higher than approximately 200 ppbv could have been detected by MIPAS at these tangent heights.
In this sense, a possible contribution of Reaction (R2) can neither be proven nor excluded. In any case, even when assuming a maximum efficiency of this reaction to form N2O, its contribution could only explain a small fraction of the observed N2O
20
enhancements.
Assuming a continuous EEP-induced N2O production with typical rates as provided by our estimates of P1 and a transport-limited N2O lifetime of a few weeks, Reac-tion (R1) would lead to N2O abundances on the order of several ppbv at its source region around 70 km. Since our estimations reflect conditions of average geomagnetic
25
activity, even higher mesospheric N2O abundances would be found in periods of ele-vated geomagnetic activity, e.g. during the Antarctic winter 2003 and Arctic winter 2004. Although N2O abundances are expected to decrease towards lower altitudes due to di-lution during the descent, it seems plausible that N2O abundances such as observed at
ACPD
8, 10561–10596, 2008 Mesospheric N2O enhancements observed by MIPAS B. Funke et al. Title Page Abstract Introduction Conclusions References Tables Figures ◭ ◮ ◭ ◮ Back CloseFull Screen / Esc
Printer-friendly Version Interactive Discussion
58 km during the 2002–2004 polar winters could have been caused by Reaction (R1). It has already been demonstrated by CMAM model calculations (Semeniuk et al., 2007)1, that a dominant contribution to the mesospheric N2O enhancements during the Arctic winter 2004 was generated by this reaction during night. It is thus very likely, that its nighttime contribution was also responsible for the major part of the N2O
enhance-5
ments observed in the other polar winters. Its daytime contribution, which does not require the presence of EEP, is expected to be considerably smaller. Nevertheless, mi-nor N2O amounts could have been produced in illuminated regions at altitudes below 60 km, in particular during winters with high NOx availability (i.e., February 2004). A dominant nighttime contribution originated from a source region around 70–75 km is
10
also supported by the finding that the observed N2O enhancements at 58 km are more efficiently modulated by dynamical factors than by the electron flux variability.
As demonstrated above, nighttime N2O production by Reaction (R1) is mainly driven by the EEP-induced ionisation rate around 73 km. Hence, except for dynamical modu-lations, the inter-annual variations of the observed polar winter N2O enhancements
15
should be correlated to the flux variations of precipitating electrons with energies greater than 100 keV. Indeed, we found the highest N2O amounts in the 2003 SH and 2004 NH winters with most elevated fluxes of a>100 keV electrons. However, it is striking that the N2O enhancements observed during the 2003 SH winter at 58 km were about 5 times smaller than those of the 2004 NH winter, although the observed
20
>100 keV electron fluxes were comparable. This apparent asymmetry could be ex-plained by the unusually strong polar vortex during the 2004 NH winter leading to a more efficient descent of N2O produced around 73 km than in the 2003 SH winter. Further, favored by the low temperatures and high NOx availability, significant N2O production could have occurred at altitudes below 65 km during the 2004 NH winter.
25
We have further observed that the N2O/NO2ratio tended to be considerably higher at the beginning and the end of the polar winters. As discussed above, the non-linear dependence of the nighttime fraction of P1on the NOxavailability could be responsible for variations of the N2O/NO2ratio: At the beginning and the end of the winter, when
ACPD
8, 10561–10596, 2008 Mesospheric N2O enhancements observed by MIPAS B. Funke et al. Title Page Abstract Introduction Conclusions References Tables Figures ◭ ◮ ◭ ◮ Back CloseFull Screen / Esc
Printer-friendly Version Interactive Discussion
only small amounts of NOxare available, N2O increases linearly with NO2, while during mid winter, sufficient NOx is available to make the N2O production dependent on the EEP-induced ionization and the NOxpartitioning, only.
In summary, we have shown that the magnitude and temporal evolution of the ob-served N2O enhancements during the 2002–2004 polar winters are in concordance
5
with a dominant nighttime N2O source around 73 km due to Reaction (R1) which is driven by energetic electron precipitation. The variability of N2O at 58 km over various winters seems to be driven by both dynamical conditions and variations of the source strength. Further, we cannot exclude that Reaction (R2) contributed additionally by up to 25–40% to the observed enhancements.
10
5 Conclusions
We have presented observations of enhanced N2O abundances, ranging from 0.5 to 6 ppbv in the polar upper stratosphere/lower mesosphere, which have been taken by the MIPAS instrument on the Envisat satellite during the Arctic and Antarctic winters in the period July 2002–March 2004. These N2O enhancements have been found in two
15
data sets resulting from independent processing, the first, generated at IMK/IAA, and the second, generated by the operational data processing performed by ESA. The good agreement of both data sets makes is unlikely that the observed N2O enhancements are related to retrieval artifacts.
Simultaneous N2O and CH4 observations show a pronounced anti-correlation
dur-20
ing polar winters at CH4levels lower than 0.1 ppmv. This behavior gives clear evidence that the N2O enhancements are of chemical rather than dynamical origin. As a conse-quence, polar winter N2O-CH4correlations should be used with caution in tracer-tracer studies due to the perturbations by this mesospheric N2O source.
The finding that chemical production of N2O occurred in the mesosphere during all
25
polar winters in the period 2002–2004, though with variable magnitude, makes it rather unlikely that mesospheric N2O enhancements are infrequent isolated phenomena.
ACPD
8, 10561–10596, 2008 Mesospheric N2O enhancements observed by MIPAS B. Funke et al. Title Page Abstract Introduction Conclusions References Tables Figures ◭ ◮ ◭ ◮ Back CloseFull Screen / Esc
Printer-friendly Version Interactive Discussion
The polar winter N2O enhancements observed at 58 km occurred in the presence of NOx intrusions from the upper atmosphere which were related to energetic particle precipitation. Further, the inter-annual variability of mesospheric N2O correlates well with precipitating electron fluxes as measured by the MEPED instrument. On the other hand, we found a pronounced anti-correlation of the temporal evolutions of N2O and
5
CH4at 58 km, which hints at a dynamical modulation of descending N2O from a source region at higher altitudes.
The analysis of possible chemical production mechanisms shows that the major part of the observed N2O enhancements is most likely generated under dark conditions by the reaction of NO2with atomic nitrogen in the presence of energetic particle
precipita-10
tion. N2O production due to this mechanism has its maximum around 73 km. The polar winter N2O abundances observed at 58 km seem to be modulated by both variations of the source strength and dynamical factors driving the efficiency of the descent from the source region. An additional source of N2O in the middle and upper polar atmosphere could represent the reaction of N2(A
3
Σ+u), generated by precipitating electrons, with O2,
15
which would lead to N2O production peaking at altitudes around 90–100 km. N2O pro-duced by the latter mechanism could have then descended to the upper stratosphere and mesosphere during the 2002–2004 polar winters, where it could have contributed to the observed N2O enhancements by up to 25–40%.
EEP-generated mesospheric N2O represents a continuous, though variable, source
20
of stratospheric odd nitrogen during polar winters. This source, however, is of minor importance when comparing to EEP-induced NO production.
Acknowledgements. The IAA team was supported by the Spanish project ESP2004-01556
and EC FEDER funds. The authors acknowledge ESA for providing MIPAS spectra and level-2 data, as well as ECMWF for meteorological analysis data. The IMK teaam was supported
25
by the Priority Program CAWSES of the German science foundation (DFG) under the project MANOXUVA.
ACPD
8, 10561–10596, 2008 Mesospheric N2O enhancements observed by MIPAS B. Funke et al. Title Page Abstract Introduction Conclusions References Tables Figures ◭ ◮ ◭ ◮ Back CloseFull Screen / Esc
Printer-friendly Version Interactive Discussion References
Callis, L. B., Natarajan, M., Lambeth, J. D., and Baker, D. N.: Solar atmospheric coupling by electron (SOLACE 2. Calculated stratospheric effects of precipitationg electron, 1979–1988, J. Geophys. Res., 103, 28 421–28 438, 1998. 10573,10574,10576
de Sousa, A. R., Touzeau, M., and Petitdidier, M.: Quenching reactions of metastable
5
N2(A3Σ, ν = 0, 1, 2) molecule with O2, Chem. Phys. Lett., 121, 1985. 10563,10575
Echle, G., von Clarmann, T., Dudhia, A., Flaud, J.-M., Funke, B., Glatthor, N., Kerridge, B., L ´opez-Puertas, M., Mart´ın-Torres, F. J., and Stiller, G. P.: Optimized spectral microwindows for data analysis of the Michelson Interferometer for Passive Atmospheric Sounding on the Environmental Satellite, Appl. Opt., 39, 5531–5540, 2000.10565
10
European Space Agency: Envisat, MIPAS An instrument for atmospheric chemistry and cli-mate research, ESA Publications Division, ESTEC, P. O. Box 299, 2200 AG Noordwijk, The Netherlands, SP-1229, 2000.10564
Fischer, H. and Oelhaf, H.: Remote sensing of vertical profiles of atmospheric trace con-stituents with MIPAS limb-emission spectrometers, Appl. Opt., 35, 2787–2796, 1996. 10564 15
Fischer, H., Birk, M., Blom, C., Carli, B., Carlotti, M., von Clarmann, T., Delbouille, L., Dudhia, A., Ehhalt, D., Endemann, M., Flaud, J. M., Gessner, R., Kleinert, A., Koopmann, R., Langen, J., L ´opez-Puertas, M., Mosner, P., Nett, H., Oelhaf, H., Perron, G., Remedios, J., Ridolfi, M., Stiller, G., and Zander, R.: MIPAS: an instrument for atmospheric and climate research, Atmos. Chem. Phys. Discuss., 7, 8795–8893, 2007,
20
http://www.atmos-chem-phys-discuss.net/7/8795/2007/. 10564
Funke, B., L ´opez-Puertas, M., Gil-L ´opez, S., von Clarmann, T., Stiller, G. P., Fischer, H., and Kellmann, S.: Downward transport of upper atmospheric NOx into the polar stratosphere and lower mesosphere during the Antarctic 2003 and Arctic 2002/2003 winters, J. Geophys. Res., 110, D24308, doi:10.1029/2005JD006463, 2005. 10567,10574
25
Funke, B., L ´opez-Puertas, M., Fischer, H., Stiller, G. P., von Clarmann, T., Wetzel, G., Carli, B., and Belotti, C.: Comment on ’Origin of the January–April 2004 increase in stratospheric NO2 observed in northern polar latitudes’ by J.-B. Renard et al., Geophys. Res. Lett., 34, L07813, doi:10.1029/2006GL027518, 2007. 10576
Funke, B., Garc´ıa-Comas, M., L ´opez-Puertas, M., Glatthor, N., Stiller, G. P., von Clarmann, T.,
30
Semeniuk, K., and McConnell, J. C.: Enhancement of N2O during the October-November 2003 solar proton events, Atmos. Chem. Phys. Discuss., 8, 4669–4691, 2008,
ACPD
8, 10561–10596, 2008 Mesospheric N2O enhancements observed by MIPAS B. Funke et al. Title Page Abstract Introduction Conclusions References Tables Figures ◭ ◮ ◭ ◮ Back CloseFull Screen / Esc
Printer-friendly Version Interactive Discussion
http://www.atmos-chem-phys-discuss.net/8/4669/2008/. 10563,10568,10573,10575
Garcia, R. R., Marsh, D. R., Kinnison, D. E., Boville, B. A., and Sassi, F.: Simulation of secular trends in the middle atmosphere, J. Geophys. Res., 112, D09301, doi:10.1029/ 2006JD007485, 2007. 10576
Glatthor, N., von Clarmann, T., Fischer, H., Funke, B., Grabowski, U., H ¨opfner, M., Kellmann, S.,
5
Kiefer, M., Linden, A., Milz, M., Steck, T., Stiller, G. P., Mengistu Tsidu, G., and Wang, D. Y.: Mixing processes during the Antarctic vortex split in September/October 2002 as inferred from source gas and ozone distributions from ENVISAT-MIPAS, J. Atmos. Sci., 62, 787–800, 2005. 10565
Hauchecorne, A., Bertaux, J.-L., Dalaudier, F., Russell III, J. M., Mlynczak, M. G., Kyr ¨ol ¨a, E.,
10
and Fussen, D.: Large increase of NO2in the north polar mesosphere in January–February 2004: Evidence of a dynamical origin from GOMOS/ENVISAT and SABER/TIMED data, Geophys. Res. Lett., 34, L03810, doi:10.1029/2006GL027628, 2007.10576
Iannuzzi, M. P., Jeffries, J. B., and Kaufman, F.: Product channels of the N2(A 3
Σ+u)+O2
interac-tion, Chem. Phys. Lett., 87, 570–574, 1982.10563 15
Jackman, C. H., DeLand, M. T., Labow, G. J., Fleming, E. L., Weisenstein, D. K., Ko, M. K. W., Sinnhuber, M., and Russell, J. M.: Neutral atmospheric influences of the solar proton events in October–November 2003, J. Geophys. Res., 110, A09S27, doi:10.1029/2004JA01088, 2005. 10574,10578
Jackman, C. H., Marsh, D. R., Vitt, F. M., Garcia, R. R., Fleming, E. L., Labow, G. J., Randall,
20
C. E., L ´opez-Puertas, M., Funke, B., von Clarmann, T., and Stiller, G. P.: Short- and medium-term atmospheric effects of very large solar proton events, Atmos. Chem. Phys., 8, 765–785, 2008,http://www.atmos-chem-phys.net/8/765/2008/.10572,10593
Manney, G. L., Kr ¨uger, K., Sabutis, J. L., Sena, S. A., and Pawson, S.: The remarkable 2003– 2004 winter and other recent warm winters in the Arctic stratosphere since the late 1990s, J.
25
Geophys. Res., 110, D04107, doi:10.1029/2004JD005367, 2005.10567
Michelsen, H. A., Manney, G. L., Gunson, M. R., Rinsland, C. P., and Zander, R.: Correlations of stratospheric abundances of CH4and N2O derived from ATMOS measuremets, Geophys. Res. Lett., 25, 2777–2780, 1998a.10562,10570
Michelsen, H. A., Manney, G. L., Gunson, M. R., and Zander, R.: Correlations of stratospheric
30
abundances of NOy, O3, N2O, and CH4 derived from ATMOS measurements, J. Geophys. Res., 103, 28 347–28 359, 1998b. 10570
ACPD
8, 10561–10596, 2008 Mesospheric N2O enhancements observed by MIPAS B. Funke et al. Title Page Abstract Introduction Conclusions References Tables Figures ◭ ◮ ◭ ◮ Back CloseFull Screen / Esc
Printer-friendly Version Interactive Discussion
P., and Ridolfi, M.: MIPAS Ground Processor and Data Products, in: Proc. IEEE 1999 In-ternational Geoscience and Remote Sensing Symposium, 28 June–2 July 1999, Hamburg, Germany, 1692–1696, 1999. 10564
Nett, H., Perron, G., Sanchez, M., Burgess, A., and Mosner, P.: MIPAS in-flight calibration and processor verification, in: ENVISAT Calibration Review – Proc. of the European
Work-5
shop, 9–13 September 2002, ESTEC, Noordwijk, The Netherlands, CD-ROM, edited by: Sawaya-Lacoste, H., vol. SP-520, ESA Publications Division, ESTEC, Postbus 299, 2200 AG Noordwijk, The Netherlands, 2002. 10564
Newman, P. A. and Nash, E. R.: The Unusual Southern Hemisphere Stratosphere Winter of 2002, J. Atmos. Sci., 62, 614–628, 2005. 10567
10
Picone, J., Hedin, A., Drob, D., and Aikin, A.: NRLMSISE-00 empirical model of the at-mosphere: Statistical comparisons and scientific issues, J. Geophys. Res., 107, 1468, doi:10.1029/2002JA009430, 2002. 10576
Plumb, R. A., Waugh, D. W., and Chipperfield, M. P.: The effects of mixing on tracer relation-ships in the polar vortices, J. Geophys. Res., 105, 10 047–10 062, 2000.10562
15
Randall, C. E., Harvey, V. L., Singleton, C. S., Bailey, S. M., Bernath, P. F., Codrescu, M., Nakajima, H., and Russell III, J. M.: Energetic particle precipitation effects on the Southern Hemisphere stratosphere in 1992–2005, J. Geophys. Res., 112, D08308, doi: 10.1029/2006JD007696, 2007. 10574
Raspollini, P., Belotti, C., Burgess, A., Carli, B., Carlotti, M., Ceccherini, S., Dinelli, B. M.,
20
Dudhia, A., Flaud, J.-M., Funke, B., H ¨opfner, M., L ´opez-Puertas, M., Payne, V., Piccolo, C., Remedios, J. J., Ridolfi, M., and Spang, R.: MIPAS level 2 operational analysis, Atmos. Chem. Phys., 6, 5605–5630, 2006,http://www.atmos-chem-phys.net/6/5605/2006/. 10569
Ray, E. A., Moore, F. L., Elkins, J. W., Hurst, D. F., Romashkin, P. A., S.Dutton, G., and Fahey, D. W.: Descent and mixing in the 1999–2000 northern polar vortex inferred from in situ tracer
25
measurements, J. Geophys. Res., 107, 8285, doi:10.1029/2001JD000961, 2002. 10563
Rinsland, C. P., Goldman, A., Elkins, J. W., Chiou, L. S., Hannigan, J. W., Wood, S. W., Mahieu, E., and Zander, R.: Long–term trend of CH4at northern mid–latitudes: Comparison between ground–based infrared solar and surface sampling measurements, J. Quant. Spectrosc. Ra., 97, 457–466, doi:10.1016/j.jqsrt.2005.07.002, 2006. 10576
30
Sander, S. P., Friedl, R. R., Ravishankara, A. R., Golden, D. M., Kolb, C. E., Kurylo, M. J., Molina, M. J., Moortgat, G. K., Keller-Rudek, H., Finlayson-Pitts, B. J., Wine, P., Huie, R. E., and Orkin, V. L.: Chemical kinetics and Photochemical Data for the Use in Atmospheric
Stud-ACPD
8, 10561–10596, 2008 Mesospheric N2O enhancements observed by MIPAS B. Funke et al. Title Page Abstract Introduction Conclusions References Tables Figures ◭ ◮ ◭ ◮ Back CloseFull Screen / Esc
Printer-friendly Version Interactive Discussion
ies. Evaluation Number 15, JPL publication 06-2, Jet Propulsion Laboratory, 2006. 10576
Siskind, D. E.: Atmospheric science across the Stratopause, 123 of Geophysical Monograph, chap. On the coupling between middle and upper atmospheric odd nitrogen, 101–116, Amer-ican Geophysical Union, 2000. 10574
Stiller, G. P., von Clarmann, T., Funke, B., Glatthor, N., Hase, F., H ¨opfner, M., and Linden,
5
A.: Sensitivity of trace gas abundances retrievals from infrared limb emission spectra to simplifying approximations in radiative transfer modelling, J. Quant. Spectrosc. Ra., 72, 249– 280, 2002.10565
von Clarmann, T., Chidiezie Chineke, T., Fischer, H., Funke, B., Garc´ıa-Comas, M., Gil-L ´opez, S., Glatthor, N., Grabowski, U., H ¨opfner, M., Kellmann, S., Kiefer, M., Linden, A., L
´opez-10
Puertas, M., L ´opez-Valverde, M. ´A., Mengistu Tsidu, G., Milz, M., Steck, T., and Stiller, G. P.: Remote Sensing of the Middle Atmosphere with MIPAS, in: Remote Sensing of Clouds and the Atmosphere VII, edited by: Sch ¨afer, K., Lado-Bordowsky, O., Comer ´on, A., and Picard, R. H., 4882, 172–183, SPIE, Bellingham, WA, USA, 2003a. 10565
von Clarmann, T., Glatthor, N., Grabowski, U., H ¨opfner, M., Kellmann, S., Kiefer, M., Linden,
15
A., Mengistu Tsidu, G., Milz, M., Steck, T., Stiller, G. P., Wang, D. Y., Fischer, H., Funke, B., Gil-L ´opez, S., and L ´opez-Puertas, M.: Retrieval of temperature and tangent altitude pointing from limb emission spectra recorded from space by the Michelson Interferometer for Passive Atmospheric Sounding (MIPAS), J. Geophys. Res., 108, 4736, doi:10.1029/2003JD003602, 2003b.10565
20
Zipf, E. C.: A laboratory study on the form of nitrous oxide by the reaction N2(A3Σ+u)+O2→N2O+O, Nature, 287, 523–524, 1980. 10563
Zipf, E. C. and Prasad, S.: Production of nitrous oxide in the auroral D and E regions, Nature, 287, 525–526, 1980. 10563,10575,10576
ACPD
8, 10561–10596, 2008 Mesospheric N2O enhancements observed by MIPAS B. Funke et al. Title Page Abstract Introduction Conclusions References Tables Figures ◭ ◮ ◭ ◮ Back CloseFull Screen / Esc
Printer-friendly Version Interactive Discussion N2O 20021208 0 20 40 60 80 1000 1500 2000 2500 3000 3500 4000 Potential temperature [K] 0.5 0.5 0.7 0.7 0.7 0.7 1.0 1.0 1.5 1.5 1.5 2.0 2.0 3.0 3.0 6.0 6.0 10.0 20.0 50.0 100.0 40 km 40 km 50 km 50 km 60 km 60 km 70 km ppbv 0.0 0.5 1.0 1.5 2.0 2.5 3.0 CH4 20021208 0 20 40 60 80 1000 1500 2000 2500 3000 3500 4000 100 75 100 125 150 150 175 175 200 200 200 250 250 250 300 300 400 400 500 600 800 40 km 40 km 50 km 50 km 60 km 60 km 70 km ppbv 0 50 100 150 200 250 300 N2O 20030608 -80 -60 -40 -20 0 1000 1500 2000 2500 3000 3500 4000 Potential temperature [K] 0.5 0.5 0.5 0.7 0.7 1.0 1.0 1.0 1.0 1.5 1.5 1.5 2.0 2.0 3.0 3.0 6.0 6.0 10.0 20.0 50.0 40 km 40 km 50 km 50 km 60 km 60 km 70 km ppbv 0.0 0.5 1.0 1.5 2.0 2.5 3.0 CH4 20030608 -80 -60 -40 -20 0 1000 1500 2000 2500 3000 3500 4000 75 75 100 100 125 125 150 150 175 175 200 200 250 250 300 300 400 400 500 600 800 40 km 40 km 50 km 50 km 60 km 60 km 70 km ppbv 0 50 100 150 200 250 300 N2O 20040209 0 20 40 60 80
Equivalent latitude [deg] 1000 1500 2000 2500 3000 3500 4000 Potential temperature [K] 0.5 0.5 0.7 0.7 1.0 1.0 1.5 1.5 1.5 1.5 2.0 2.0 2.0 2.0 3.0 3.0 3.0 3.0 5.0 5.0 5.0 8.0 8.0 8.0 10.0 10.0 20.0 50.0 40 km 40 km 50 km 50 km 60 km 60 km 70 km ppbv 0 2 4 6 8 10 12 CH4 20040209 0 20 40 60 80
Equivalent latitude [deg] 1000 1500 2000 2500 3000 3500 4000 50 50 50 75 75 75 100 100 125 125 150 150 175 175 200 200 250 250 300 300 400 400 500 500 600 800 40 km 40 km 50 km 50 km 60 km 60 km 70 km ppbv 0 50 100 150 200 250 300
Fig. 1. Potential temperature-equivalent latitude daily mean cross sections of N2O (left) and
CH4 (right) vmr retrieved by IMK/IAA for the NH for 8 December 2002 (top), SH for 8 June 2003 (middle), and NH for 9 February 2004 (bottom). Data versions used are V3O 8.0 (top and middle) and V3O 12.0 (bottom). Mean geometric heights are indicated by dotted white lines. Note the different scale in the bottom left panel.
ACPD
8, 10561–10596, 2008 Mesospheric N2O enhancements observed by MIPAS B. Funke et al. Title Page Abstract Introduction Conclusions References Tables Figures ◭ ◮ ◭ ◮ Back CloseFull Screen / Esc
Printer-friendly Version Interactive Discussion N2O 70S-90S EqL 10 11 12 01 02 03 04 05 06 07 08 09 10 Month of 2002/2003 30 40 50 60 70 Altitude [km] 0.5 0.5 0.5 0.5 0.5 0.5 1.0 1.0 1.0 1.0 1.0 1.0 1.0 1.5 1.5 1.5 1.5 2.0 2.0 2.0 2.0 3.0 3.0 3.0 3.0 4.0 4.0 4.0 4.0 6.0 6.0 6.0 8.0 8.0 8.0 10.0 10.0 20.01000 K50.070.0 1000 K 1500 K 1500 K 2000 K 3000 K 3000 K 4000 K ppbv -1 0 1 2 3 4 5 CH4 70S-90S EqL 10 11 12 01 02 03 04 05 06 07 08 09 10 Month of 2002/2003 30 40 50 60 70 Altitude [km] 50 50 50 50 75 75 75 75 75 100 100 100 100 100 125 125 125 125 125 125 150 150 150 150 150 150 175 175 175 175 175 175 200 200 200 200 200 250 250 250 250 300 300 300 300 300 400 400 400 500 500 6001000 K800 1000 K 1500 K 1500 K 2000 K 3000 K 3000 K 4000 K ppbv 0 100 200 300 400
Fig. 2. Temporal evolution of N2O (top) and CH4 (bottom) VMR retrieved by IMK/IAA
(Ver-sion V3O 8.0) averaged over equivalent latitudes 70–90◦S from September 2002 until October
2003. An area-weighting factor (cosine of equivalent latitude) has been applied. Mean potential temperatures are indicated by dotted white lines.