HAL Id: hal-00296568
https://hal.archives-ouvertes.fr/hal-00296568
Submitted on 11 Jun 2008
HAL is a multi-disciplinary open access
archive for the deposit and dissemination of
sci-entific research documents, whether they are
pub-lished or not. The documents may come from
teaching and research institutions in France or
abroad, or from public or private research centers.
L’archive ouverte pluridisciplinaire HAL, est
destinée au dépôt et à la diffusion de documents
scientifiques de niveau recherche, publiés ou non,
émanant des établissements d’enseignement et de
recherche français ou étrangers, des laboratoires
publics ou privés.
Cloud condensation nuclei activity at Jeju Island, Korea
in spring 2005
M. Kuwata, Y. Kondo, Y. Miyazaki, Y. Komazaki, J. H. Kim, S. S. Yum, H.
Tanimoto, H. Matsueda
To cite this version:
M. Kuwata, Y. Kondo, Y. Miyazaki, Y. Komazaki, J. H. Kim, et al.. Cloud condensation nuclei activity
at Jeju Island, Korea in spring 2005. Atmospheric Chemistry and Physics, European Geosciences
Union, 2008, 8 (11), pp.2933-2948. �hal-00296568�
© Author(s) 2008. This work is distributed under the Creative Commons Attribution 3.0 License.
Chemistry
and Physics
Cloud condensation nuclei activity at Jeju Island, Korea in spring
2005
M. Kuwata1, Y. Kondo1, Y. Miyazaki1,*, Y. Komazaki1, J. H. Kim2, S. S. Yum2, H. Tanimoto3, and H. Matsueda4 1Research Center for Advanced Science and Technology, the University of Tokyo, Tokyo, Japan
2Department of Atmospheric Science, Yonsei University, Seoul, Korea
3Atmospheric Environmental Division, National Institute for Environmental Studies, Tsukuba, Japan 4Geochemical Research Department, Meteorological Research Institute, Tsukuba, Japan
*now at: Institute of Low Temperature Science, Hokkaido University, Japan
Received: 12 October 2007 – Published in Atmos. Chem. Phys. Discuss.: 13 November 2007 Revised: 14 May 2008 – Accepted: 14 May 2008 – Published: 11 June 2008
Abstract. We measured the number concentrations of cloud condensation nuclei (CCN) and the size distributions of CCN/CN (CN: condensation nuclei) ratios at supersatura-tions (SSs) of 0.097, 0.27, 0.58, and 0.97% at Jeju Island, Korea during March-April 2005. We made simultaneous measurements of aerosol inorganic ions, water-soluble or-ganic carbon (WSOC), oror-ganic carbon (OC), and elemental carbon (EC) in PM2.5. The CCN/CN ratios increased with
in-creasing particle diameter, and the diameter at CCN/CN=0.5 was defined as D50. D50represents the activation dry
diame-ter of atmospheric particles. The average D50at SS=0.097%
and 0.97% was 136±17 nm and 31±3 nm, respectively. The temporal variation of D50 at SS=0.097% was correlated
with the mass fraction of water-soluble components (inor-ganic ions + WSOC), indicating that the temporal variation of CCN activity was mainly controlled by changes in the water-soluble components fraction. The critical dry diam-eter (Dcrit), which is the threshold dry diameter for CCN
activation, was calculated from the observed aerosol chemi-cal compositions by K¨ohler theory for comparison with D50.
The D50 at SS=0.097% was correlated (r2=0.48) with
cal-culated Dcrit, although Dcritwas larger than D50by 20–29%
on average. The systematic difference between D50and Dcrit
could be caused by the size dependence of the aerosol chem-ical compositions or surface tension lowering caused by the mixing of water-soluble organic compounds. This difference corresponds to a 27±14% uncertainty in the CCN number concentration estimated from the observed particle number size distribution.
Correspondence to: Mikinori Kuwata ([email protected])
1 Introduction
A subset of atmospheric particles acts as cloud condensation nuclei (CCN). An increase in CCN number concentration causes an increase in cloud droplet concentration and a de-crease in droplet size, which in turn impacts cloud albedo and precipitation. Consequently, CCN can significantly influence climate through cloud processes (Twomey, 1974; Lohmann and Feichter, 2005, and references therein).
The number concentration of CCN is determined by the number concentration of aerosol particles and the fraction of CCN active particles. This fraction is often denoted as the CCN/CN ratio because condensation nuclei (CN) counters have been used for total particle number concentration mea-surements (Seinfeld and Pandis, 2006). CCN/CN strongly depends on the size and chemical composition of aerosols. The influence of aerosol chemical composition and number size distribution on the bulk (size-unresolved) CCN/CN can be separated by measuring CCN/CN for size-selected par-ticles. In particular, when aerosol particles are internally mixed, we can determine the threshold diameter from the measurements (Dusek et al., 2006). The threshold diame-ter can also be calculated by K¨ohler theory. Many laboratory studies have measured CCN/CN ratios of size-selected parti-cles for comparison with theoretical calculations (e.g. Corri-gan and Novakov, 1999; Raymond and Pandis, 2002). These experiments have shown that size-resolved CCN/CN ratios of laboratory-generated particles can be explained by K¨ohler theory. However, only a few studies have employed this mea-surement method for atmospheric observations (e.g. Dusek et al., 2006), leading to an insufficient understanding of control-ling factors for the CCN activation of atmospheric particles.
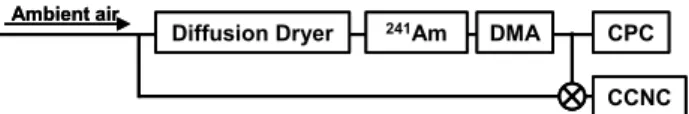
Diffusion Dryer 241Am DMA
CCNC CPC
Ambient air
Diffusion Dryer 241Am DMA
CCNC CPC
Ambient air
Fig. 1. CCN observation system used for this study. The three-way
valve placed upstream of the CCN counter was used to select the sampling mode (see text for detailed explanation).
CCN concentrations are often influenced by anthro-pogenic particles (Twomey, 1974; Hudson and Yum, 2002). In recent years, anthropogenic emission of aerosol precur-sors (e.g. SO2 and NOx) from Asia has increased
signifi-cantly (Streets et al., 2000; Akimoto et al., 2003; Richter et al., 2005). Remote sensing studies have indicated that the aerosol particles derived from anthropogenic pollutants from Asia have changed cloud radiative properties such as opti-cal depth in this region (Chameides et al., 2002; Kawamoto et al., 2006). Thus, it is important to study CCN activity in this region for a more accurate assessment of the impact of anthropogenic aerosol on climate. However, only a few CCN studies have been performed in this region (e.g. Mat-sumoto et al., 1997; Yum et al., 2005), and the size-resolved CCN/CN ratios have not been measured so far.
In this study, we have measured size-resolved CCN/CN ratios and CCN number concentrations at Gosan, Jeju Is-land, Korea, in March and April 2005 during the United Nations Environmental Programme (UNEP) Atmospheric Brown Cloud – East Asian Regional Experiment 2005 (ABC-EAREX2005) campaign. In addition to the CCN measurements, aerosol chemical composition was simulta-neously observed. Observed threshold diameters for CCN activation are compared with the mass fractions of aerosol chemical compositions. Threshold diameters for activation (Dcrit) are calculated and compared with the observed
thresh-old diameter to investigate the controlling factors of Dcrit.
2 Theory
The equilibrium water vapor pressure (S) of an aerosol par-ticle can be calculated by K¨ohler theory. According to the theory, S is described as follows (e.g. Roberts et al., 2002; Mochida et al., 2006): ln S = A dwet− Bddry3 (dwet3 −ddry3 ) A = 4Mwσ RT ρw B = Mw ρw P i viφiεimi Mi P i mi ρi (1)
where ddryis the dry diameter of a particle and dwetis the
di-ameter of a droplet under equilibrium conditions. The suffix i denotes the properties of the i-th solute compound. Mwis
the molecular weight of water; Mi is the molecular weight of
solute; ρwis the density of water; ρi is density of solute; σ
is the surface tension; R is the gas constant; T is the temper-ature; νi is the stoichiometric number of ions and molecule; φi is the osmotic coefficient; εi is the degree of dissolution;
and mi is the mass mixing ratio of the i-th solute. The first
term on the right-hand side represents an increase in the equi-librium vapor pressure of water due to surface tension (the Kelvin effect). The second term on the right-hand side de-notes the decrease in the equilibrium vapor pressure of water because of solute mixing (Raoult’s effect). When we con-sider S for an aerosol particle, it has a maximum value at a certain dwet (critical droplet diameter). The supersaturation
(SS: SS=S−1) that corresponds to this S is called the criti-cal supersaturation (SSc). Particles can be activated to cloud
droplets if the SS of the environment is higher than their SSc.
If we assume that A and B are constants and dwetis much
larger than ddry, SSccan be expressed as follows:
ln(1 + SSc)= v u u t 4A3 27Bddry3 . (2)
This equation shows that SSc decreases with particle di-ameter. Thus, at a certain SS, there exists a threshold value of ddryabove which all aerosol particles act as CCN. We
de-note this diameter as the critical dry diameter (Dcrit).
3 Experiment 3.1 CCN measurement
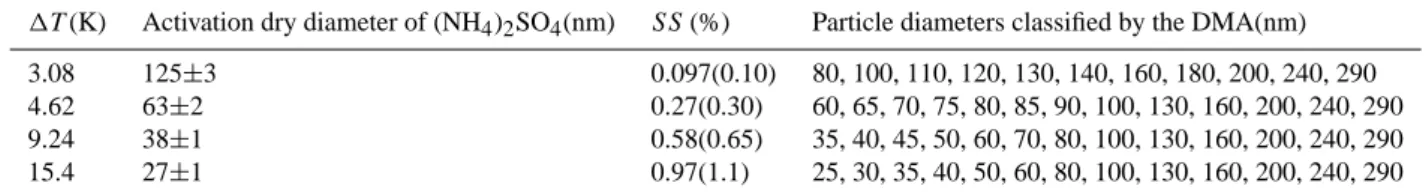
Figure 1 shows the CCN observation system used for this study. In this system, the relative humidity of the sample flow was reduced using two diffusion dryers in series (TSI Model 3062). Silica gel was replaced periodically (about 1 time in 10 days), and no systematic change in size-resolved CCN spectra was observed before or after the replacement. Then, particles were charged with a241Am bipolar neutral-izer and introduced to a differential mobility analyzer (DMA: TSI Model 3081). The DMA classified particles by their electrical mobility. The voltage applied to the DMA was scanned stepwise to change the diameter of the classified par-ticle (Table 1). The sheath to-sample flow ratio of the DMA was set to 10:1. Classified particles were introduced to a condensation particle counter (CPC: TSI Model 3022) and a cloud condensation nuclei counter (CCNC: Droplet Mea-surement Technologies, Inc.) (Roberts and Nenes, 2005). The CPC monitored the number concentrations of conden-sation nuclei (CN), and the CCNC measured number con-centrations of CCN. The sample flow rate of the CCNC was set to 0.045 l/min, and the sheath flow rate was set to 0.455 l/min. The temperature gradient (1T ) of the thermal gradient chamber in the CCNC was changed periodically to alter the SS in the chamber. Four 1T s (3.08, 4.62, 9.24, and 15.4 K) were used in this study. SSs corresponding to these 1Ts were calibrated with ammonium sulfate particles
Table 1. Calibration results and operating conditions of the CCN measurement system shown in Fig. 1. SS was calculated at 300 K and
72 mN/m by the ideal solution approximation. The values in parentheses show SS calculated using the osmotic coefficient of Clegg et al. (1996).
1T (K) Activation dry diameter of (NH4)2SO4(nm) SS (%) Particle diameters classified by the DMA(nm)
3.08 125±3 0.097(0.10) 80, 100, 110, 120, 130, 140, 160, 180, 200, 240, 290
4.62 63±2 0.27(0.30) 60, 65, 70, 75, 80, 85, 90, 100, 130, 160, 200, 240, 290
9.24 38±1 0.58(0.65) 35, 40, 45, 50, 60, 70, 80, 100, 130, 160, 200, 240, 290
15.4 27±1 0.97(1.1) 25, 30, 35, 40, 50, 60, 80, 100, 130, 160, 200, 240, 290
as described by Kuwata et al. (2007). The calibration was performed at the observation site before and after the cam-paign. There are several different methods for the calculation of the water activity of ammonium sulfate particles (Krei-denweis et al., 2005, and references therein). We chose the ideal solution approximation (φ=1) in calculating the Dcrit
of atmospheric particles (Sect. 5). Therefore we used this approximation for the interpretation of the calibration results to ensure consistency, although SSs calculated using the os-motic coefficient of Clegg et al. (1996) are likely to be more plausible than the ideal solution approximation, as it is based on precise experimental data. We also show SSs calculated using the osmotic coefficients by Clegg et al. (1996) for ref-erence in parentheses in Table 1. The Debye – H¨uckel con-stant is needed to calculate the osmotic coefficient of Clegg et al. (1996) because it is based on the Pitzer model. The Debye – H¨uckel constant at 300 K was calculated by the equation given by Clegg et al. (1994).
Multiply charged particles were included in the classified particles, therefore an inverse analysis was performed for CCN and CN size distribution data for multiple-charge cor-rection. The STWOM algorithm (Markowski, 1987) was used to obtain size distributions of CN and CCN. In this calculation, the equilibrium charge distribution (Wieden-sohler, 1988) and the DMA transfer function derived by Knutson and Whitby (1975) were included in the kernel function. The raw data for CN and CCN were linearly inter-polated so that the interval of each bin was 1 log dp=0.015.
Size-resolved CCN/CN ratios were calculated using the data after the inverse analysis.
The three-way valve in Fig. 1 was switched once every 30 min for the direct measurement of the CCN number con-centration in ambient air. It took 30 min for the measurement at each SS, and 2 h were required for the entire measurement cycle.
3.2 Measurements of aerosol composition, size distribution
Inorganic components (NH+4, Na+, K+, Ca2+, Mg2+, NO−3, SO2−4 , Cl−) were measured by a particle-into-liquid sampler combined with ion chromatography (PILS-IC) (Orsini et al., 2003; Takegawa et al., 2005). The concentration of
water-soluble organic carbon (WSOC) was measured by PILS com-bined with a total organic carbon analyzer (PILS-WSOC) (Sullivan et al., 2004; Miyazaki et al., 2006, 2007). El-emental carbon (EC) and organic carbon (OC) were mea-sured by a semi-continuous thermal-optical carbon aerosol analyzer (Sunset Laboratory, Inc.) (Bae et al., 2004; Kondo et al., 2006; Miyazaki et al., 2006). PM2.5 cyclones were
used for these instruments. The detection limits of the PILS-IC, PILS-WSOC, OC, and EC were estimated to be 0.01 µg/m3, 0.1 µg/m3, 1.0 µg/m3, and 0.2 µg/m3, respec-tively (Takegawa et al., 2005; Kondo et al., 2006; Miyazaki et al., 2006).
Aerosol number size distribution (10–300 nm) was mea-sured with a scanning mobility particle sizer (SMPS 3936, TSI). The SMPS used in this study comprised a DMA (TSI Model 3081) and a CPC (TSI Model 3010). In addition, the number concentration of particles larger than 10 nm (CN) was measured by another CPC (TSI Model 3010) (Yum et al., 2007). The concentration of carbon monoxide (CO) was measured using a non-dispersive infrared analyzer (Horiba APMA-360 model) (Tanimoto et al., 2007).
3.3 Measurement site
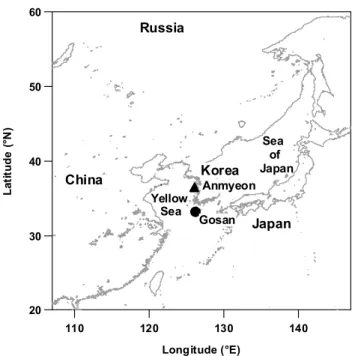
The observations were performed between 18 March and 5 April 2005 at Gosan (33.2◦N, 126.1◦E) on Jeju Island,
Ko-rea, as part of the Atmospheric Brown Cloud – East Asian Regional Experiment 2005 campaign. The location of Gosan is shown in Fig. 2. The instruments were placed in a con-tainer located about 10 m back from the edge of a cliff. The sampling inlets were made of stainless steel tubes with an in-ner diameter of 7 mm. The top of the inlets was located about 4 m a.g.l.
The meteorological parameters at the Gosan site were observed by the Korean Meteorological Administration (KMA). During the observation period, the dominant winds were northerlies and north-northwesterlies (more than 50% of the observation period) associated with the Siberian high-pressure system. This led to the frequent transport of anthro-pogenic pollutants from the Korean Peninsula and China to Gosan. Sawa et al. (2007) attributed the high concentrations of CO at Gosan to the emissions from these regions based
60 50 40 30 20 L a ti tu d e ( °N ) 140 130 120 110 Longitude (°E) Gosan Anmyeon Japan Korea Sea of Japan China Russia Yellow Sea
Fig. 2. Map of Gosan and surrounding region.
on tagged CO-tracer simulations. More detailed descriptions of the meteorological conditions and the transport of anthro-pogenic pollutants can be found elsewhere (Sawa et al., 2007; Miyazaki et al., 2007). Previous studies have also shown that air masses observed at Gosan are heavily influenced by anthropogenic emissions from East Asia (Carmichael et al., 1997; Lee et al., 2006).
4 Results
4.1 CCN/CN size distributions
Figure 3 shows the average size-resolved CCN/CN ratio at SS=0.097%, together with the data on specific days. The CCN/CN size distribution of ammonium sulfate obtained during calibration at the observation site (closed circles) is also shown in this figure for comparison. In general, CCN/CN increases with increasing diameter. At 02:00– 02:30 on 26 March, the CCN/CN size distribution of ambient particles was very similar to that of ammonium sulfate. On the other hand, on 28 March, the CCN/CN size distribution shifted to a larger diameter, and the rate of increase was lower than ammonium sulfate. In addition, the spectrum is signifi-cantly different from a sigmoid function. This shift indicates that the bulk aerosol chemical composition on 28 March was significantly different from ammonium sulfate. The slower rate of increase indicates the co-existence of different types of aerosol particles with different activation curves. A con-volution of sigmoid functions is not necessarily a sigmoid function. Thus, the non-sigmoid shape of the spectrum can be interpreted as a result of the co-existence of different types
1.0 0.5 0.0 C C N /C N 250 200 150 100 Mobility diameter (nm) (NH4)2SO4 Average 3/26 (2:00 - 2:30) 3/28 (22:00 - 22:30)
Fig. 3. Size distributions of CCN/CN ratios of ammonium sulfate
and atmospheric particles at SS=0.097%. The average, standard de-viation (gray area), and two examples of CCN/CN during the obser-vation period are shown. The solid circles denote the experimental data for ammonium sulfate under the observation conditions and the solid line shows the fitting results of the experimental data.
of aerosol particles. The different width of the DMA trans-fer function at D50in diameter space (∼25%: estimated by a
Knutson-type DMA transfer function) is not large enough to explain the lower increase rate, as the widths of the activation curves are different by about a factor of 2.
We defined the threshold diameter for CCN activation to compare it with the mass fraction of chemical compounds and theoretically calculated Dcrit. In this study, the
thresh-old diameter was defined as the diameter corresponding to CCN/CN=0.5(D50) because it represents the bulk chemical
composition. If aerosol particles were not fully activated, D50would not necessarily correspond to the threshold
diam-eter. In all cases shown in Fig. 3, the CCN/CN ratios ex-ceeded 0.85 at 250 nm. In addition, no multi-step activation was observed. These results suggest the appropriateness of the definition of the unique activation diameter (D50).
Previ-ous studies on CCN activity of laboratory-generated particles have shown that D50 can be quantitatively compared with
the theoretically calculated activation diameters (e.g. Corri-gan and Novakov, 1999; Raymond and Pandis, 2002).
4.2 Temporal variation of CCN and particle number size distribution
4.2.1 CCN number concentration
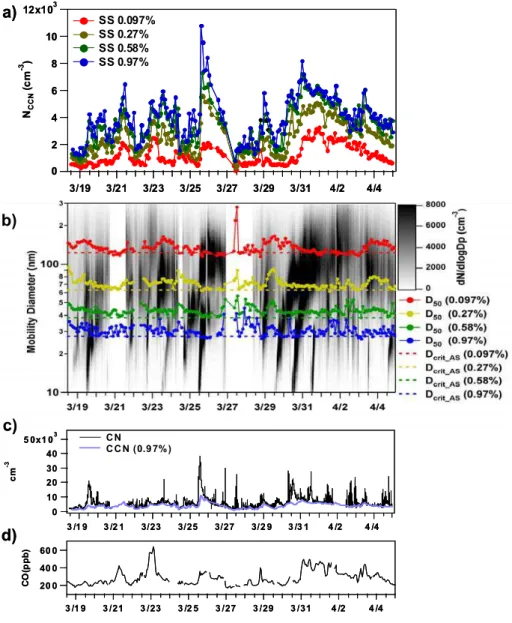
Figure 4a shows the time series of the CCN number con-centration. In general, the variation in the CCN number concentration was correlated with that of CO concentration (Fig. 4d). In particular, this correlation is clearly observed at SS=0.097% (r2=0.74). Sawa et al. (2007) have reported high CO concentration between 22–24 March and 30 March– 2 April due to transport of CO from the Korean Peninsula and China. During these periods, CCN concentration also increased (Fig. 4a and d). CO is emitted mainly by the in-complete combustion of fossil fuels and biomass, and it is a
12x103 10 8 6 4 2 0 NC C N (c m -3 ) 3/19 3/21 3/23 3/25 3/27 3/29 3/31 4/2 4/4 SS 0.097% SS 0.27% SS 0.58% SS 0.97%
b)
5 0x1 03 40 30 20 10 0 c m -3 3 /1 9 3 /2 1 3/23 3/25 3/27 3/2 9 3 /3 1 4 /2 4 /4 C N C C N (0.9 7% ) 60 0 40 0 20 0 C O (p p b ) 3 /1 9 3 /21 3 /23 3 /2 5 3 /27 3 /29 3 /31 4 /2 4 /4d)
c)
a)
12x103 10 8 6 4 2 0 NC C N (c m -3 ) 3/19 3/21 3/23 3/25 3/27 3/29 3/31 4/2 4/4 SS 0.097% SS 0.27% SS 0.58% SS 0.97%b)
5 0x1 03 40 30 20 10 0 c m -3 3 /1 9 3 /2 1 3/23 3/25 3/27 3/2 9 3 /3 1 4 /2 4 /4 C N C C N (0.9 7% ) 60 0 40 0 20 0 C O (p p b ) 3 /1 9 3 /21 3 /23 3 /2 5 3 /27 3 /29 3 /31 4 /2 4 /4d)
c)
a)
Fig. 4. Time series of (a) CCN number concentration, (b) aerosol size distribution, D50, (c) CN concentration, CCN (SS=0.97%)
concen-tration, and (d) CO concentration. The dashed lines in (b) shows the Dcritof ammonium sulfate at each SS.
good indicator of emissions from combustion sources. Pri-mary aerosols and aerosol precursors such as SO2and NOx
are co-emitted with CO. Thus, these high CCN concentra-tions were likely caused by the enhanced concentraconcentra-tions of anthropogenic aerosols transported from these regions. The average values and standard deviations of CCN number con-centration are shown in Table 2. The average CCN number concentration at SS=0.097% and 0.97% was 1200 cm−3and 4000 cm−3, respectively. These concentrations are higher than those of other remote areas of the world such as the Island of Tasmania in Australia and Mace Head in Ireland by about an order of magnitude (Covert et al., 1998; Reade et al., 2006). CCN concentrations measured at Gosan during this observation period were extensively compared with those ob-tained in other regions by Yum et al. (2007). The CCN
con-centrations observed in this study are close to those of An-myeon (Korea: see Fig. 2) in springtime of 2004 (SS=1%) (Yum et al., 2005).
4.2.2 D50
Figure 4b shows the time series of the number size distribu-tion of aerosol particles and D50. The Dcrit of ammonium
sulfate at each SS is also shown as dashed lines in this fig-ure. The average values of D50 at SS=0.097% and 0.97%
were 136 nm and 31 nm, respectively (Table 2). In general, the D50is almost equal to or slightly larger (by ∼25%) than
the Dcrit of ammonium sulfate (125 nm and 27 nm,
respec-tively). This means that the Dcritof ammonium sulfate is the
smallest Dcrit of the atmospheric particles during the
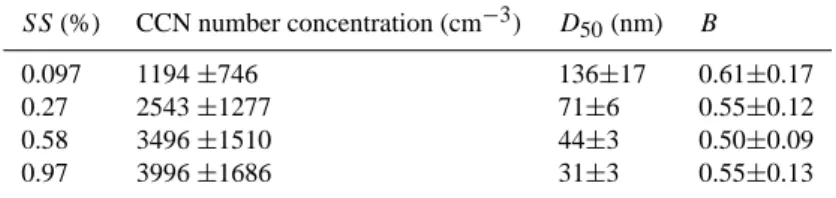
Table 2. Average values and standard deviations of the CCN number concentration, D50, and B. The surface tension of water was assumed
for the calculation of B.
SS (%) CCN number concentration (cm−3) D50(nm) B
0.097 1194 ±746 136±17 0.61±0.17
0.27 2543 ±1277 71±6 0.55±0.12
0.58 3496 ±1510 44±3 0.50±0.09
0.97 3996 ±1686 31±3 0.55±0.13
The temporal variation of D50at different SSs did not
al-ways correlate. As shown in Eq. (2), the threshold diameter for CCN activation depends on A and B, which are deter-mined by the aerosol chemical composition. Thus, this dif-ference in the temporal variations of D50at each SS indicates
the difference in temporal variation of chemical composition in different size ranges.
Using Eq. (2), we calculated B assuming the surface ten-sion of water. This parameter gives information on the chem-ical composition (approximate number of solute ions and molecules included in a unit volume) at D50 for each SS.
The results are summarized in Table 2. The average values of B did not depend on SS significantly, indicating that the chemical composition averaged over the observation period was rather uniform in the diameter range considered (30 to 160 nm).
4.2.3 Number size distribution
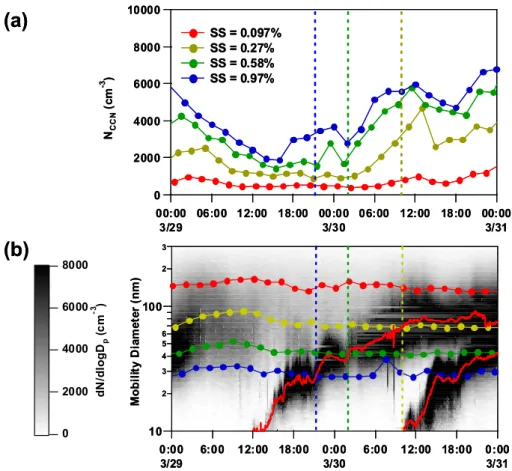
New particle formation events can have a significant impact on CCN number concentration (e.g. O’Dowd et al., 2002; Laaksonen et al., 2005). In Fig. 4b, new particle forma-tion is clearly identified on 19, 25, 29, 30 and 31 March. It can be seen more clearly in Fig .4c, which shows the parti-cle number concentration measured by CPC and CCN num-ber concentration (SS=0.97%). The concentration of CCN (SS=0.97%) is a good indicator of particle number concen-trations larger than 30 nm, as the average value of D50 at SS=0.97% is 31±3 nm (Table 2). Thus, the difference of the number concentrations (CN-CCN (SS=0.97%)) repre-sents the number concentration of particles between 10 and 30 nm. During the periods of new particle formation events described above, an enhancement of the number concentra-tion of small (10–30 nm) particles was observed, as indicated by the large gap between CN and CCN concentrations. In particular, the events occurring on 29 and 30 March were important in that newly formed particles influenced the CCN number concentration as a consequence of particle growth beyond D50. Figure 5a and b shows the CCN number
con-centrations, particle size distributions, and D50 during this
event. The peak diameter of the size distribution obtained by bimodal lognormal fitting is shown as red lines in Fig. 5b.
At 14:00 local time (LT) on 29 March, small (<20-nm) particles appeared and began to grow. The peak diameter grew to 25 nm by 18:00 LT, and some particles grew larger than the D50at SS=0.97% (28 nm). At this time, the CCN
number concentration (SS=0.97%) began to increase. The peak diameter and D50(SS=0.97%) were equal at 21:00 LT
(blue dashed vertical line in Fig. 5b). At this time, the majority of newly formed particles began to act as CCN at SS=0.97%. In the case of SS=0.58%, the peak diam-eter equaled D50 at 2:00 LT on 30 March , and the CCN
number concentration increased from 1700 cm−3(01:30 LT) to 5800 cm−3 (11:30 ˙LT). At 03:00 LT, some portion of the particles grew large enough to act as CCN at SS=0.27%. Then, CCN number concentration at SS=0.27% increased from 1000 to 4700 cm−3with the increase in the peak diam-eter. For this SS, the peak diameter reached D50at 10:00 LT.
At the same time, another new particle formation event oc-curred, and this event also clearly affected the CCN num-ber concentration at SS=0.97% and 0.58%. At 12:00 LT, some fraction of the particles grew larger than the D50 at SS=0.097%, and they affected the CCN number concentra-tion at this SS. A similar phenomenon was also observed on 25 March (Fig. 4a and b). These results clearly show that the newly formed particles significantly increased the CCN number concentration.
Buzorius et al. (2004) have shown that the deliques-cence relative humidity and the hygroscopic growth of newly formed particles at Gosan during the ACE-Asia campaign were similar to those of ammonium sulfate. This suggests that newly formed particles were mainly composed of in-organic compounds because no in-organic compounds in the atmosphere are known to be as hygroscopic as ammonium sulfate. In addition, according to Buzorius et al. (2004), glu-taric acid is the only organic compound that is known to have a deliquescence relative humidity similar to ammonium sul-fate. However, the hygroscopic growth of glutaric acid is less than ammonium sulfate. For instance, Cruz and Pan-dis (2000) measured the hygroscopic growth factors of glu-taric acid and ammonium sulfate particles to be 1.1 and 1.5 at a relative humidity of 85%, respectively. This also supports the conclusion of their study that newly formed particles were mainly composed of ammonium sulfate at Gosan. In the present study, the observed D50of newly formed particles
10 2 3 4 5 6 100 2 3 M o b il it y D ia m e te r (n m ) 0:00 3/29 6:00 12:00 18:00 0:00 3/30 6:00 12:00 18:00 0:00 3/31 8000 6000 4000 2000 0 d N /d lo g Dp (c m -3 )
(a)
(b)
10000 8000 6000 4000 2000 0 NC C N (c m -3 ) 00:00 3/29 06:00 12:00 18:00 00:00 3/30 06:00 12:00 18:00 00:00 3/31 SS = 0.097% SS = 0.27% SS = 0.58% SS = 0.97% 10 2 3 4 5 6 100 2 3 M o b il it y D ia m e te r (n m ) 0:00 3/29 6:00 12:00 18:00 0:00 3/30 6:00 12:00 18:00 0:00 3/31 8000 6000 4000 2000 0 d N /d lo g Dp (c m -3 )(a)
(b)
10000 8000 6000 4000 2000 0 NC C N (c m -3 ) 00:00 3/29 06:00 12:00 18:00 00:00 3/30 06:00 12:00 18:00 00:00 3/31 SS = 0.097% SS = 0.27% SS = 0.58% SS = 0.97%Fig. 5. Close-up of Fig. 4 during the new particle formation events from 29–31 March. The (a) time series of CCN number concentration and (b) the number size distribution and D50(line with filled circles) are shown. The red solid lines in (b) denote the peak diameters obtained by
bimodal lognormal fitting. The vertical dashed lines show the time at which the peak diameter and D50were equal.
was also similar to ammonium sulfate. For instance, the D50
for SS=0.97% was 27 nm at 21:00 LT, 29 March, and for SS=0.27% it was 66 nm at 10:00 LT, 30 March. The Dcritof
ammonium sulfate was 27 nm and 63 nm, respectively (Ta-ble 1).
Previous studies have suggested that new particle forma-tion has an impact on the CCN number concentraforma-tion from the measurements of number size distributions (e.g. O’Dowd et al., 2002; Laaksonen et al., 2005) and modeling (e.g. Arnold, 2006; Sotiropoulou et al., 2006). The present ob-servations clearly demonstrate that new particle formation is one of the important processes of CCN formation at Gosan.
Figure 6 shows the number size distribution of all parti-cles and CCN averaged over the whole observation period. Average CCN/CN ratios were multiplied by the number size distribution measured by the SMPS averaged over the ob-servation period to obtain a rough estimate of the CCN size distribution. The peak diameter of the average CCN size distribution was about 150 nm at SS=0.097% and shifted to about 80 nm at SS=0.97%. Detailed discussion of the num-ber size distribution of particles during the observation pe-riod has been given by Yum et al. (2007).
6000 4000 2000 0 d N /d lo g D p ( c m -3 ) 10 2 3 4 5 6 7 8 9100 2 Mobility diameter (nm) all particles CCN (0.097%) CCN (0.27%) CCN (0.58%) CCN (0.97%)
Fig. 6. Number size distribution of particles and CCN. CCN size
distributions were estimated by multiplying CCN/CN ratios by the number size distribution. The data were averaged over the whole observation period. The data range of CCN size distributions was limited by the scanning range of the DMA.
0.5 0.0 2 S O4 2 - +N O3 - (μ m o l/ m 3 ) 0.5 0.0 NH4+ (μmol/m3) intercept = 0.02 slope = 0.94 r2 = 0.91
Fig. 7. Ion balance between ammonium, sulfate, and nitrate ions.
4.3 Ion balance of inorganic components
The average concentrations of the inorganic components measured by PILS-IC are summarized in Table 3. NH+4 was the most abundant cation (56%), and Ca2+was the second (15%). SO2−4 was the most abundant anion (67%). Top-ping et al. (2004) measured inorganic components using a Berner impactor at Gosan during the ACE-Asia campaign. They showed that the concentration of NH+4 was the high-est at the 0.2–0.5 µm stage, and Ca2+was the highest at the 1.5–5.5 µm stage. In this study, the D50values were in the
sub-micrometer range (Fig. 4). Thus, Ca2+was ignored in the following discussion of CCN activity. Na+, Mg2+, and Cl−were also ignored for the same reason.
Figure 7 shows the ion balance of NH+4, NO−3, and SO2−4 . The cation and anions balance very well (slope=0.94). This result shows that sulfate and nitrate in PM2.5 were
neutral-ized by ammonium at Gosan. The addition of K+to the ion
balance causes the balance to deviate from the 1:1 line. This suggests that neither NO−3 nor SO2−4 were the counter ions of K+. In addition, because the molar concentration of K+was only 8% of NH+4, we ignored K+. In the following discus-sion, we assume that the inorganic component of sub-micron particles was composed only of ammonium sulfate and am-monium nitrate.
5 Discussion
5.1 Temporal variation of D50and aerosol composition
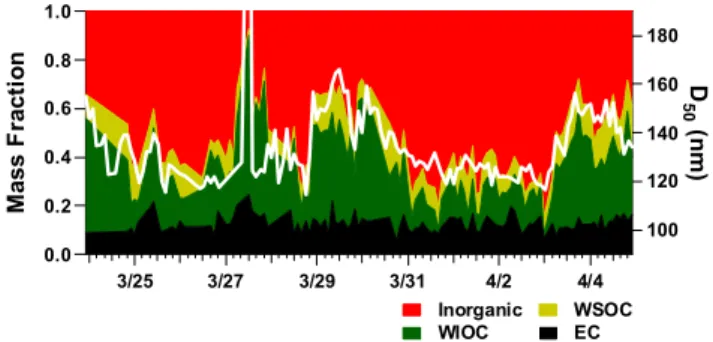
Figure 8 shows the temporal variation of D50 (SS=0.097%)
and the mass fraction of the aerosol components. In this fig-ure, the aerosol components were divided into four groups: inorganic (NH+4 + SO2−4 + NO−3), WSOC, water-insoluble
1.0 0.8 0.6 0.4 0.2 0.0 M a s s F ra c ti o n 3/25 3/27 3/29 3/31 4/2 4/4 180 160 140 120 100 D 5 0 (n m ) Inorganic WSOC WIOC EC
Fig. 8. Temporal variation of the mass fraction of aerosol
compo-nents and D50at SS=0.097%. Here, “inorganic” denotes the sum
of ammonium sulfate and ammonium nitrate.
organic carbon (WIOC = OC – WSOC), and EC. Inorganic components and WSOC are soluble in water, while WIOC and EC are insoluble in water. Note that the masses of WSOC and WIOC are the masses of carbon in organic com-pounds and do not include the masses of other elements (e.g. oxygen and hydrogen) (Kondo et al., 2007). The temporal variation of D50and the water-soluble fraction (inorganic +
WSOC) are correlated. With an increase in the water-soluble fraction, D50decreases. This is consistent with K¨ohler
the-ory because the value of B in Eq. (2) increases with an in-crease in the water-soluble fraction. In this case, the vari-ation in D50 was as small as about 40 nm. Thus, D50 is
correlated with the water-soluble fraction almost linearly, al-though the relationship is not always linear, as anticipated from Eqs. (1) and (2). This good correlation indicates that the variation of D50 was not significantly influenced by the
variation in the chemical composition of the water-soluble component (e.g change of inorganic/WSOC ratio). Kim et al. (2006) have shown that the hygroscopicity of aerosol par-ticles at Gosan was correlated with the mass fraction of sul-fate. This indicates that B is mainly determined by inorganic components because hygroscopicity is mainly determined by B (e.g. Kreidenweis et al., 2005; Mochida et al., 2006). This is consistent with the present observations because the mass fraction of inorganic compounds was significantly larger than that of WSOC during this period (Fig. 8).
The D50at SS=0.097% did not necessarily correlate with
those of higher SSs (Fig. 4b), as discussed in Sect. 4.2.2. Correlation of D50 at SS=0.097% with those at higher SSs
decreased with the increase in SS (r2=0.25 and 0.00 for SS=0.27% and 0.97%, respectively). This indicates that the temporal variation of the mass fraction of PM2.5 was
reflected in that of D50 at SS=0.097% (100–200 nm) but
was not reflected in D50 at higher SSs (<100 nm). This is
because the contribution to the PM2.5 mass concentration
of particles with diameters smaller than 100 nm was much smaller than that of 100–200 nm.
Table 3. Average concentration of inorganic components during the observation period.
NH+4 Na+ K+ Ca2+ Mg2+ NO−3 SO2−4 Cl−
1.57 (µg/m3) 0.38 0.26 0.43 0.18 1.44 3.96 0.49
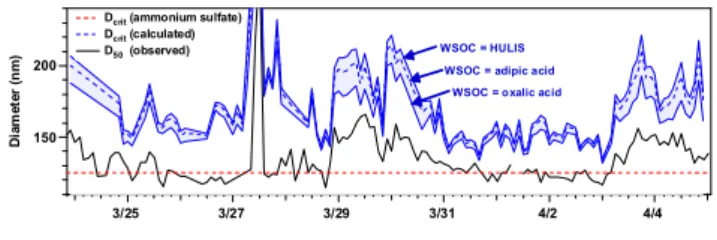
5.2 Comparison of D50and calculated Dcrit
In this section, we compare the observed D50 and the Dcrit
calculated from the simultaneously measured chemical com-position. We first discuss the assumptions used to calculate A and B in K¨ohler theory (Sect. 2). The surface tension of water (72 mN/m) was assumed for the calculation of A. The calculation was performed at T =300 K. For the calculation of B, the ideal solution approximation (φ=1) was used. We used the simultaneously measured aerosol chemical compo-sition (PM2.5) assuming that chemical composition was not
size-dependent. Assumptions regarding the chemical com-position and chemical properties of organic compounds (e.g. molecular weight (MW), elemental ratio, density) are also required for the calculation of B. Kawamura et al. (2003) and Mochida et al. (2003) measured dicarboxylic acids and other water-soluble organic compounds over the Sea of Japan and Yellow Sea during the ACE-Asia campaign. The con-centration of oxalic acid was higher than that of other com-pounds by an order of magnitude. Simoneit et al. (2004) also measured dicarboxylic acids at Gosan during the ACE-Asia campaign. Adipic acid was the largest-MW linear molecule among the dicarboxylic acids they measured. Oxalic acid has one of the smallest molecular weights among atmospheric aerosol organic compounds. Therefore, if we assume that all carbon atoms in WSOC originated from oxalic acid, we will estimate a maximum Raoult’s effect. In this study, this assumption is called as “oxalic acid assumption”. As an ex-treme case, we calculated Dcrit using this assumption. The
average molecular weight of WSOC should be higher than that of oxalic acid because dicarboxylic acids and saccha-rides with larger molecular weights were also observed at Gosan (Simoneit et al., 2004). In fact, Miyazaki et al. (2007) indicated that a significant portion of WSOC measured dur-ing the ABC-EAREX2005 campaign could be attributed to organic compounds having a MW larger than oxalic acid. To test the sensitivity of Dcrit to the assumed WSOC
com-position, we also calculated Dcrit assuming that the
aver-age properties (MW, elemental composition, and density) of water-soluble organic compounds are equal to those of adipic acid. In this study, this assumption is called the “adipic acid assumption”, although this does not mean that all WSOC originated from adipic acid. In addition, recent studies have shown that significant fractions (20–60%) of WSOC are high-molecular weight compounds such as humic-like substances (HULIS) (Graber and Rudich, 2006, and refer-ences therein). Calculating Dcrit under the assumption that
200 150 D ia m e te r (n m ) 3/25 3/27 3/29 3/31 4/2 4/4
WSOC = oxalic acid WSOC = adipic acid WSOC = HULIS
Dcrit (ammonium sulfate)
Dcrit (calculated)
D50 (observed)
Fig. 9. Comparison of observed D50 and calculated Dcrit at
SS=0.097%. The upper and lower blue lines were calculated
us-ing the “HULIS assumption” and “oxalic acid assumption”, respec-tively. See text for details of the calculations.
all WSOC originated from HULIS (HULIS assumption) cor-responds to the lowest estimate of Raoult’s effect. As in other cases, we need the chemical properties of HULIS for the calculation, although chemical properties of HULIS vary depending on the samples used (Graber and Rudich, 2006). For this calculation, we assumed an elemental composition of HULIS of C: H: O=1: 1.16: 0.63 (Dinar et al., 2006a), a density of 1.5 g/cm3 (Dinar et al., 2006b; Hoffer et al.,
2006), and an average molecular weight of 700 Da (Dinar et al., 2006a). In these calculations, water-soluble organic compounds were assumed to be completely dissolved in wa-ter (ε=1).
The chemical properties of WIOC are also required for the calculation of B. Simoneit et al. (2004) have measured alkanes, fatty acids, and polycyclic aromatic hydrocarbons (PAHs) at Gosan. Among these compounds, the mass frac-tions of PAHs were very limited. Most of the carbon atoms of alkanes and fatty acids are in methylene groups (−CH2−).
Therefore, we assumed that all carbon atoms in WIOC orig-inated from methylene groups. The density of WIOC was assumed to be 0.8 g/cm3because the densities of hydrocar-bons and fatty acids are typically 0.7–0.9 g/cm3 (Pang et al., 2006). The properties of EC were assumed to be equal to those of graphite. The values used for the calculation are summarized in Table 4.
The observed D50 and calculated Dcritat SS=0.097% are
compared in Fig. 9. This figure shows three calculated re-sults based on the oxalic acid, adipic acid, and HULIS as-sumptions. In all cases, the temporal variations of the cal-culated Dcrit correlate with the observed D50. However, the
calculated Dcritvalues are systematically larger than the
ob-servations by 20–29%.
The correlations of D50 and the calculated Dcrit (adipic
Table 4. Values used for the calculation of Dcrit. υ for WIOC and EC are not shown here because they are insoluble in water.
Assumed composition Molecular weight(MW) υ ρ(g/cm3)
Ammonium sulfate (NH4)2SO4 132.14 3 1.77
Ammonium nitrate NH4NO3 80.04 2 1.72
WSOC (oxalic acid) (COOH)2 90.04 1 1.9
WSOC (adipic acid) HOOC(CH2)4COOH 146.14 1 1.36
WSOC (HULIS) CH1.16O0.63 700 1 1.5
WIOC (–CH2–) 14/carbon atom N/A 0.8
EC C (graphite) 12/carbon atom N/A 2.0
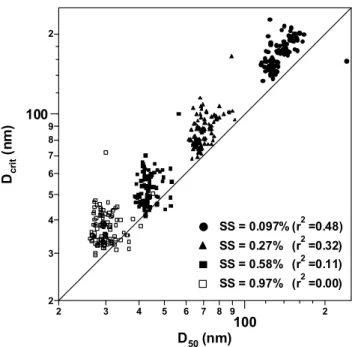
2 3 4 5 6 7 8 9 100 2 Dc ri t (n m ) 2 3 4 5 6 7 8 9 100 2 D50 (nm) SS = 0.097% (r2 =0.48) SS = 0.27% (r2 =0.32) SS = 0.58% (r2 =0.11) SS = 0.97% (r2 =0.00)
Fig. 10. Scatter plot of D50 (observed) and calculated Dcrit
(cal-culated). The adipic acid assumption was used for the calculation shown in this figure.
calculated diameters are larger than the observations. The differences between the calculated Dcrit and the observed D50(calc–obs) are summarized in Table 5. In all cases, Dcrit
was overestimated by 16–29%.
The r2 values decrease with increasing SS (diminishing D50). This is likely due to the size dependence of the
tem-poral variation of the aerosol chemical composition, as dis-cussed in Sect. 4.2.2.
5.3 Possible causes of the discrepancy
In this section, we discuss the possible causes of the differ-ence between D50and Dcritand identify critical assumptions
for the calculation of Dcrit.
In calculating B, we assumed the composition and chem-ical properties of each component. The average
chemi-cal properties of water-soluble organic compounds were as-sumed to be identical to those of oxalic acid, adipic acid, or HULIS. Nevertheless, the Dcritvalues were larger than D50
even in the case of the oxalic acid assumption (the maximum estimation of B). Therefore, the assumption of the chemical composition of WSOC is not the main cause of this discrep-ancy.
We assumed a density of 0.8 g/cm3 for water-insoluble organic compounds. If the actual density were larger than this value, this would lead to the overestimation of Dcrit
be-cause of the underestimation of B (Eq. 1). However, a sen-sitivity study of the density of WIOC (up to 1.2 g/cm3) un-der the oxalic acid assumption showed that calculated Dcrit
still overestimated the observations (Dcrit–D50=20±12 nm at SS=0.097%).
The assumption of complete dissolution corresponds to the upper limit in estimated B, and therefore the lower limit of Dcrit. For instance, Huff Hartz et al. (2006) showed that the Dcrit of slightly soluble organic compounds calculated
us-ing the complete dissolution assumption is smaller than Dcrit
calculated assuming limited solubility. We used the ideal so-lution approximation in the calculation. If the discrepancy is due to this effect, the osmotic coefficient at the critical droplet diameters needs to be increased by a factor of about 2, considering the magnitude of the discrepancy (Table 5) and Eq. (2). Nevertheless, such a large change in the osmotic coefficient is unlikely, as the solution was very dilute at the critical droplet diameters.
In this study, the aerosol chemical composition was mea-sured at PM2.5. If the chemical compositions of PM2.5 do
not represent those at D50 (<200 nm), it causes an error in
the calculation of Dcrit. We discuss this point in detail in
Sect. 5.3.1.
The surface tension of water was assumed for the calcula-tion of A in Eq. (2). If the decrease in surface tension due to WSOC was significant, it may affect the Dcrit(Facchini et
Table 5. Differences between D50 (observed) and calculated Dcrit (Dcrit–D50). The values in parentheses show the magnitude of the
difference in %. “Oxalic acid”, “adipic acid”, and “HULIS” show the oxalic acid, adipic acid, and HULIS assumptions, respectively.
SS=0.097% 0.27% 0.58% 0.97% Oxalic acid 27±18(nm) 13±10 7 ± 7 6±6 (20±12%) (18±13%) (16±15%) (21±19%) Adipic acid 34±19 17±11 9±8 8±6 (26±13%) (24±15%) (22±17%) (27±22%) HULIS 39±20 17±12 10±8 8±7 (29±14%) (25±16%) (23±18%) (26±23%)
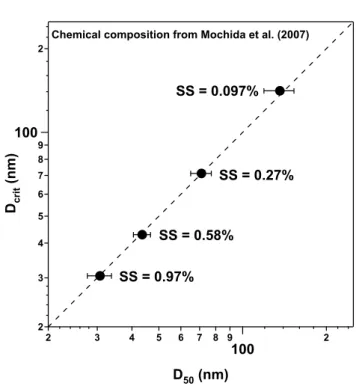
5.3.1 Size dependence of chemical composition
Some studies have used size-resolved aerosol chemical com-position for CCN closure studies (e.g. Cantrell et al., 2001; Roberts et al., 2002). These studies have shown the size-dependence of aerosol chemical composition. In addition, Medina et al. (2007) have shown that the use of size-resolved chemical composition can decrease the error in the closure of the CCN number concentration. Topping et al. (2004) measured size-resolved chemical composition at Gosan dur-ing the ACE-Asia campaign usdur-ing a Berner impactor. They reported the size distribution of mass fractions of inorganic compounds and WSOC, and the results clearly showed the size-dependence. However, it is difficult to use their results to estimate the effect of size dependent chemical composi-tion because they did not measure water-insoluble compo-nents of the impactor samples. Mochida et al. (2007) mea-sured aerosol chemical compounds sampled with a Micro-Orifice Uniform Deposit Impactor (MOUDI) over the East China Sea and the Sea of Japan during the ACE-Asia cam-paign. They found that the submicron mode was enriched by non-sea salt (nss)-SO2−4 ([OC]/[nss-SO2−4 ]≈0.2 at 0.18– 0.56 µm), whereas the supermicron mode was enriched by organic compounds ([OC]/[nss-SO2−4 ]≈1 at 1.8–5.6 µm). The median value of [OC]/[SO2−4 ] in the present study is 1.0, suggesting that PM2.5 chemical composition was affected
by super-micron particles by comparison with the ratio of Mochida et al. (2007).
The Dcrit for each SS was calculated using the chemical
composition of the sub-micron mode particle given in Table 2 in Mochida et al. (2007) assuming that OC was entirely com-posed of WIOC, because the fraction of WSOC was much smaller than that of WIOC (Fig. 8), and WSOC concentra-tion was not reported. The major difference of this calcu-lation is the higher sulfate fraction ([OC]/[nss-SO2−4 ]≈0.2). At SS=0.097%, the observed D50 was 136±17 nm, and the
calculated Dcritusing the data of Mochida et al. (2007) was
142 nm, as summarized in Fig. 11. In the case of other SSs, Dcritalso agrees with the average value of D50. This result
2 3 4 5 6 7 8 9 100 2 Dc ri t (n m ) 2 3 4 5 6 7 8 9 100 2 D50 (nm) SS = 0.58% SS = 0.097% SS = 0.97% SS = 0.27% Chemical composition from Mochida et al. (2007)
Fig. 11. Comparison of measured D50 and Dcritcalculated using
the chemical composition of Mochida et al. (2007). See the text for detailed explanation.
shows possible effects of the size-dependent chemical com-position on CCN activation.
The size dependence of aerosol chemical composition is clearer for the period of new particle formation. The D50
values of newly formed particles were very close to that of ammonium sulfate, indicating that particles were pre-dominantly composed of inorganic compounds at the time (Sect. 4.2.3.). In particular, newly formed particles grew larger than D50at SS=0.097% on 31 March (Fig. 4), and D50
values were nearly equal to the Dcritof ammonium sulfate on
that day (Fig. 9). However, the mass fraction of carbonaceous aerosols (WSOC+WIOC+EC) at PM2.5 was about 30% at
70 60 50 40 30 20 s u rf a c e t e n s io n ( m N /m ) 0.0001 0.001 0.01 0.1 C (mol/l) Jeju Cloud Po Valley fog
Fig. 12. Decrease of surface tension calculated using the parameters
for Jeju cloud water and Po Valley fog by McFiggans et al. (2006). The colored area in the figure corresponds to the values at the criti-cal SSs.
(Fig. 9). The decrease of D50associated with new/secondary
particle formation was also observed on 25 March. In this case, the mass fraction of water-insoluble compounds was also 30–40%, and this caused the overestimation of Dcrit.
These results suggest that the PM2.5mass concentration was
biased by large (>200-nm) particles, at least during these pe-riods.
5.3.2 Decrease of surface tension by organic compounds
As described above, the surface tension of water was as-sumed for the calculation in this study. Nevertheless, if the decrease in surface tension due to organic compounds was significant, it may affect the critical SS of the particles (Fac-chini et al. 1999). Surface tension lowering effects have been observed in various regions of the world such as Po Valley in Italy (Facchini et al. 1999), Mace Head in Ireland (Cavalli et al. 1999), and the Great Hungarian Plain (Kiss et al. 2005. In particular, Decesari et al. (2005) measured the surface ten-sion lowering effect of aerosol, cloud water, and wet deposi-tion samples at Jeju Island during the ACE-Asia campaign. They showed that the decrease of the surface tension due to aerosol was relatively small, whereas the surface tension de-crease of cloud water and wet-deposition samples was signif-icant. McFiggans et al. (2006) compared these results, and they showed that the magnitude of the effect for cloud water at Jeju Island was the most significant, and the effects for Po Valley and Mace Head samples were not as large as that of cloud water at Jeju (the red and blue lines in Fig. 12).
They summarized the fitted parameters of the Szyszkowski-Langmuir Eq. (3) obtained for these ob-servation results, σ = σ0−bT ln(1 + aC) (3) 1.5 1.0 0.5 D c ri t /D 5 0 1.0 0.8 0.6 0.4 0.2 0.0 SS (%) 72 m N/m Po Valley fog Jeju Cloud
Fig. 13. Comparison of Dcrit/D50calculated using several surface
tension parameters. The calculation was performed using the adipic acid approximation.
where σ0is the surface tension of pure water, C is the WSOC
concentration of the solution, and a and b are the empirical parameters obtained by fitting the observational results. In order to investigate the sensitivity of Dcritto surface tension,
we calculated Dcritat each SS using the parameters given by
McFiggans et al. (2006). In this calculation, the adipic acid assumption was used, and the values for Jeju cloud water and Po Valley fog were employed. Substituting σ in Eq. (1) by that expressed by Eq. (3), the Dcrit values were obtained by
numerical calculation. The results are summarized in Fig. 13. In the case of Jeju cloud water, the calculated diameters for all SSs are smaller than the observed D50 by 10–47%, and
the use of the equation for Po Valley decreased the differ-ences between Dcrit and D50 (7 to −13%). This indicates
that the decrease of surface tension can potentially explain the discrepancy. The surface tension at the critical SS was about 46–56 mN/m (Jeju cloud water) and 51–62 mN/m (Po Valley), respectively (Fig. 12).
The discussion in this section and Sect. 5.3.1 shows that the size- dependence of chemical composition and the de-crease in surface tension are the critical parameters in esti-mating Dcrit. For a more quantitative assessment of these
effects, we need simultaneous measurements of these param-eters and D50.
5.4 Impact of Dcriton CCN number concentration
The main purpose of the calculation of Dcrit is the precise
estimation of CCN number concentration from the particle size distribution. We estimated the difference in CCN num-ber concentration due to the difference in D50and calculated Dcrit. The following equation was used for the assessment of
the difference: 1NCCN NCCN = − log(Dcrit) R fN(log Dp)d log Dp log(D50) NCCN (4)
where NCCNis the number concentration of CCN measured
by the CCN counter, 1NCCN is the difference of the CCN
number concentration caused by the error in the estimation of Dcrit, and fN(log Dp) is the number size distribution
mea-sured by the SMPS. Therefore, 1NCCN/NCCN is the ratio
of the difference of the CCN number concentration due to the difference in Dcrit and the observed CCN number
con-centration. 1NCCN/NCCN depends on the number size
dis-tribution (fN(log Dp)) and the uncertainty of the chemical
composition (Dcrit–D50). For this calculation, the calculated Dcrit(adipic acid assumption, surface tension of water) was
used. In addition to the adipic acid assumption, we also cal-culated 1NCCN/NCCNusing the ammonium sulfate
assump-tion (Dcrit=Dcritof ammonium sulfate) because this
assump-tion has frequently been used in previous CCN studies (e.g. VanReken et al., 2003), including those for Gosan (Yum et al., 2007). The results are summarized in Fig. 14. In general, the adipic acid approximation underestimates the CCN num-ber concentration due to the overestimation of Dcrit, whereas
the ammonium sulfate approximation overestimates the CCN number concentration because of the underestimation of the Dcrit. At SS=0.097%, 1NCCN/NCCNwas −0.27±0.14 and
0.16±0.18 for the adipic acid and ammonium sulfate approx-imations, respectively. These values give a measure of the uncertainty associated with the CCN prediction based on the results of this study. The absolute value of 1NCCN/NCCN
increased with decreasing SS. During the observation pe-riod, the average values of B did not show a significant de-pendence on the value of SS as discussed in Sect. 4.2.2, and the magnitude of the error associated with the estimation of Dcritdid not depend on SS significantly. Thus, this trend was
not mainly due to the size dependence of the chemical com-position. Dcrit decreased with increasing SS. The particle
number concentration between D50and Dcritwas smaller at
higher SS in comparison with the CCN number concentra-tion because at higher SS a larger fracconcentra-tion of CCN is in the size range larger than D50, as can be seen from Fig. 6. These
results show that the effect of chemical composition on NCCN
was more important at lower SS, and the aerosol number size distribution was important at higher SS.
6 Summary
We measured the CCN number concentration (NCCN) and
the size-resolved CCN/CN ratios at SS=0.097, 0.27, 0.58, and 0.97% on Jeju Island, Korea, during 18 March–5 April 2005. The average CCN number concentrations for the whole observational period were as high as 1194±746 cm−3
-0.4 -0.2 0.0 0.2 0.4 Δ NC C N /N C C N 1.0 0.8 0.6 0.4 0.2 0.0 SS (%)
adipic acid assumption ammonium sulfate assumption
Fig. 14. Average values and standard deviations of 1NCCN/NCCN.
(SS=0.097%) and 3966±1686 cm−3 (SS=0.97%). The CCN/CN ratios monotonically increased with increasing par-ticle diameter, and the diameter at CCN/CN=0.5 was de-fined as D50. The average D50 values at SS=0.097% and
0.97 % were 136 nm and 31 nm, respectively. These values were slightly larger than those of ammonium sulfate parti-cles (125 and 27 nm at SS=0.097% and 0.97%, respectively). In particular, D50 diameters of newly formed particles and
those of ammonium sulfate particles were almost identical for SS=0.97, 0.58 and 0.27%, indicating that these particles were mainly composed of ammonium sulfate. The peak di-ameter of the CCN size distribution averaged for the whole observational period was about 150 nm at SS=0.097% and shifted to about 80 nm at SS=0.97%.
The temporal variation of D50 at SS=0.097% was
nega-tively correlated with the variation of the water-soluble frac-tion (inorganics + WSOC) of the aerosol components. For quantitative comparison, the threshold diameters for CCN activation (Dcrit) were calculated by K¨ohler theory
assum-ing the surface tension of water and PM2.5 aerosol
chemi-cal composition. The chemi-calculated Dcritvalues were correlated
with D50 at SS=0.097% (r2=0.48). However, Dcritwas
sys-tematically larger than D50 by about 16–29%. Sensitivity
studies have shown that this discrepancy can be explained by possible differences in aerosol chemical composition be-tween the sub-micron and super-micron size ranges. In addi-tion, a decrease of the surface tension due to the existence of WSOC can also significantly decrease Dcrit.
The particle number concentrations in the size range be-tween D50and Dcrit(1NCCN) were calculated using the
ob-served size distribution. The ratios of 1NCCN to NCCN
(1NCCN/NCCN) were estimated to be −0.27±0.14 and −0.10±0.13 at SS=0.097% and 0.97%, respectively, assum-ing that water-soluble organic compounds are represented by adipic acid. The 1NCCN/NCCNratio gives a measure of the
particle number size distributions and PM2.5chemical
com-positions in the East Asia region.
Acknowledgements. We acknowledge anonymous reviewers for
their useful comments. We also thank C. S. Hong and Y. J. Kim for their support of the observations. This work was supported by the Ministry of Education, Culture, Sports, Science, and Technology (MEXT), the Japanese Science and Technology Agency (JST), and the global environment research fund of the Japanese Ministry of the Environment. M. Kuwata thanks the Japan Society for the Promotion of Science (JSPS) for a JSPS Research Fellowship for Young Scientists. J. H. Kim and S. S. Yum were supported by the Korean Ministry of Environment under the “Eco-techonopia 21 project”.
Edited by: C. Chan
References
Akimoto, H.: Global air quality and pollution, Science, 302, 1716– 1719, 2003.
Arnold, F.: Atmospheric aerosol and cloud condensation nuclei for-mation: A possible influence of cosmic rays?, Space. Sci. Re-views, 125, 169–186, 2006.
Bae, M.-S., Schauer, J. J., DeMinter, J. T., Turner, J. R., Smith D., and Cary, R. A.: Validation of a semi-continuous instrument for elemental carbon and organic carbon using a thermal-optical method, Atmos. Environ., 38, 2885–2893, 2004.
Buzorius, G., McNaughton, C. S., Clarke, A. D., Covert, D. S., Blomquist, B., Nielsen, K., and Brechtel, F. J.: Secondary aerosol formation in continental outflow condi-tions during ACE-Asia, J. Geophys. Res., 109, D24203, doi:10.1029/2004JD004749, 2004.
Cantrell, W., Shaw, G., Cass, G. R., Chowdhury, Z., Hughes, L. S., Prather, K. A., Guazzotti, S. A., and Coffee, K. R.: Clo-sure between aerosol particles and cloud condensation nuclei at Kaashidhoo Climate Observatory, J. Geophys. Res., 106(D22), 28 711–28 718, 2001.
Carmichael, G. R., Hong, M., Ueda, H., Chen, L., Murano, K., Park, J. K., Lee, H., Kim, Y., Kang, C., and Shim, S.: Aerosol composition at Cheju Island, Korea, J. Geophys. Res., 102(D5), 6047–6062, 1997.
Cavalli, F., Facchini, M. C., Decesari, S., et al.: Advances
in characterization of size-resolved organic matter in marine aerosol over the North Atlantic, J. Geophys. Res., 109, D24215, doi:10.1029/2004JD005137, 2004.
Chameides, W. L., Luo, C., Saylor, R., Streets, D. G., Huang, Y., Bergin, M., and Giorgi, F.: Correlation between model-calculated anthropogenic aerosols and satellite-derived cloud op-tical depths: Indication of indirect effect?, J. Geophys. Res., 107(D10), 4085, doi:10.1029/2000JD000208, 2002.
Clegg, S. L., Rard, J. A., and Pitzer, K. S.: Thermodynamic prop-erties of 0-6 mol Kg-1 aqueous sulfuric acid from 273.15K to 328.15K, J. Chem. Soc. Faraday Trans., 90, 1875–1894, 1994. Clegg, S. L., Milioto S., and Palmer, D. A.: Osmotic and activity
coefficients of aqueous (NH4)2SO4as a function of temperature,
and (NH4)2SO4- H2SO4mixtures at 298.15 K and 323.15 K, J.
Chem. Eng. Data, 41, 455–467, 1996.
Corrigan, C. E. and Novakov, T.: Cloud condensation nucleus activ-ity of organic compounds: A laboratory study, Atmos. Environ., 33, 2661–2668, 1999.
Covert, D. S., Gras, J. L., Wiedensohler A., and Stratmann, F.: Comparison of directly measured CCN with CCN modeled from the number-size distribution in the marine boundary layer dur-ing ACE 1 at Cape Grim, Tasmania, J. Geophys. Res., 103(D13), 16 597–16 608, 1998.
Cruz, C. N. and Pandis, S. N.: Deliquescence and hygroscopic growth of mixed inorganic-organic atmospheric aerosol, Envi-ron. Sci. Technol., 34, 4313–4319, 2000.
Decesari, S., Facchini, M. C., Fuzzi, S., McFiggans, G. B., Coe, H., and Bower, K. N.: The water-soluble organic component of size-segregated aerosol, cloud water and wet depositions from Jeju Island during ACE-Asia, Atmos. Environ., 39, 211–222, 2005. Dinar, E., Taraniuk, I., Graber, E. R., Katsman, S., Moise, T.,
Anttila, T., Mentel, T. F., and Rudich, Y.: Cloud Condensa-tion Nuclei properties of model and atmospheric HULIS, Atmos. Chem. Phys., 6, 2465–2481, 2006a,
http://www.atmos-chem-phys.net/6/2465/2006/.
Dinar, E., Mentel, T. F., and Rudich, Y.: The density of humic acids and humic like substances (HULIS) from fresh and aged wood burning and pollution aerosol particles, Atmos. Chem. Phys., 6, 5213–5224, 2006b,
http://www.atmos-chem-phys.net/6/5213/2006/.
Dusek, U., Frank, G. P., Hildebrandt, L., Curtius, J., Schneider, J., Walter, S., Chand, D., Drewnick, F., Hings, S., Jung, D., Bor-rmann, S., and Andreae, M. O.: Size matters more than chem-istry for cloud-nucleating ability of aerosol particles, Science, 312, 1375–1378, 2006.
Facchini, M. C., Mircea, M., Fuzzi, S., and Charlson, R. J.: Cloud albedo enhancement by surface-active organic solutes in growing droplets, Nature, 401, 257–259, 1999.
Grabber, E. R. and Rudich Y: Atmospheric HULIS: How humic-like are they? A comprehensive and critical review, Atmos. Chem. Phys., 6, 729–753, 2006,
http://www.atmos-chem-phys.net/6/729/2006/.
Hoffer, A., Gelencs`er, A., Guyon, P., Kiss, G.., Schmid, O., Frank, G. P., Artaxo, P., and Andrea, M. O.: Optical properties of humic-like substances (HULIS) in biomass-burning aerosols, Atmos. Chem. Phys., 6, 3563–3570, 2006,
http://www.atmos-chem-phys.net/6/3563/2006/.
Hudson, J. G. and Yum, S. S.: Cloud condensation nuclei spectra and polluted and clean clouds over the Indian Ocean, J. Geophys. Res., 107(D19), 8022, doi:10.1029/2001JD000829, 2002. Huff Hartz, K. F., Tischuk, J. E., Chan, M. N., Chan, C. K.,
Don-ahue, N. M., and Pandis, S. N.: Cloud condensation nuclei acti-vation of limited solubility organic aerosol, Atmos. Environ., 40, 605–617, 2006.
Kawamoto, K., Hayasaka, T., Uno, I., and Ohara, T.: A
correlative study on the relationship between modeled an-thropogenic aerosol concentration and satellite-observed cloud properties over east Asia, J. Geophys. Res., 111, D19201, doi:10.1029/2005JD006919, 2006.
Kawamura, K., Umemoto, N., Mochida, M., Bertram, T., Howell, S., and Huebert, B. J.: Water-soluble dicarboxylic acids in the tropospheric aerosols collected over east Asia and western North Pacific by ACE-Asia C-130 aircraft, J. Geophys. Res., 108(D23), 8639, doi:10.1029/2002JD003256, 2003.
Kim, J., Yoon, S.-C., Jefferson, A., and Kim, S.-W.: Aerosol hy-groscopic properties during Asian dust pollution, and biomass burning episodes at Gosan, Korea in April 2001, Atmos. Envi-ron., 40, 1550–1560, 2006.
Kiss, G., Tomb`acz, E., and Hanson, H.-C.: Surface tension effects of Humic-like substances in the aqueous extract of tropospheric fine aerosol, J. Atmos. Chem., 50, 279–294, 2005.
Knutson, E. O. and Whitby, K. T.: Aerosol classification by electric mobility: Apparatus, theory, and applications, J. Aerosol. Sci., 6, 443–451, 1975.
Kondo, Y., Komazaki, Y., Miyazaki, Y., et al.: Temporal variations of elemental carbon in Tokyo, J. Geophys. Res., 111, D12205, doi:10.1029/2005JD006257, 2006.
Kondo, Y., Miyazaki, Y., Takegawa, N., Miyakawa, T., Weber, R. J., Jimenez, J. L., Zhang, Q., and Worsnop, D. R.: Oxygenated and water-soluble organic aerosols in Tokyo, J. Geophys. Res., 112, D01203, doi:10.1029/2006JD007056, 2007.
Kreidenweis, S. M., Koehler, K., DeMott, P. J., Prenni, A. J., Car-rico, C., and Ervens, B.: Water activity and activation diameters from hygroscopicity data – Part I: Theory and application to in-organic salts, Atmos. Chem. Phys., 5, 1357–1370, 2005 Kuwata, M., Kondo, Y., Mochida, M., Takegawa, N., and
Kawa-mura, K.: Dependence of CCN activity of less volatile particles on the amount of coating observed in Tokyo, J. Geophys. Res., 112, D11207, doi:10.1029/2006JD007758, 2007.
Laaksonen, A., Hamed, A., Joutsensaari, J., Hiltunen, L., Cavalli, F., Junkermann, W., Asmi, A., Fuzzi, S., and Facchini, M. C.: Cloud condensation nucleus production from nucleation events at a highly polluted region, Geophys. Res. Lett., 32, L06812, doi:10.1029/2004GL022092, 2005.
Lee, J. Y., Kim, Y. P., Kang, C.-H., Ghim, Y. S., and Kaneyasu,
N.: Temporal trend and long-range transport of particulate
polycyclic aromatic hydrocarbons at Gosan in northeast Asia between 2001 and 2004, J. Geophys. Res., 111, D11303, doi:10.1029/2005JD006537, 2006.
Lohmann, U. and Feichter, J.: Global indirect aerosol effects: A review, Atmos. Chem. Phys., 5, 715–737, 2005,
http://www.atmos-chem-phys.net/5/715/2005/.
Markowski, G. R.: Improving Twomey’s algorithm for inversion of aerosol measurement data, Aerosol. Sci. Technol., 7, 127–141, 1987.
McFiggans, G.,Artaxo, P., Baltensperger, U., et al.: The effect of physical and chemical aerosol properties on warm cloud droplet activation, Atmos. Chem. Phys., 6, 2593–2649, 2006,
http://www.atmos-chem-phys.net/6/2593/2006/.
Matsumoto, K., Tanaka, H., Nagao, I., and Ishizaka, Y.: Contribu-tion of particulate sulfate and organic carbon to cloud condensa-tion nuclei in the marine atmosphere, Geophys. Res. Lett., 24(6), 655–658, 1997.
Medina, J., Nenes, A., Sotiropoulou, R.-E. P., Cottrell, L. D., Ziemba, L. D., Beckman, P. J, and Griffin, R. J.: Cloud conden-sation nuclei closure during the International Consortium for At-mospheric Research on Transport and Transformation 2004 cam-paign: Effects of size-resolved composition, J. Geophys. Res., 112, D10S31, doi:10.1029/2006JD007588, 2007.
Miyazaki, Y., Kondo, Y., Takegawa, N., Komazaki, Y., Fukuda, M., Kawamura, K., Mochida, M., Okuzawa, K., and We-ber, R. J.: Time-resolved measurements of water-soluble or-ganic carbon in Tokyo, J. Geophys. Res., 111, D23206,
doi:10.1029/2006JD007125, 2006.
Miyazaki, Y., Kondo, Y., Kodama, D., Han, S., Koike, M., Ko-mazaki, Y., Tanimoto, H., and Matsueda, H.: Chemical charac-teristics of water-soluble organic carbon in the Asian outflow, J. Geophys. Res., 112, D22S30, doi:10.1029/2007JD009116,2007. Mochida, M., Kawamura, K., Umemoto, N., Kobayashi, M., Matsunaga, S., Lim, H., Turpin, B. J., Bates, T. S., and Si-moneit, B. R. T.: Spatial distributions of oxygenated organic compounds (dicarboxylic acids, fatty acids, and levoglucosan) in marine aerosols over the western Pacific and off the coast of East Asia: Continental outflow of organic aerosols during the ACE-Asia campaign, J. Geophys. Res., 108(D23), 8638, doi:10.1029/2002JD003249, 2003.
Mochida, M., Kuwata, M., Miyakawa, T., Takegawa, N.,
Kawamura, K., and Kondo, Y.: Relationship between
hy-groscopicity and cloud condensation nuclei activity for ur-ban aerosols in Tokyo, J. Geophys. Res., 111, D23204, doi:10.1029/2005JD006980, 2006.
Mochida, M., Umemoto, N., Kawamura, K., Lim, H.-J., and Turpin, B. J.: Bimodal size distributions of various organic acids and fatty acids in the marine atmosphere: Influence of anthropogenic aerosols, Asian dusts, and sea spray off the coast of East Asia, J. Geophys. Res., 112, D15209, doi:10.1029/2006JD007773, 2007. O’Dowd, C. D., Hmeri, K., Mkel, J. M., et al.: A dedicated study of New Particle Formation and Fate in the Coastal Environ-ment (PARFORCE): Overview of objectives and achieveEnviron-ments, J. Geophys. Res., 107(D19), 8108, doi:10.1029/2001JD000555, 2002.
Orsini, D. A., Ma, Y., Sullivan, A., Sierau, B., Baumann, K., and Weber, R. J.: Refinements to the particle–into-liquid sampler (PILS) for ground and airborne measurements of water soluble aerosol composition, Atmos. Environ., 37, 1243–1259, 2003. Pang Y., Turpin, B. J., and Gundel, L. A.: On the importance
of organic oxygen for understanding organic aerosol particles, Aerosol. Sci . Technol., 40, 128–133, 2006.
Raymond, T. M. and Pandis, S. N.: Cloud activation of
single-component organic aerosol particles, J. Geophys. Res., 107(D24), 4787, doi:10.1029/2002JD002159, 2002.
Reade, L., Jennings, S. G., and McSweeney, G.: Cloud condensa-tion nuclei measurements at Mace Head, Ireland, over the period 1994–2002, Atmos. Res., 82, 610–621, 2006.
Richter, A., Burrows, J. P., N¨ub, C. Grainer, and Niemeier, U: Increase in tropospheric nitrogen dioxide over China observed from space, Nature, 437, 129–132, 2005.
Roberts, G. C., Artaxo, P., Zhou, J., Swietlicki, E., and Andreae, M. O.: Sensitivity of CCN spectra on chemical and physical proper-ties of aerosol: A case study from the Amazon Basin, J. Geophys. Res., 107(D20), 8070, doi:10.1029/2001JD000583, 2002. Roberts, G. C. and Nenes, A.: A continuous-flow streamwise
thermal gradient CCN chamber for atmospheric measurements, Aerosol. Sci. Technol., 39, 206–221, 2005.
Sawa, Y., Tanimoto, H., Yonemura, S., Matsueda, H., Wada, A., Taguchi, S., Hayasaka, T., Tsuruta, H., Tohjima, Y.,
and Mukai, H.: Widespread pollution events of carbon
monoxide observed over the western North Pacific during the EAREX 2005 campaign, J. Geophys. Res., 112, D22S26, doi:10.1029/2006JD008055, 2007.
Seinfeld, J. H. and Pandis, S. N.: Atmospheric Chemistry and Physics, John Wiley and Sons, Inc., New York, 2006.