HAL Id: insu-00419696
https://hal-insu.archives-ouvertes.fr/insu-00419696
Submitted on 16 Jun 2010
HAL is a multi-disciplinary open access
archive for the deposit and dissemination of sci-entific research documents, whether they are pub-lished or not. The documents may come from teaching and research institutions in France or abroad, or from public or private research centers.
L’archive ouverte pluridisciplinaire HAL, est destinée au dépôt et à la diffusion de documents scientifiques de niveau recherche, publiés ou non, émanant des établissements d’enseignement et de recherche français ou étrangers, des laboratoires publics ou privés.
Invasion of a Sphagnum-peatland by Betula spp and
Molinia caerulea impacts organic matter biochemistry.
Implication for carbon and nutrient cycling.
Sébastien Gogo, Fatima Laggoun-Défarge, Frédéric Delarue, Nathalie Lottier
To cite this version:
Sébastien Gogo, Fatima Laggoun-Défarge, Frédéric Delarue, Nathalie Lottier. Invasion of a Sphagnum-peatland by Betula spp and Molinia caerulea impacts organic matter biochemistry. Implication for car-bon and nutrient cycling.. Biogeochemistry, Springer Verlag, 2011, 106 (1), pp.53-69. �10.1007/s10533-010-9433-6�. �insu-00419696�
1
Invasion of a Sphagnum-peatland by Betula spp and Molinia caerulea impacts on organic matter biochemistry. Implications for carbon and nutrient cycling.
Sébastien Gogo, Fatima Laggoun-Défarge, Frédéric Delarue, Nathalie Lottier Université d’Orléans, Université François Rabelais – Tours, CNRS/INSU. Institut des Sciences de la Terre d’Orléans
Université d’Orléans, Université François Rabelais – Tours, CNRS/INSU. Institut des Sciences de la Terre d’Orléans 1A rue de la Férollerie
45071 Orléans Cedex 2 France
Tel : 00 33 2 38 49 45 02 Fax : 00 33 2 38 63 64 88 sebastien.gogo@univ-orleans.fr
2 KEYWORDS
Carbon substrate injection, elemental analysis, Organic matter sources and decay, Pyrophosphate Index, Rock Eval pyrolysis, sugars
ABSTRACT
Peatlands act as a sink of carbon (C) through the accumulation of dead remains of plants. Under global changes triggered by human activities, it is not only the sink capacity of peatland that is in danger, but also the C already stored. Invasion of
Sphagnum peatlands, mainly by Molinia caerulea and Betula spp, is a growing
preoccupation. This study aims to assess the extent of the influence of this invasion on the biochemical characteristics of the peat. Elemental analysis, sugar and Rock Eval pyrolysis parameters were measured in 50 cm profiles collected in invaded and intact plots. The results show that oxygen index ratios (OICO2/OICO) can be used to detect new C substrate injection as invading plants
have a lower ratio than Sphagnum spp and Sphagnum peat. Total hemicellulosic sugar contents and OM degradation indices (R400, PPI) suggest that the invading plants promote a faster OM decomposition probably through a faster degradability and a relatively higher nutrient content of their litter. Differences in terms of nutrient status between areas of the peatland are suggested to be of great importance in determining the extent of OM transformation likely due to stoichiometric constraints.
3 INTRODUCTION
Plants considered as engineer species are able to create and sustain conditions that are suitable for their own growth and expansion by modulating the availability of resources to other species (Jones et al, 1994). Sphagnum species, by regulating the availability of Nitrogen (N), producing a recalcitrant litter and by creating conditions unfavorable to other organisms (decreasing pH and micronutrient availability) are one such engineer species (van Breemen, 1995). Under increased N deposition (Tomassen et al, 2003; Tomassen et al, 2004), Sphagnum may lose its engineering capabilities, making Sphagnum peatlands susceptible to invasion by vascular plants, mainly Molinia caerulea and Betula spp. Vascular plants act on the soil Organic Matter (OM) quantity and quality through their litter and their roots. For nutrients such as N and Phosphorus (P), litterfall is the dominant pathway to return to the soil (Schlesinger, 1997). Roots through the death of their tissues and their exudates are major contributors to C and nutrient cycling (Fontaine et al, 2007).
During the development of ecosystems, soil pH decreases and C content increases (Ford, 1990; Charman, 2002). Allogenic changes, such as soil exploitation for agriculture, leads to a decrease in soil C content (Schlesinger, 1997). Nowadays, human activities trigger vegetation changes in ecosystems. Knowing how such changes will affect the soil C quantity and quality is of uttermost importance in the context of climate change: depending on the direction of the C flux induced, the vegetation changes may increase or buffer greenhouse gas concentrations in the atmosphere (Cornelissen et al, 2007). Peatlands, which contain a third of the world soil C (Gorham, 1991), are among the ecosystems that undergo vegetation change because of human activity. N supply to peatlands has been demonstrated
4
to stimulate the growth of invading species such as Betula pubescens and Molinia
caerulea (Tomassen et al, 2004). It has also been shown that the presence of
Molinia caerulea decreases the growth of Sphagnum species (Hogg et al, 1995),
which are the main peat-forming species. Considering that Molinia caerulea is N limited and that N deposition is high in Europe, invading species may expand in peatlands at the expense of Sphagnum species, which would imply a decrease in the C sink capacity of such systems. In addition, the vascular plants, because of their higher nutrient content may produce a litter that decomposes more rapidly than that of Sphagnum species (Clymo and Hayward, 1982, Comont, 2006, Coulson and Butterfield, 1978), potentially leading to an increased rate of C and nutrient mineralization, which may sustain the development of the invading species. Furthermore, in the form of root exudates, vascular plants can inject labile C source in deep peat layers. In peatlands, the lack of labile C source is a factor limiting microbial activity (Bergman et al, 1998).
The aim of this study is to assess how the recent invasion of a Sphagnum peatland by Betula spp. and Molinia caerulea affects the soil OM dynamics. Rather than the separate effects of the different colonizing species, it is the global effect of vascular plant colonisation of the peatland that is tested here. Bulk organic geochemical analyses (elemental and carbohydrate composition, Rock-Eval pyrolysis) were used to compare peat from intact and colonised plots. As nutrient availability may be an important factor controlling soil processes, analyses of surface peat water and of an incoming drain were performed. Bulk organic geochemical analyses have proved to be efficient in revealing both the botanical origin of the OM and the degradation processes that these precursors undergo in lake sediments (Jacob et al, 2004), marine sediments (Knies, 2005), mineral soils
5
(Disnar et al, 2003) and peat profiles (Bourdon et al, 2000; Comont et al, 2006; Laggoun-Défarge et al, 2008). Thus, in the present report, some of these techniques were used to compare the biochemical composition of OM from areas colonised by the invading vascular plants versus intact areas of a peatland.
MATERIAL, SAMPLING AND METHODS
Study site
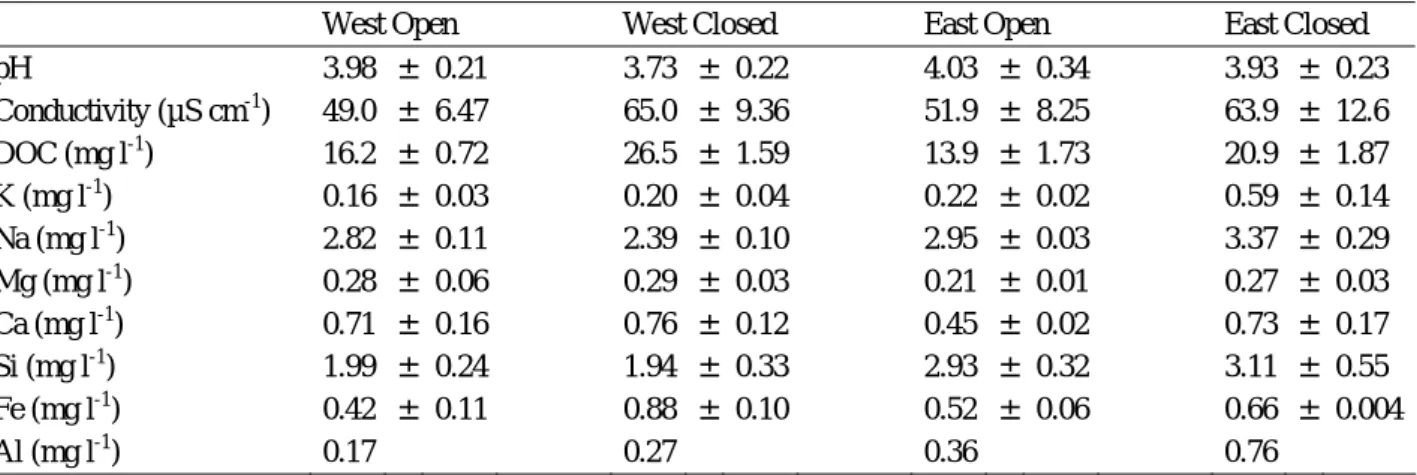
The site studied is La Guette peatland (154m, 47°19’ North and 2°14’ East) located in the south-eastern part of the French Centre Region (Neuvy-sur-Barangeon, Cher). The mean annual precipitation and temperature is 883 mm and 11°C respectively (for the period 1989-2001). It is a transitional fen (pH about 4, [Ca] > [Mg], Table 1) that has been invaded by Molina caerulea and Betula spp (Betula verrucosa and Betula pubescens) for 30 years with an acceleration of the invasion in the last decade. The dominant moss species are Sphagnum cuspidatum and Sphagnum rubellum. A drain connected to the eastern part of the peatland intermittently discharges water directly into the peatland (Figure 1). The chemical composition of water collected on May 2008 from this drain is given in Table 2. Surface water from the studied plots (see below) was collected seasonally (May 2008, September 2008, December 2008 and March 2009). Their characteristics are presented in Table 1.
Table 1. Figure 1. Table 2.
6 Experimental design and core sampling
The peatland was divided into two areas. It can be assumed that the two sub-areas of the peatland (West area and East area) were colonised relatively independently. The East area differs from the West area by a lower water table. The water table varied between -5.5 cm and -26 cm below the vegetation in the West area, and between -5.5 cm and -40 cm in the East area (period from September 2008 to December 2009). Differences in the water table occurred mainly during the summer. These differences may be caused by higher altitude and/or water works near the peatland, and by a periodic supply of water rich in nutrients such as K from the drain (unpublished data). To distinguish the two areas in relation to their hydrology, the West area is referred to as Wet and the East area as Dry.
To test differences 1) between plots with different vegetation, 2) between areas from different hydrological areas, and 3) in vegetation-area interaction, two areas were considered: the Wet area (named W) and the Dry area (named D), and within each area, an intact plot (named O for open vegetation) and a colonised plot (with both Betula spp and Molinia caerulea, named C for closed vegetation) were chosen. The location of each sampling plot, WO, WC, DO and DC, the characteristics of their surface water and their vegetation are reported in Figure 1 and Tables 1 and 3, respectively.
On June 2008, four cores (50 cm long) were collected with a Russian corer in each vegetation situation (open and closed), in each area of the peatland (Wet and Dry), within plots of a 4m2 surface area (total of 16 cores). This surface was chosen to limit spatial heterogeneity and because totally intact areas were small. Most cores were collected in Sphagnum habitats in both open and closed vegetation. The litter of vascular plants was not included in the cores. Sphagnum
7
species have no litter in the sense used for vascular plants. As assumed by most litter bag studies, the litter compartment of Sphagnum refers to the segment below the photosynthetic part and above the dark brown part (Bragazza, 2008). The top of the cores corresponded to the level where Sphagnum litter becomes brown (Figure 2). The trees (Betula spp) in the wet area were cut down by the manager in 2002, but they remained alive and tillers are now growing up to 3m. In the dry area, intact tall stands (15m) of Betula spp are present. In the laboratory, the cores were frozen until processing. After defreezing, they were cut into 10 sections each 5 cm long (Figure 2). Roots which were present at all depths of the cores were removed. The samples were dried at 50°C and crushed with an annular grinder. Dry weight was measured after drying to assess the bulk density. The different analyses were then conducted.
Figure 2. Table 3.
Organic Matter (OM) content
The crushed peat (100 mg) was weighed in a crucible, placed in an oven and burnt at 550°C during 4 hours. As peat contains mostly OM and as la Guette peatland is acidic (no carbonates present), the mass loss on ignition was considered to be only OM (expressed in % of dry weight).
Carbon (C), Nitrogen (N) and Sulfur (S) content analysis
C, N and S analysis was determined by combustion of dried and crushed samples at 1100°C, using a CNS-2000 LECO apparatus.
8 Rock-Eval pyrolysis
The Rock-Eval technique was primarily developed to diagnose oil-producing hydrocarbon (HC) source rocks by measuring the ratio of the amount of Hydrogen and Oxygen cracked during the pyrolysis cycle to the Total Organic Carbon (Hydrogen Index = HI, and Oxygen Index = OI respectively) and by determining the temperature of maximum hydrocarbon cracking (Espitalié et al., 1985; Lafargue et al., 1998). The technique was further adapted to assess the biochemical quality of soil OM. Disnar et al (2003) showed that Rock-Eval parameters can reveal the chemical evolution of the OM during the process of humification. Rock-Eval parameters were used here to assess OM quality between plots with different vegetation and from the two hydrological areas.
The analyses were carried out on 30 mg of powdered dry peat with a ‘‘Turbo’’ Rock-Eval 6® pyrolyser manufactured by Vinci® Technologies (Espitalié et al., 1985; Lafargue et al., 1998). Briefly, the samples were first pyrolysed under inert atmosphere (N2), and the residual C was subsequently burnt in an oxidation oven.
The amount of HC released during pyrolysis was detected by a flame ionisation detector, while online infrared detectors continuously measured the released CO and CO2. The standard pyrolysis program started with an isothermal stage of 2
min at 200°C. The pyrolysis oven temperature was then raised to 650°C at 30°C min-1, and held for 3 min at this temperature. The oxidation phase started at an isothermal stage at 400°C, followed by an increase to 850°C at 30°C min-1 and held at this final temperature for 5 min. Rock-Eval parameters were calculated by integration of the amounts of HC, CO and CO2 produced during the thermal
9
on the following parameters derived from signals recorded during the pyrolysis and oxidation phases:
- HI = Hydrogen Index (mg HC g-1 TOC) corresponds to the quantity of HC released during pyrolysis relative to TOC, namely S2/TOC.
- OICO2 =CO2 Oxygen Index = (mg CO2 g-1 TOC) corresponds to the quantity of
CO2 released during pyrolysis, relative to TOC.
- OICO = CO Oxygen index (mg CO g-1 TOC) corresponds to the quantity of CO released during pyrolysis, relative to TOC.
- OIRe6 = Rock-Eval 6 Oxygen Index (mg O2 g-1 TOC) corresponds to the
quantity of oxygen released as CO and CO2 during pyrolysis, relative to TOC.
- OICO2/OICO parameter is the ratio of the amount of pyrolysed CO2 to the
amount of pyrolysed CO.
- R400 parameter is the ratio of the part of the S2 signal produced below 400°C to the total S2 signal. It corresponds to an index of OM transformation as it results from the thermal decomposition of biological compounds such as cellulose and lignin before 400° C, and humic substances after 400° C (Disnar et al., 2003; Sebag et al., 2006; Disnar et al., 2008).
Pyrophosphate index (PPI)
The pyrophosphate index (Kaila, 1956) was calculated following Gobat et al (1986). The humic compounds of peat (0.5g) were extracted with a sodium pyrophosphate at 0.025 M overnight. The mixtures were filtered (Whatman 2V) and the filtrates were completed with deionised water to 250 ml. The optical density of the solution was measured at 550 nm with a spectrophotometer
10
(Shimadzu). The pyrophosphate index was obtained by multiplying the optical density measured by 100.
Neutral monosaccharide analyses
Hemicellulosic content measurement has been described elsewhere (Comont et al, 2006; Disnar et al, 2008). Briefly, a dry peat sample was hydrolysed with diluted H2SO4 at 100°C overnight. The extract was neutralized, centrifuged and
evaporated. Monosaccharides were 1) extracted with methanol, which was then evaporated, 2) diluted in pyridine, 3) derivated with N,O-bis-(trimethylsilyl)trifluoroacetamide (BFTSA) before the injection into a GC (Perkin-Elmer, FID). Deoxyglucose was used as an internal standard.
Statistical analyses
Two-way factorial ANOVAs were conducted for each variable at each depth to test for differences between plots with different vegetation, areas with different hydrology and for interaction between vegetation and hydrology. Normality of residues and variances homogeneity were tested (Kolmogorov and Smirnov test and Levene test, respectively). Data were transformed to improve the ANOVA assumptions fulfillment (log, square root or inverse). The Pearson product moment correlation was used to test for correlation. The level of significance of all tests was set to P<0.05. Statistica (Statsoft 2008) was used to conduct the tests.
11
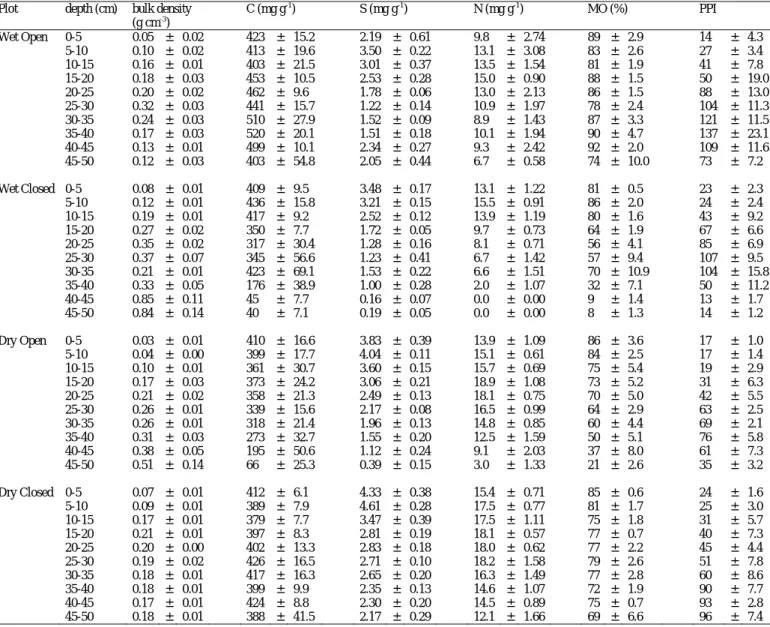
Results of whole cores showed that the depth of peat differed between the sampling plots (Table 4). In the lower part of the cores (35-50 cm), the degree of humification (PPI) varied within a given area, whereas in the middle part (15-35 cm) the differences between areas were more marked (Table 4A). This shows that peat from the lower and the middle part of the cores had different ages and experienced dramatic differences in terms of source materials (depending on the stage of development, a peatland exhibits different types of vegetation) and degradation conditions. However, PPI, C, N and S peat contents tended to converge toward the top of the core (Table 4A), suggesting that source materials and degradation conditions in all plots became more similar. Analyses and discussion were carried out only on peat from the first three depths so as to compare peat with ages that were as similar as possible.
Statistical analyses on the first three depths showed that there was only one significant vegetation and area interaction, on the bulk density (Table 5). This interaction was much less significant than the two main effects (at least one order of magnitude, Table 5). Thus, for bulk density as well as for all the other factors, only the main effects were considered.
From the statistical results (Table 5), the response variables could be separated into four groups. The first group was composed of variables exhibiting differences between plots with different vegetation and from different areas of the peatland, at the same depth or at different depths: bulk density, PPI, HI, total hemicellulose (Table 5, Figure 3). The second group showed differences only between plots with different vegetation: OIRe6 and OICO2/OICO (Table 5, Figure 4). The third
group showed differences between peatland areas: R400, C/S ratio (Table 5, Figure 5) and S content (Table 5). The fourth group was composed of variables
12
showing no or insignificant differences: C/N ratio, OM content, C and N content (Table 5).
Table 4 Table 5
Variables affected by the vegetation and the areas of the peatland
At all depths, the colonizing vegetation significantly increased the peat bulk density compared to the intact vegetation (Figure 3a, b, c). Also, other than at the surface, the peat was denser in the Wet area than in the Dry area.
At the surface, the peat was more decomposed (higher PPI) in closed vegetation plots than in open ones and no differences were observed between hydrological areas (Figure 3d). However, at the depth of 10-15 cm, the opposite was observed: the peat was more decomposed in the Wet area than in the Dry area and no differences were revealed with vegetation (Figure 3f). In between (5-10 cm), the peat showed the same degree of decomposition in all plots (Figure 3e).
At all depths, total hemicellulose was measured in significantly higher concentrations in the Dry area than in the Wet area (Figure 3g, h, i). Peat hemicellulosic content was higher in the open vegetation plots only at the surface (Figure 3g).
Figure 3
13
At all depths, both OIRe6 and OICO2/OICO ratios were higher in the plots with
open vegetation than in those with closed vegetation (Figure 4). OIRe6 tended to decrease with depth in both plots, whereas OICO2/OICO remained constant
(Figure 4).
Figure 4
Variables affected by the hydrology of the peatland
The R400 (Figure 5a, b, c) and the S content were lower in the Wet area of the peatland than in the Dry area. The differences in S contents explain the differences observed in the C/S ratio (Figure 5d, e, f) as the C content showed no significant differences (Table 5).
Figure 5
Variables showing no significant differences
Other than the C/N ratio at 10-15 cm, C/N ratio, C, N and OM contents did not differ between plots (Table 5). OM contents at depths 5-10 cm and 10-15 cm were highly similar between plots with different vegetation (both P>0.88), but at the surface, the level of significance decreased by an order of magnitude (P=0.08), without being significant at the level set previously.
Rock-Eval indices: R400 and OICO2/OICO
Rock Eval indices are more widely used for oil-producing rocks and petroleum reservoir studies. However, these indices, especially R400, have also proved to be
14
valuable in characterizing a wide range of soils and in studying processes such as humification (Disnar et al, 2003). Hemicellulose is a part of fresh unmodified OM. Our results on peat from 0 to 15 cm depth show that the R400 index was positively correlated with the amount of hemicellulose (R = 0.76, P < 0.001, n = 48, Figure 6).
Figure 6
In order to highlight the influence of botanical sources on the resulting peat biochemistry, litter from the dominant precursors of the undisturbed peatland (Sphagnum cuspidatum and Sphagnum rubellum) and those from the two dominant species invading the peatland (Molinia caerulea and Betula verrucosa) were analysed (Table 6). By comparing the precursors’ biochemical characteristics to the peat composition, markers of sources were expected to be found. All oxygen indices (OI) measured by Rock Eval pyrolysis varied greatly between plants (Table 6). Figure 7 shows that OICO did not discriminate the different source materials. In contrast, OICO2 was a good parameter to separate
Sphagnum spp. and vascular plant litters. However, the roots of Betula verrucosa
and Molinia caerulea presented OICO2 values closer to that of Sphagnum spp.
than their aboveground counterparts. The OICO2/OICO ratio was found to
discriminate vascular plants (litter and roots) well from Sphagnum species (Table 6). Above- and belowground parts of vascular plants exhibited similar ratios (between 1 and 2), lower than the Sphagnum ratio (above 3).
15
Figure 7.
DISCUSSION
Relevance of indices from Rock-Eval pyrolysis in assessing peat biochemistry
R400
Hydrocarbons from living vegetation and litter, mainly composed of lignocellulosic compounds, are cracked early during the temperature rise of the Rock Eval pyrolysis cycle (mostly before 400°C). In contrast, transformed OM such as humic substances resulting from the biological and chemical degradation of fresh litter is cracked later (mostly after 400°C). Thus, the R400 index reflects the relative abundance of fresh unmodified OM (Disnar et al, 2003) and can be considered as an indicator of OM transformation. While R400 has been used successfully to reveal humification processes in forest soils (Disnar et al, 2003), this has not so far been undertaken with peat soils. In the process of OM degradation, fresh organic compounds such as hemicellulose are decomposed and transformed by the soil biota. This results in a loss in the polysaccharide content of peat, which would be revealed by a decrease in R400. In our case, this was confirmed by the significant positive correlation between R400 and the peat hemicellulose content (Figure 6). This result suggests that the R400 index could be used in peat material in the same way as it has been used in mineral soil.
OICO2/OICO
In the case of this study, the OICO2/OICO ratio was found to be the most
16
belowground vascular plant material. Jacob (2003) suggested that in lacustrine sediments a high OICO2/OICO ratio may reflect input of well preserved initially
oxygen-rich material. Such conditions were fulfilled in the present study. First,
Sphagnum mosses were richer in oxygen than vascular plant organs (see values of
oxygen indices in Table 6). Second, Sphagnum mosses create conditions favorable for the preservation of OM through the combined action of their soluble and bound polysaccharides (sphagnan) that bind nutrients and release H+ (Clymo, 1967, Painter, 1991) and their polyphenolic networks and lipid coating that protect cell walls (van Breemen, 1995). These conditions of high oxygen content and good preservation conditions were suitable for using the OICO2/OICO ratio
as a possible index of source materials.
Impact of vascular plant invasion on OM biochemical quality
Injection of labile OM in the peat profile
The OICO2/OICO ratio of Sphagnum litters was similar to those found in the
surface peat of Open plots (~3.4), probably reflecting the deposition and preservation of Sphagnum litter. However, the ratios of surface peat from Closed plots were intermediate between those of vascular plants and Sphagnum species. As roots were removed from peat samples these results suggest that root materials (dead roots and root exudates) contributed to the formation of the peat in Closed plots. Thus, differences in OICO2/OICO ratios may reflect the injection of labile
OM into peat. Molinia caerulea produces a very extensive root system that can reach 80 cm in depth (Taylor et al, 2001). This injection of fresh OM not only occurred at the surface but may also occur in deeper layers of the peat profile as suggested by differences observed between open and closed vegetation plots in
17
both dry and wet areas of the peatland (Table 4). Fontaine et al (2007) showed that in mineral soils this injection of root materials can lead to an increase in the mineralization of deep recalcitrant C through a priming effect. They pointed out that such an effect may not occur in wetlands as anaerobic conditions may overrule it. These authors, however, did not take into account the fact that water level fluctuates and peat as deep as 15 cm can be temporarily exposed to aerobic conditions. Furthermore, in cases of vascular plant invasion, oxygen can be directed to deep layers at the root-soil interface (Conrad, 1996). None of the parameters measured in this study can assess for the occurrence of a priming effect, but the results obtained encourage further studies in this direction.
New litterfall quality and OM decomposition
Surface peat from Closed plots (wet and dry pooled together) contained less hemicellulosic sugars than Open plots (wet and Dry pooled together) (Figure 3g), reflecting higher OM degradation (Comont et al, 2006). Deeper in the profile, such differences between plots with different vegetation were not observed (Figure 3h, i). Moreover, PPI showed that the surface peat from the Closed plots was more decomposed than the peat from the Open plots, irrespective of the hydrological status of the peatland. The increased decomposition in closed vegetation plots was supported by water analyses (Table 1). Dissolved organic carbon (DOC) concentration and conductivity were higher in closed than in open vegetation. These results suggest that the vascular plant invasion of the Sphagnum peatland increased OM decomposition. Furthermore, compared to Sphagnum species, Molinia caerulea and Betula spp have higher litter decomposability
18
(Chamie and Richardson, 1978; Bartsch and Moore, 1985; Berendse, 1998). This would explain the results obtained.
Increased OM decomposition in closed plots as suggested would result in a decrease of OM content, but the results showed that there were no significant differences between plots at the level of significance set (P < 0.05). However, there was a trend of lower OM content in peat from closed plots toward the surface (P < 0.1), which supports higher decomposition in closed plots than in open plots.
Bulk density showed almost significant differences in all cases (Figures 3a, b, c), suggesting that this variable integrates the physico-chemical effect of both vascular plants and hydrologic differences between areas. The bulk density was significantly higher in the closed plots than in the open ones. Minkkinen and Laine (1998a) showed in pine mires that drainage first increases the peat bulk density, then increases OM decomposition, and finally, the pressure of the growing trees further compacts the peat. Thus, the high bulk density in La Guette closed plots could be attributed to the development of the root system of trees. Simultaneously, despite a lower water table in the Dry area than in the Wet area, the peat from 5 to 10 cm deep was denser in the Wet area than in the Dry area. Thus the drainage effect may not be sufficient to impact peat physico-chemistry in the way suggested by Minkkinen and Laine (1998a).
Increased OM decomposition can also produce denser peat, without necessarily decreasing the C content (Minkkinen and Laine, 1998b). The hemicellulosic sugar content and R400 results actually suggest a higher OM degradation in the wet area of the peatland. Moreover, no significant differences in C content were observed
19
between plots. It is thus argued that the difference in terms of OM degradation between wet and dry areas would lead to denser peat in the wet area.
Impact of the incoming drain on OM decomposition
The differences in peat hemicellulosic sugar contents and R400 index between peatland areas (higher in the Dry area) suggest that OM was better preserved in the dry area. As the water table was lower in the latter area, resulting in longer aerobic periods that would promote OM decomposition, these results are puzzling. A possible explanation may come from the fact that this area of the peatland intermittently receives nutrients from a drain flowing directly into the peatland at this location (Figure 1, Table 2), which is not the case throughout the peatland. Soluble elements such as K and S had concentrations in surface water that decreased with distance from the drain (Figure 8). This could not be demonstrated with N as concentrations were below the detection limits in the samples measured. It was shown that the water within the peatland actually flows from the east to the west (Binet et al, personal communication). The dry area was thus richer in soluble nutrients than the wet area and this could be the result of nutrient inputs from the drain.
Figure 8.
Depending on the availability in mineral nutrients in the media, the microbial biomass may balance demand for mineral nutrients with consumption of supplementary C that would result in C overflow due to stoichiometric constraints (Manzoni and Porporato, 2009). From an experiment of wheat decomposition
20
under nutrient-limiting conditions (in this case, N), Hadas et al (1998) hypothesized that the C that could not be mineralized to CO2 because of the lack
of nutrients would flow into a “polysaccharide-like” pool. In the same way, in the wet area, which was poorer in mineral nutrients, such a process could occur, with polysaccharide consumption. The incomplete degradation of such material would result in the excretion of a transformed OM. In the dry area, where mineral nutrients were found in higher concentrations, less C would need to be incorporated and less hemicellulose would flow into the “polysaccharide-like” pool, resulting in a better preservation of OM in this dry area than in wet nutrient-poor plots. The negative correlations between C/S ratio in free water and the surface peat hemicellulose content (Figure 9a) and R400 (Figure 9b) support this hypothesis: for an equivalent amount of soluble C, more hemicellulose was degraded and more transformed OM was produced as the availability of S (less S for the same amount of C) decreased (Figure 9).
Figure 9.
In the wet area, where soluble S may be limiting, the microbial community may have found in the solid OM, i.e. peat, the amount of S required for its growth and thus rejected the excess C (C overflow) in the form of transformed OM. Manzoni and Porporato (2009) and Hadas (1998) based their argument of C overflow on models developed for mineral soils. From the results presented in Figure 9, although obtained with only 4 points, the hypothesis of C overflow under nutrient limiting conditions deserves to be tested on peat soils and La Guette peatland offers a good case of study.
21 CONCLUSION
Rock Eval analysis on peat samples from La Guette peatland showed that R400 and the OICO2/OICO ratios were valuable indices to assess OM degradation and
to discriminate litters of Sphagnum species from those of vascular plants, respectively. These indices were used to highlight differences between areas with different water levels and vegetation types in the peatland. The OICO2/OICO
profiles showed that invading species through their roots may inject labile OM into deep peat. The R400, coupled to hemicellulosic sugar analyses, showed that OM was more decomposed in plots invaded by vascular plants. These results suggest that invasion of a peatland by vascular plants such as Betula spp and
Molinia caerulea affected both surface and deep peat processes.
This study also highlights the important impact of the incoming drain on soil processes. It is suspected that the drain may have enriched the dry area of the peatland in nutrients that modified decomposition conditions in this area compared to the wet one. The microbial community in the dry nutrient-rich area may not have needed to decompose peat to cover its nutrient requirements. In contrast, in the wet nutrient poor area, microbes may have needed to consume more C substrates with the production of a polysaccharide-like pool, i.e. more transformed OM.
All these conclusions obtained with bulk peat analyses could be supported by 1) applying molecular analyses (i.e. lipids) to better discriminate the source materials, 2) surveying the site in the long term, with the present study as the “time zero”, to monitor indices of vascular plant colonization.
22
Finally, these results highlight issues that need to be addressed to fully assess the impact of Sphagnum peatland invasion by vascular plants: 1) test for the priming effect induced by labile C injection in deep peat, 2) test the C overflow hypothesis in nutrient-limiting conditions.
ACKNOWLEDGEMENTS
This paper is a contribution to the research conducted at the OSUC (Observatoire des Sciences de l’Univers en région Centre). Financial support was provided by a Conseil General du Loiret grant to S. Gogo. The authors gratefully acknowledge M. Hatton, R. Boscardin and E. Rivoire for analytical assistance and J.R. Disnar and C. Défarge for advice regarding Rock Eval pyrolysis and spectrophometer analyses. The authors are also grateful to the reviewers for their constructive comments and helpful suggestions on an earlier version of the manuscript.
REFERENCES
Bartsch I, Moore TR (1985) A preliminary investigation of primary production and decomposition in four peatlands near Schefferville, Québec. Can J Botany 63:1241–1248
Berendse F (1998) Effects of dominant plant species on soils during succession in nutrient-poor ecosystems. Biogeochemistry 42:73–88
23
Bergman I, Svensson BH, Nilsson M (1998) Regulation of methane production in a Swedish mire by pH, temperature and substrate. Soil Biol and Biochem 31:1867–1877
Bourdon S, Laggoun-Défarge F, Maman O et al (2000) Organic matter sources and early diagenetic degradation in a tropical peaty marsh (Tritrivakely, Madagascar). Implications for environmental reconstruction during the Sub-Atlantic. Org Geochem 31:421–38
Bragazza L, Siffi C, Iacumin P et al (2007) Mass loss and nutrient release during litter decay in peatland: The role of microbial adaptability to litter chemistry. Soil Biol and Biochem 39:257-267
van Breemen N (1995) How Sphagnum bogs down other plants. Trends Ecol and Evol 10:270–275
Chamie JPM, Richardson CJ (1978) Decomposition in Northern wetlands. In: Good RE, Whigham DF, Simpson RL (eds) Freshwater wetlands: ecological processes and management potential,. Academic Press, New York
Charman D (2002) Peatlands and Environmental Change. John Wiley & Sons Ltd, New York
24
Clymo RS (1967) Control of cation concentrations, and in particular of pH, in
Sphagnum dominated communities. In: Golterman HL, Clymo RS (eds) Chemical
Environment in Aquatic Habitat. North Holland, Amsterdam
Clymo RS, Hayward PM (1982) The ecology of Sphagnum. In: Smith AJE (ed) Bryophyte Ecology. Chapman and Hall, New York
Comont L (2006) Etude des processus de stockage de la matière organique et de régénération des tourbières dégradées après exploitation : sites du Russey (Jura français), de la chaux d’Abel (Jura suisse) et de baupte (Cotentin, France). Dissertation, Université d’Orléans.
Comont L, Laggoun-Défarge F, Disnar J-R (2006) Evolution of organic matter indicators in response to major environmental changes: the case of a formerly cut-over peatbog (Le Russey, Jura Mountains, France). Org Geochem 37:1736–1751
Conrad R (1996) Soil microorganisms as controllers of atmospheric trace gases (H2, CO, CH4, OCS, N2O and NO). Microbiol Rev 60:609-640
Cornelissen JHC, van Bodegom PM, Aerts R et al (2007) Global negative vegetation feedback to climate warming responses of leaf litter decomposition rate in cold biomes. Ecol Lett 10: 619-627
Coulson JC, Butterfield J (1978) An investigation of the biotic factors determining the rates of plant decomposition on blanket bog. J Ecol 66: 631-650
25
Disnar J-R, Guillet B, Keravis D et al (2003) Soil organic matter (SOM) characterization by Rock-Eval pyrolysis: scope and limitations. Org Geochem 34:327–343
Disnar J-R, Jacob J, Morched-Issa M et al (2008) Assessment of peat quality by molecular and bulk geochemical analysis : Application to the Holocene record of the Chautagne marsh (Haute Savoir, France). Chem Geol 254:101–112
Dorrepal E, Cornelissen JH, Aerts R (2007) Changing leaf litter feedbacks on plant production across contrasting sub-artic peatland species and growth forms. Oecologia 151:251–261
Espitalié J, Deroo G, Marquis F (1985) La pyrolyse Rock Eval et ses applications. Rev I Fr du Pétrol 40:563–579, 40:755–784, 41:73–89
Fontaine S, Barot S, Barré P (2007) Stability of carbon in deep soil layers controlled by fresh carbon supply. Nature 450:277–280
Ford MSJ (1990) A 10 000-Yr history of acidification of natural ecosystem acidification. Ecol Monogr 67:100-107
Gobat J-M, Grosvernier P, Matthey Y (1986) Les tourbières du Jura suisse. Milieux naturels, modifications humaines, caractères des tourbes, potentiel de régénération. Actes de la Société Jurassienne d'Emulation :213-315
26
Gorham E (1991) Northern peatlands: role in the carbon cycle and probable responses to climate warming. Ecol Appl 1:182–195
Hadas A, Parkin TB, Stahl PD (1998) Reduced CO2 release from decomposing
wheat straw under N-limiting conditions: simulation of carbon turnover. Eur J Soil Sci 49:487–494
Hogg P, Squires P, Fitter AH (1995) Acidification, nitrogen deposition and rapid vegetational change in a small valley mire in Yorkshire. Biol conserv 71:143–153
Jacob J (2003) Enregistrement des variations paléoenvironmentales depuis 20000 and dans le Nord Est du Brésil (Lac Caço) par les triterpènes et autres marqueurs organique. Dissertation, Université d’Orléans.
Jacob J, Disnar J-R, Boussafir M et al (2004) Major environmental changes recorded by lacustrine sedimentaryorganic matter since the last glacial maximum near the equator (Lagao do Caço, NE Brazil). Palaeogeog Palaeoclim Palaeoecol 205:183–197
Jones CG, Lawton JH, Schachak M (1994) Organisms as ecosystem engineers. Oikos 69:373–386
Kaila A (1956) Determination of the degree of humification of peat samples. J Agr Sci Finland 28:18–35
27
Knies J (2005) Climate-induced changes in sedimentary regimes for organic matter supply on the continental shelf off northern Norway. Geochim Cosmochim Ac 69:4631–4647
Lafargue E, Marquis F, Pillot D (1998) Rock-Eval 6 applications in hydrocarbon exploration, production and soil contamination studies. Rev I Fr Pétrol 53:421– 437
Laggoun-Défarge F, Mitchell E, Gilbert D et al (2008) Cut-over peatland regeneration assessment using organic matter and microbial indicators (bacteria and testate amoebae). JAppl Ecol 45:716–727
Manzoni A, Porporato A (2009) Soil carbon and nitrogen mineralization: Theory and models across scales. Soil Biol Biochem 41:1355-1379
Minkkinen K, Laine J (1998a) Effect of forest drainage on the peat bulk density of pine mires in Finland. Can J Forest Res 28:178–186
Minkkinen K, Laine J (1998b) Long-term effect of forest drainage on the peat carbon stores of pine mires in Finland. Can J of Forest Res 28:1267–1275
Painter TJ (1991) Lindow man, Tollund man and other peat-bog bodies: the preservative and antimicrobial action of sphagnan, a reactive glycuronoglycan with tanning and sequestering properties. Carbohyd Polym 15: 123-142
28
Schlesinger WH (1997) Biogeochemistry: an analysis of global change. Academic Press, San Diego
Sebag D, Disnar J-R, Guillet B et al (2006) Monitoring organic matter dynamics in soil profiles by ‘Rock-Eval pyrolysis’: bulk characterization and quantification of degradation. Eur J Soil Sci 57:344–355
Statsoft Inc (2008) STATISTICA for Windows Version 8.0. Tulsa Oklahoma, Statsoft, Inc.
Taylor K, Rowland AP, Jones HE (2001) Molinia caerulea (L.) Moench. J Ecol 86:126–144
Tomassen HBM, Smolders AJP, Lamers LPM et al (2003) Stimulated growth of
Betula pubescens and Molinia caerulea on ombrotrophic bogs: role of high level
of atmospheric nitrogen deposition. J Ecol 91:357–370
Tomassen HBM, Smolders AJP, Limpens J et al (2004) Expansion of invasive species on ombrotrophic bogs: desiccation or high N deposition? J Ecol 41:139– 150
29 FIGURE CAPTIONS
Figure 1. Map of La Guette peatland (Neuvy-sur-Barangeon, France) showing the location of the studied plots with different vegetation (Open vs Closed) and from the two hydrological areas (Wet vs Dry).
Figure 2. Diagram of a peat core sampled and analyses performed.
Figure 3. Bulk density (a, b, c), PyroPhosphate Index, PPI (d, e, f), and total hemicellulosic sugar content (g, h, i) of the uppermost peat (0 to 15 cm) from different vegetation plots (Open and Closed) and from the two hydrological areas of the peatland (Wet and Dry). The error bars represent one standard error (n = 8).
Figure 4. Rock-Eval 6 Oxygen Index (OIRe6) and the ratio of the amount of pyrolysed CO2 to the amount of pyrolysed CO (OICO2/OICO) of the uppermost
peat (0 to 15 cm depth) from different vegetation plots (Open and Closed). The error bars represent one standard error (n = 8).
Figure 5. R400 index and C/S ratio of the uppermost peat (0 to 15 cm depth) from the two hydrological areas of the peatland (Wet and Dry). The error bars represent one standard error (n = 8).
Figure 6. Correlation between R400 and hemicellulosic sugar content of the uppermost peat ( 0 to 15 cm depth) (n = 48).
30
Figure 7. Correlation between CO2 Oxygen Index (OICO2) and CO Oxygen index
(OICO) of significant source material litter from La Guette peatland.
Figure 8. Concentrations of total soluble K (a) and S (b) in surface water sampled on May 2008 from the four studied plots in relation to the distance between these plots and the incoming drain of La Guette peatland (n=3).
WO = Wet Open, WC = Wet Closed, DO = Dry Open, DC = Dry Closed.
Figure 9. Hemicellulosic sugar contents (a) and R400 (b) (n = 4) of surface peat (0 – 5 cm depth) in relation to C/S (n = 3) of surface water sampled on May 2008 from the four studied plots in La Guette peatland.
31 TABLES
Table 1. Annual mean (4 sampling dates, May 2008-March 2009) characteristics of surface water sampled in the four studied plots from La Guette peatland (annual mean ± standard error, n=4 other than Al, n=1, not detected in the three other samplings). Data from seasonal monitoring are not shown.
West Open West Closed East Open East Closed pH 3.98 ± 0.21 3.73 ± 0.22 4.03 ± 0.34 3.93 ± 0.23 Conductivity (µS cm-1) 49.0 ± 6.47 65.0 ± 9.36 51.9 ± 8.25 63.9 ± 12.6 DOC (mg l-1) 16.2 ± 0.72 26.5 ± 1.59 13.9 ± 1.73 20.9 ± 1.87 K (mg l-1) 0.16 ± 0.03 0.20 ± 0.04 0.22 ± 0.02 0.59 ± 0.14 Na (mg l-1) 2.82 ± 0.11 2.39 ± 0.10 2.95 ± 0.03 3.37 ± 0.29 Mg (mg l-1) 0.28 ± 0.06 0.29 ± 0.03 0.21 ± 0.01 0.27 ± 0.03 Ca (mg l-1) 0.71 ± 0.16 0.76 ± 0.12 0.45 ± 0.02 0.73 ± 0.17 Si (mg l-1) 1.99 ± 0.24 1.94 ± 0.33 2.93 ± 0.32 3.11 ± 0.55 Fe (mg l-1) 0.42 ± 0.11 0.88 ± 0.10 0.52 ± 0.06 0.66 ± 0.004 Al (mg l-1) 0.17 0.27 0.36 0.76
Table 2. Chemical composition of the water sampled in the inlet drain on May 2008. Concentration in mg l-1 N-NO3- 0.31 N-NH4+ 0.08 N total 1.14 S total 0.95 Ca 3.19 Fe 1.40 K 1.89 Mg 0.53 Mn 0.04 Na 4.46 Si 4.26
32
Table 3. Plant cover Percentages of the main plant species in the four studied plots from La Guette peatland.
Strata Species Wet Open Wet Closed Dry Open Dry Closed
Moss Sphagnum cuspidatum 35 25 20 50
Sphagnum rubellum 25 0 5 0
Other 5 40 15 0
Herbaceous Molinia caerulea 20 35 40* 90*
Scheuzeria palustre 5 0 0 0
Eriophorum vaginatum 75 55 40 5
Shrub Calluna vulgaris 70 25 45 0
Erica tetralix 5 40 45 45
Tree Betula spp 0 25 0 15
33
Table 4. Depth-related evolution of biochemical properties of peat from the four studied plots in La Guette peatland. 4A: Mean (± 1 s.e., n = 4) bulk density, carbon, sulfur and nitrogen contents, organic matter amount and Pyrophosphate index (arbitrary units). 4B: Rock Eval parameters : Hydrogen Index, OICO2 (CO2
released during pyrolysis, relative to TOC), OICO (CO released during pyrolysis, relative to TOC), OIRe6 (O2 released as CO and CO2 during pyrolysis, relative to
TOC), R400 ratio (the part of the S2 signal produced below 400°C compared to the total S2 signal) and OICO2/ OICO ratio.
Table 4A.
Plot depth (cm) bulk density C (mg g-1) S (mg g-1) N (mg g-1) MO (%) PPI (g cm-3) Wet Open 0-5 0.05 ± 0.02 423 ± 15.2 2.19 ± 0.61 9.8 ± 2.74 89 ± 2.9 14 ± 4.3 5-10 0.10 ± 0.02 413 ± 19.6 3.50 ± 0.22 13.1 ± 3.08 83 ± 2.6 27 ± 3.4 10-15 0.16 ± 0.01 403 ± 21.5 3.01 ± 0.37 13.5 ± 1.54 81 ± 1.9 41 ± 7.8 15-20 0.18 ± 0.03 453 ± 10.5 2.53 ± 0.28 15.0 ± 0.90 88 ± 1.5 50 ± 19.0 20-25 0.20 ± 0.02 462 ± 9.6 1.78 ± 0.06 13.0 ± 2.13 86 ± 1.5 88 ± 13.0 25-30 0.32 ± 0.03 441 ± 15.7 1.22 ± 0.14 10.9 ± 1.97 78 ± 2.4 104 ± 11.3 30-35 0.24 ± 0.03 510 ± 27.9 1.52 ± 0.09 8.9 ± 1.43 87 ± 3.3 121 ± 11.5 35-40 0.17 ± 0.03 520 ± 20.1 1.51 ± 0.18 10.1 ± 1.94 90 ± 4.7 137 ± 23.1 40-45 0.13 ± 0.01 499 ± 10.1 2.34 ± 0.27 9.3 ± 2.42 92 ± 2.0 109 ± 11.6 45-50 0.12 ± 0.03 403 ± 54.8 2.05 ± 0.44 6.7 ± 0.58 74 ± 10.0 73 ± 7.2 Wet Closed 0-5 0.08 ± 0.01 409 ± 9.5 3.48 ± 0.17 13.1 ± 1.22 81 ± 0.5 23 ± 2.3 5-10 0.12 ± 0.01 436 ± 15.8 3.21 ± 0.15 15.5 ± 0.91 86 ± 2.0 24 ± 2.4 10-15 0.19 ± 0.01 417 ± 9.2 2.52 ± 0.12 13.9 ± 1.19 80 ± 1.6 43 ± 9.2 15-20 0.27 ± 0.02 350 ± 7.7 1.72 ± 0.05 9.7 ± 0.73 64 ± 1.9 67 ± 6.6 20-25 0.35 ± 0.02 317 ± 30.4 1.28 ± 0.16 8.1 ± 0.71 56 ± 4.1 85 ± 6.9 25-30 0.37 ± 0.07 345 ± 56.6 1.23 ± 0.41 6.7 ± 1.42 57 ± 9.4 107 ± 9.5 30-35 0.21 ± 0.01 423 ± 69.1 1.53 ± 0.22 6.6 ± 1.51 70 ± 10.9 104 ± 15.8 35-40 0.33 ± 0.05 176 ± 38.9 1.00 ± 0.28 2.0 ± 1.07 32 ± 7.1 50 ± 11.2 40-45 0.85 ± 0.11 45 ± 7.7 0.16 ± 0.07 0.0 ± 0.00 9 ± 1.4 13 ± 1.7 45-50 0.84 ± 0.14 40 ± 7.1 0.19 ± 0.05 0.0 ± 0.00 8 ± 1.3 14 ± 1.2 Dry Open 0-5 0.03 ± 0.01 410 ± 16.6 3.83 ± 0.39 13.9 ± 1.09 86 ± 3.6 17 ± 1.0 5-10 0.04 ± 0.00 399 ± 17.7 4.04 ± 0.11 15.1 ± 0.61 84 ± 2.5 17 ± 1.4 10-15 0.10 ± 0.01 361 ± 30.7 3.60 ± 0.15 15.7 ± 0.69 75 ± 5.4 19 ± 2.9 15-20 0.17 ± 0.03 373 ± 24.2 3.06 ± 0.21 18.9 ± 1.08 73 ± 5.2 31 ± 6.3 20-25 0.21 ± 0.02 358 ± 21.3 2.49 ± 0.13 18.1 ± 0.75 70 ± 5.0 42 ± 5.5 25-30 0.26 ± 0.01 339 ± 15.6 2.17 ± 0.08 16.5 ± 0.99 64 ± 2.9 63 ± 2.5 30-35 0.26 ± 0.01 318 ± 21.4 1.96 ± 0.13 14.8 ± 0.85 60 ± 4.4 69 ± 2.1 35-40 0.31 ± 0.03 273 ± 32.7 1.55 ± 0.20 12.5 ± 1.59 50 ± 5.1 76 ± 5.8 40-45 0.38 ± 0.05 195 ± 50.6 1.12 ± 0.24 9.1 ± 2.03 37 ± 8.0 61 ± 7.3 45-50 0.51 ± 0.14 66 ± 25.3 0.39 ± 0.15 3.0 ± 1.33 21 ± 2.6 35 ± 3.2 Dry Closed 0-5 0.07 ± 0.01 412 ± 6.1 4.33 ± 0.38 15.4 ± 0.71 85 ± 0.6 24 ± 1.6 5-10 0.09 ± 0.01 389 ± 7.9 4.61 ± 0.28 17.5 ± 0.77 81 ± 1.7 25 ± 3.0 10-15 0.17 ± 0.01 379 ± 7.7 3.47 ± 0.39 17.5 ± 1.11 75 ± 1.8 31 ± 5.7 15-20 0.21 ± 0.01 397 ± 8.3 2.81 ± 0.19 18.1 ± 0.57 77 ± 0.7 40 ± 7.3 20-25 0.20 ± 0.00 402 ± 13.3 2.83 ± 0.18 18.0 ± 0.62 77 ± 2.2 45 ± 4.4 25-30 0.19 ± 0.02 426 ± 16.5 2.71 ± 0.10 18.2 ± 1.58 79 ± 2.6 51 ± 7.8 30-35 0.18 ± 0.01 417 ± 16.3 2.65 ± 0.20 16.3 ± 1.49 77 ± 2.8 60 ± 8.6 35-40 0.18 ± 0.01 399 ± 9.9 2.35 ± 0.13 14.6 ± 1.07 72 ± 1.9 90 ± 7.7 40-45 0.17 ± 0.01 424 ± 8.8 2.30 ± 0.20 14.5 ± 0.89 75 ± 0.7 93 ± 2.8 45-50 0.18 ± 0.01 388 ± 41.5 2.17 ± 0.29 12.1 ± 1.66 69 ± 6.6 96 ± 7.4
34
Table 4B.
Plot depth (cm) HI (mg HC OICO2 (mg CO2 OI CO (mg CO OI Re6 (mg O2 R400 OICO2/OICO g-1 TOC) g-1 TOC) g-1 TOC) g-1 TOC) Wet Open 0-5 383 ± 22.8 217 ± 17.1 63 ± 3.9 194 ± 14.0 0.54 ± 0.01 3.42 ± 0.21 5-10 395 ± 15.3 185 ± 14.4 48 ± 1.1 162 ± 11.0 0.50 ± 0.01 3.86 ± 0.25 10-15 423 ± 17.5 173 ± 13.5 45 ± 1.1 152 ± 9.8 0.48 ± 0.01 3.90 ± 0.32 15-20 400 ± 13.2 180 ± 16.6 44 ± 3.3 156 ± 13.3 0.46 ± 0.02 4.05 ± 0.30 20-25 418 ± 19.8 158 ± 14.7 45 ± 2.2 141 ± 11.9 0.40 ± 0.02 3.46 ± 0.18 25-30 393 ± 46.5 139 ± 16.2 45 ± 4.2 127 ± 13.6 0.34 ± 0.02 3.11 ± 0.22 30-35 437 ± 38.2 147 ± 22.7 49 ± 7.4 135 ± 20.4 0.34 ± 0.02 3.03 ± 0.19 35-40 393 ± 40.2 148 ± 19.0 50 ± 5.6 136 ± 17.0 0.35 ± 0.01 2.98 ± 0.07 40-45 325 ± 17.7 179 ± 17.3 66 ± 6.8 168 ± 16.3 0.38 ± 0.01 2.70 ± 0.09 45-50 323 ± 17.8 146 ± 9.1 55 ± 1.3 137 ± 7.3 0.38 ± 0.01 2.65 ± 0.11 Wet Closed 0-5 338 ± 13.1 146 ± 3.2 65 ± 6.2 143 ± 3.7 0.51 ± 0.01 2.32 ± 0.24 5-10 446 ± 6.0 146 ± 2.7 51 ± 5.6 135 ± 1.9 0.52 ± 0.01 2.98 ± 0.37 10-15 465 ± 5.2 125 ± 5.6 57 ± 7.6 124 ± 6.2 0.44 ± 0.02 2.30 ± 0.32 15-20 454 ± 6.9 116 ± 5.9 54 ± 4.7 115 ± 3.6 0.38 ± 0.01 2.23 ± 0.28 20-25 452 ± 7.1 97 ± 2.8 54 ± 3.4 101 ± 2.0 0.34 ± 0.01 1.82 ± 0.17 25-30 456 ± 8.2 76 ± 9.4 46 ± 7.8 81 ± 11.2 0.34 ± 0.01 1.69 ± 0.11 30-35 485 ± 25.5 86 ± 3.4 53 ± 9.3 93 ± 7.4 0.33 ± 0.01 1.75 ± 0.25 35-40 408 ± 16.9 91 ± 1.5 63 ± 7.9 102 ± 5.4 0.35 ± 0.01 1.50 ± 0.17 40-45 371 ± 11.6 82 ± 2.3 67 ± 5.2 97 ± 1.9 0.40 ± 0.00 1.26 ± 0.13 45-50 341 ± 19.2 78 ± 2.2 65 ± 4.1 94 ± 2.2 0.40 ± 0.01 1.20 ± 0.10 Dry Open 0-5 385 ± 5.0 185 ± 8.1 54 ± 3.1 165 ± 5.7 0.56 ± 0.01 3.45 ± 0.28 5-10 377 ± 7.9 186 ± 4.4 53 ± 2.5 166 ± 2.0 0.56 ± 0.01 3.54 ± 0.24 10-15 428 ± 11.9 164 ± 3.0 43 ± 3.1 144 ± 2.6 0.52 ± 0.03 3.83 ± 0.29 15-20 449 ± 19.8 155 ± 5.8 41 ± 1.9 136 ± 5.0 0.50 ± 0.01 3.82 ± 0.15 20-25 457 ± 11.2 147 ± 5.5 40 ± 1.8 129 ± 4.3 0.46 ± 0.01 3.72 ± 0.19 25-30 463 ± 2.7 133 ± 4.2 39 ± 2.2 119 ± 3.7 0.42 ± 0.01 3.45 ± 0.19 30-35 438 ± 8.6 112 ± 13.6 36 ± 1.5 102 ± 10.0 0.38 ± 0.01 3.14 ± 0.40 35-40 398 ± 26.4 108 ± 2.7 39 ± 2.1 101 ± 2.1 0.35 ± 0.00 2.82 ± 0.19 40-45 332 ± 45.8 103 ± 3.9 42 ± 3.2 99 ± 4.3 0.31 ± 0.02 2.48 ± 0.16 45-50 286 ± 7.3 96 ± 1.7 47 ± 2.4 97 ± 1.4 0.28 ± 0.02 2.08 ± 0.12 Dry Closed 0-5 349 ± 20.7 154 ± 12.3 69 ± 0.9 152 ± 8.4 0.56 ± 0.02 2.22 ± 0.20 5-10 388 ± 4.5 147 ± 12.6 64 ± 2.9 143 ± 10.7 0.53 ± 0.01 2.30 ± 0.12 10-15 421 ± 1.6 134 ± 11.5 55 ± 1.2 129 ± 9.0 0.49 ± 0.01 2.41 ± 0.17 15-20 435 ± 1.8 128 ± 13.2 50 ± 3.4 122 ± 10.7 0.46 ± 0.01 2.57 ± 0.25 20-25 428 ± 14.3 108 ± 14.9 50 ± 3.6 107 ± 12.4 0.45 ± 0.01 2.16 ± 0.21 25-30 404 ± 14.8 105 ± 16.0 47 ± 3.6 103 ± 13.1 0.43 ± 0.01 2.22 ± 0.25 30-35 399 ± 11.0 96 ± 15.1 46 ± 4.0 97 ± 12.4 0.42 ± 0.01 2.08 ± 0.25 35-40 406 ± 9.0 85 ± 13.1 44 ± 2.6 87 ± 10.9 0.39 ± 0.01 1.90 ± 0.20 40-45 447 ± 5.7 77 ± 12.3 43 ± 3.0 81 ± 10.6 0.35 ± 0.01 1.78 ± 0.17 45-50 400 ± 17.7 76 ± 9.9 46 ± 1.4 81 ± 7.4 0.36 ± 0.02 1.67 ± 0.21
35
Table 5. Statistical results of the two-way ANOVAs for each response variable.
0-5 cm 5-10 cm 10-15 cm
F P F P F P
bulk density area 2.51 0.14 9.65 0.01 12.6 0.004
vegetation 12.1 0.005 8.01 0.02 25.1 0.0003 area×vegetation 0.46 0.51 1.44 0.25 5.35 0.04 PPI area 0.59 0.46 1.98 0.18 5.84 0.03 vegetation 8.76 0.01 0.81 0.39 1.06 0.32 area×vegetation 0.22 0.64 4.24 0.06 0.54 0.47 HI area 0.15 0.71 13.6 0.003 2.35 0.15 vegetation 5.71 0.03 9.78 0.01 2.53 0.14 area×vegetation 0.07 0.79 3.14 0.10 4.29 0.06
Total hemicellulose area 18.4 0.001 20.3 0.001 6.81 0.02
vegetation 11.8 0.005 2.02 0.18 0.15 0.70 area×vegetation 2.21 0.16 0.84 0.38 0.52 0.49 OIRe6 area 0.61 0.45 0.48 0.50 0.04 0.84 vegetation 15.1 0.002 8.19 0.01 8.20 0.01 area×vegetation 3.72 0.08 0.01 0.93 0.70 0.42
OICO2/OICO area 0.03 0.88 3.69 0.08 0.003 0.96
vegetation 24.3 0.0003 16.3 0.002 28.2 0.0002 area×vegetation 0.08 0.79 0.48 0.50 0.09 0.77 R400 area 9.12 0.01 12.1 0.005 6.20 0.03 vegetation 1.75 0.21 0.05 0.83 4.24 0.06 area×vegetation 1.81 0.20 4.01 0.07 0.01 0.94 S area 8.94 0.01 23.0 0.0004 6.41 0.03 vegetation 4.64 0.05 0.51 0.49 1.08 0.32 area×vegetation 0.90 0.36 4.59 0.05 0.16 0.70 C/S area 8.00 0.02 19.1 0.001 7.10 0.02 vegetation 3.93 0.07 0.01 0.91 0.98 0.34 area×vegetation 1.06 0.32 3.39 0.09 0.07 0.80 C/N area 2.47 0.14 4.26 0.06 7.20 0.02 vegetation 1.17 0.30 1.96 0.19 0.12 0.73 area×vegetation 0.48 0.50 0.00 0.97 0.09 0.78 OM content area 0.09 0.77 0.70 0.42 3.14 0.10 vegetation 3.57 0.08 0.01 0.92 0.02 0.89 area×vegetation 1.82 0.20 1.76 0.21 0.11 0.75 C area 0.14 0.72 3.64 0.08 4.21 0.06 vegetation 0.26 0.62 0.14 0.72 0.66 0.43 area×vegetation 0.40 0.54 1.11 0.31 0.01 0.93 N area 3.09 0.10 1.03 0.33 2.36 0.15 vegetation 1.68 0.22 1.63 0.23 0.08 0.79 area×vegetation 0.53 0.48 0.20 0.66 0.002 0.96
36
Table 6. Litter biochemical indicators of the dominant mosses (Sphagnum spp.) and vascular plants (Betula verrucosa. and Molinia caerulea) in
1
La Guette peatland.
2
Sphagnum litter corresponds to the white-yellow part below the green or red photosynthetic part.
3 4 OM (%) C (mg g-1) N (mg g-1) S (mg g-1) HI (mg HC g-1 TOC) OI (mg CO2 g-1 TOC) OICO (mg CO g-1 TOC) OIRe6 (mg O2 g-1
TOC) R400 OICO2/OICO
Sphagnum cuspidatum litter 98.5 428.2 2.2 0.61 404 252 79 228 0.76 3.20
Sphagnum rubellum litter 98.1 431.7 2.2 0.53 460 301 86 268 0.73 3.52
Senescent leaves of Betula verrucosa 96.8 501.3 6.2 0.59 544 135 105 158 0.63 1.29
Branches of Betula verrucosa nm nm nm nm 506 133 130 171 0.63 1.02
Roots of Betula verrucosa nm nm nm nm 459 143 71 145 0.66 2.01
Molinia caerulea litter 92.9 446.7 1.0 0.45 635 150 139 188 0.78 1.08
Shoots of Molina caerulea nm 469.2 nd 0.48 576 126 61 126 0.83 2.07
Roots of Molinia caerulea nm nm nm nm 534 214 157 245 0.83 1.36
nm = not measured nd = not detected
5 6