HAL Id: hal-01428964
https://hal.archives-ouvertes.fr/hal-01428964
Submitted on 6 Jan 2017
HAL is a multi-disciplinary open access archive for the deposit and dissemination of sci-entific research documents, whether they are pub-lished or not. The documents may come from teaching and research institutions in France or abroad, or from public or private research centers.
L’archive ouverte pluridisciplinaire HAL, est destinée au dépôt et à la diffusion de documents scientifiques de niveau recherche, publiés ou non, émanant des établissements d’enseignement et de recherche français ou étrangers, des laboratoires publics ou privés.
Compact nanosecond laser system for the ignition of
aeronautic combustion engines
G. Amiard-Hudebine, G. Tison, E. Freysz
To cite this version:
G. Amiard-Hudebine, G. Tison, E. Freysz. Compact nanosecond laser system for the ignition of aeronautic combustion engines. Journal of Applied Physics, American Institute of Physics, 2016, 120 (23), pp.233102. �10.1063/1.4971964�. �hal-01428964�
Study of a compact nanosecond laser system for the ignition
of aeronautic combustion engines
G. Amiard-Hudebine1, G. Tison1, and E. Freysz1
Université de Bordeaux, CNRS-UMR 5798, Laboratoire Ondes et Matière d'Aquitaine, 351 Cours de la Libération 33405 TALENCE Cedex
eric.freysz@u-bordeaux.fr
Abstract
We have studied and developed a compact nanosecond laser system dedicated to the ignition of aeronautic combustion engines. This system is based on a nanosecond microchip laser delivering 6 µJ nanosecond pulses, which are amplified in two successive stages. The first stage is based on an Ytterbium doped fiber amplifier (YDFA) working in a quasi-continuous-wave (QCW)
regime. Pumped at a 1 kHz repetition rate, it delivers TEM00 and linearly polarized nanosecond
pulses centered at 1064 nm with energies up to 350 µJ. These results are in very good agreement with the model we specially designed for a pulsed QCW pump regime. The second amplification stage is based on a compact Nd:YAG double-pass amplifier pumped by a 400 W peak power
QCW diode centered at =808 nm and coupled to a 800 µm core multimode fiber. At a 10 Hz
repetition rate, this system amplifies the pulse delivered by the YDFA up to 11 mJ while preserving its beam profile, polarization ratio, and pulse duration. Finally, we demonstrate that this compact nanosecond system can ignite an experimental combustion chamber.
I. Introduction
Nanosecond laser-induced spark ignition of combustion engines is usually based on nonresonant gas breakdown [1-5]. The breakdown process is initiated by few free electrons in the interaction region. For nanosecond laser pulses breakdown in air, multi-photon ionization of air molecules is initially responsible for the generation of these seed electrons. The optical breakdown process is subsequent to avalanche ionization which results in a cascade growth of electron density in the interaction volume. Laser beam energy is absorbed via an inverse bremsstrahlung process and hot and dense plasma is created. The plasma generation and expansion is started and continued within the pulse duration time. The breakdown threshold power density, which depends on many parameters and thermodynamic properties, has been
evaluated between and in air [6]. Nowadays, this power density is
relatively modest and can be delivered by commercial laser systems and a nanosecond pulse in near infrared with peak power ranging from 0.1 to 1 MW can easily reach this threshold. However, inducing laser plasma within a combustion chamber does not ensure its ignition. The plasma has to bring a minimum energy to sustain the initial combustion within the ignition kernel [7-9]. The minimum ignition energy depends upon the nature of the fuel (gas or liquid droplets). Different laser systems have been developed to ignite the gas mixture of an automobile engine [10-19]. However, the environment where the laser source has to be placed is often very hostile (vibrations, high temperature variations, oil projections). For aeronautic applications where the ignition of kerosene liquid droplets is required, we will show that a laser device delivering short (~1 ns) and powerful pulses (~10 mJ), which is a very good spatial beam shape
(M2~1.2), can ignite an experimental combustion chamber. To satisfy all the criteria mentioned
by a microchip laser. The first fiber amplification stage acts as a pre-amplifier and it is a means of transportation for the pre-amplified pulse. The second amplification stage brings the laser pulse energy delivered by the first amplifier above the spark ignition threshold. This latter compact device, built around a Nd:YAG rod, is placed very close to the motor chamber. It can work under relatively large temperature variations and is mechanically robust.
In a compact combustion engine, the transportation of the laser pulses cannot be in free space; therefore, the first amplification stage that we developed is a fully integrated master oscillator power amplifier, which is based on an ytterbium doped fiber amplifier (YDFA) preserving the polarization of the seeded pulses. It has been shown that YDFA can cover broadband amplification regimes ranging from continuous wave (CW) to femtosecond pulses [20]. The former seeks for the highest average power with narrow spectral linewidth [21], while the latter aims at the highest peak power. Amplification of nanosecond pulses lies in between, targeting the highest energy per pulse. In the past decade and in the nanosecond regime, many research teams have developed YDFA delivering nanosecond pulses with pulse energy over 1 mJ [22-24] and even 25 mJ using Yb-doped large mode area fibers [25-26]. All those results were achieved by cascading multiple YDFA pumped by laser diodes centered at 976 nm and working at a repetition rate around 10 kHz. However, most of these YDFA could not fit the standard engine constraints mainly because, without dedicated temperature regulation, the large temperature changes in the environment of the engine (T~50 K) lead to a large shift in the
central wavelength of the pumping laser diodes (~15 nm for T 50 K) and, therefore, to a
drastic reduction of the amplified pulse energy. Moreover, YDFA, which delivers powerful nanosecond pulses, also suffers other limitations associated with amplified stimulated emission (ASE) and nonlinear optical effects, such as four-wave mixing (FWM), and stimulated Brillouin
and Raman scattering (SBS and SRS) [27]. To limit these side effects, one generally cascades multiple stage amplifiers separated by dedicated filters and increases the amplification repetition rate up to 10 kHz to further filter and delay ASE and nonlinear effects. To further limit SBS, one can also work with a pulse duration below 2 ns [28]. The YDFA we developed is based on a 1.1 meter single mode 25/250 µm (radius of the core/clad) Yb-doped double clad (DC) large mode area (LMA) polarization maintaining (PM) fiber. It is seeded by nanosecond pulses centered at
1064nm whose duration is =1.00±0.05 ns delivered by a Nd:YAG microlaser. Its repetition rate
can be varied by the user from a single pulse up to 10 kHz. To overcome the limitation imposed by the temperature variations sensed by the pumping laser diodes within the engine, this YDFA
is pumped at 915 nm. Compared to the absorption cross section of Yb3+ ions at 976 nm, the
absorption cross section of the Yb3+ ions at this latter wavelength is reduced; however, its
broader spectral bandwidth and smoother structure makes it rather less sensitive to temperature variations. This first amplification stage brings the microchip pulse energy from 6 µJ up to 350 µJ. While this system yields nanosecond pulses with no measureable SBS, SRS, or FWM appearing in the spectra of the laser pulse and with a negligible ASE (less than a few percentages of the total spectral density), the delivered output pulse energy is not able to ignite a combustion engine. Therefore, to further boost the pulse energy, we designed a compact rod type Nd:YAG amplifier. The latter was built around a 0.6% doped Nd:YAG rod crystal. The diameter of this 10 mm long crystal is 4 mm. It is pumped by a quasi-CW (QCW) 800 µm fiberized diode laser centered at 808 nm. By carefully designing this amplifier and choosing the pump pulse duration, we were able to bring the energy of the pre-amplified pulse from 350 µJ up to 11 mJ at a 10 Hz repetition rate. The output pulses preserve the polarization, spatial, and spectral profile of the
pulses delivered by microchip seed laser. We demonstrate that such laser pulses can ignite a spark in air and ignite an experimental combustion chamber.
As already mentioned, for aerospatial applications, energy saving is a crucial issue. Therefore, it is important to minimize, as much as possible, the time of use of all the optical amplifiers. In this context, we have specifically studied the transient amplification regime reached during the turn on of the pre-amplifier and the amplifier. Such studies, which are rather important in our context, are often neglected in most of the simulations so far developed [29-31]. Therefore, we have developed a simulation that takes into account the transient behavior of the pre-amplifier and the amplifier. The results we obtained are in good agreement with the experiments we performed.
The paper is arranged as follows. In Sec. II, IV, V and VI, we describe the first amplification stage we built and the design we used to avoid the limitations introduced by ASE and nonlinear effects. The experimental data obtained in steady state and transient regimes will then be compared to the model we developed. In Sec. VII, we describe the design of the Nd:YAG amplifier stage that we developed. The evolution of the output pulse energy versus the input pulse energy and the pump pulse energy will then be presented and discussed. In Sec. VIII, we demonstrate the ability of this amplified microchip laser to create plasma in air and to ignite an aeronautic combustion chamber. We conclude by presenting some of the prospects for this device.
II. Pre-amplifier design and performances.
The YDFA we developed is sketched in Figure 1. It uses a 110 cm long, single mode, 25/250 DC-LMA-PM active fiber doped at 5%. It was pumped with two 25 W 105/125 fibered diodes operating at 915 nm (Oclaro BMU25). The use of two 25 W fiberized pump diodes
ensured a large enough amplification of the seeded nanosecond pulses. As already mentioned,
the pumping quantum efficiency of Yb3+ ions is less important at 915 nm compared to 976 nm.
However, the broader and smoother absorption of Yb3+ ions at 915 nm makes it less sensitive to
temperature variations, thereby avoiding the use of an active control of the temperature of the laser diode. This YDFA is seeded by nanosecond pulses yielded by a microlaser (Crylas DPSS
1064-Q2). It delivers linearly polarized pulses centered at the wavelength=1064 nm. At 10
kHz, which is the maximal repetition rate of this microlaser, the pulses had a duration of 1.00±0.05 ns and an energy of 6 µJ. The beam delivered by this microlaser had a divergence smaller than 3 mrad. To prevent any harmful back-reflection, an optical isolator was placed in
between the amplifying fiber and the microlaser. To ensure the proper injection of the
polarization of the seed pulses along the neutral axis of the amplifying fiber, a half-wave plate was placed in front of the 18 mm aspheric lens, which coupled the seeding pulses within the amplifying fiber. The pulses were coupled into a passive 25/250 PM fiber (DC-LMA-PM). The output of this passive fiber and the two fibered pump diodes were spliced with the input of the
active fiber by a 2+1→1 combiner. Due to the small cross section absorption of Yb3+ ions at 915
nm and the small length of our fiber power, we found that only ~20% of the pump power was absorbed by the amplifier. The output of the active fiber was spliced to an end-cap, which lowered the peak power at the glass-air interface. This end-cap and the input of the passive fiber were cleaved at a large angle to avoid any free lasing. The microlaser and the laser diodes were synchronized by a homemade electronic system that made it possible to remotely adjust the parameters, such as the repetition rate of the microlaser, the duration and peak power of the pump, and the time delay between the pumping and microchip seeding pulses. At the exit of this YDFA, the amplified nanosecond pulse was mixed with the residual pump power and ASE. Most
of the remaining pump power was rejected by a dichroic mirror (DM). A diaphragm was used to block the few amounts of pulse energy and ASE propagating in the cladding modes. A polarizing beam-splitter cube transmitted the amplified pulses with the desired polarization. Since the ASE was unpolarized, ~50% of its intensity was reflected by this polarizing cube. The latter was measured and used to correct the effective amplified pulse intensity transmitted by the cube.
Figure 1: Experimental setup of the YDFA amplifier (DM: dichroic mirror).
III. Continuous pumping regime
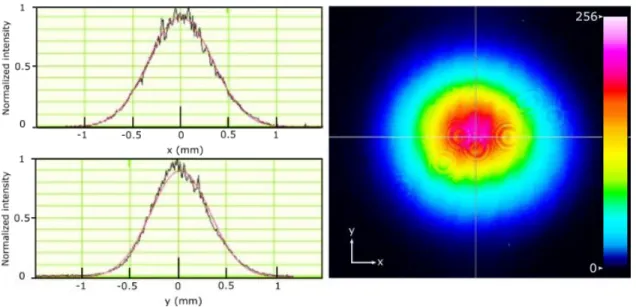
We pumped the amplifier in the CW regime and recorded the evolution of the amplified output pulse energy versus the pump power. We already mentioned that only ~20% of the pump power was absorbed by the amplifying fiber. The repetition rate of seeding pulses generated by the microlaser was adjusted from 1 kHz to 4 kHz. Whatever the pump power, the far field spatial
profile of the output pulse was found to be almost TEM00 (Fig. 2) and its degree of polarization
was always better than 100:1.
The evolution of the output pulse energy versus the pump power absorbed by the amplifying fiber and recorded for different repetition-rates of the microlaser is displayed in Figure 3. 0 1 2 3 4 5 0 50 100 150 200 1 kHz 2 kHz 3 kHz 4 kHz E o u t ( µ J ) CW pump power (W)
Figure 3: Energy of the amplified pulses versus the continuous wave (CW) pump power for different pulse repetition rates.
We noticed that whatever the repetition rate, and for intensities of the pump power larger
than 5W, the amplifier acted as a laser and oscillated at =1030 nm. This phenomenon was due
to the fluorescence within the fiber, which was centered at =1030 nm. Above a pump threshold,
the fluorescence was strong enough to compensate for the losses at the end of the fiber, and the fiber was able to oscillate at this wavelength. By keeping the pump power below 5 W, the maximal output pulse energy was achieved at 1 kHz repetition rate and was ~185 µJ. As
displayed in Figure 3, as the repetition increased the pulse energy decreased. This behavior was also recorded when the pulse repetition rate decreased below 1 kHz. As already mentioned, above 5 W of pump power we noticed the apparition of a free lasing effect. This indicated that during its propagation in the amplifying fiber, the seed pulses did not sufficiently lower the residual gain of amplifier. Indeed, the energy of the seeding pulses was way below the saturation energy of the amplifier medium (Esat=75 µJ). Therefore, the latter was insufficient to extract a
large amount of the stored energy in the fiber amplifier. For 4.5 W of pump power, when we increase the repetition rate of the microlaser from 1 kHz to 4 kHz, the output power increased from 170 mW to 480 mW indicating that the pump to seed conversion efficiency increased from ~19% up to ~53%. Simultaneously, we noticed that the amplitude of the spontaneous emission
centered at =1030 nm decreased. This clearly stressed that, as expected, at =1064 nm the
energy stored in the amplifier could be extracted by increasing the microlaser repetition rate. However, the energy of the amplified pulses decreased from 170 µJ to 120 µJ. The following sections will show how to further limit the free lasing regime of this amplifier experimentally and numerically, and therefore increase the energy of the amplified pulses.
IV. Quasi-continuous wave pumping
To avoid the apparition of free lasing in our amplifier, we decided to pump it in a QCW regime. In this regime, the amplifier is pumped during a time that is lower or comparable to the fluorescence life time rad of its long living excited state (2F5/22F7/2), which, for Yb3+ ions in a
germanosilica glass, is about rad~1 ms. New pumping of the amplifying fiber was repeated after
an off waiting time of Trad. Hereafter, we report on the influence of the pump duration and the
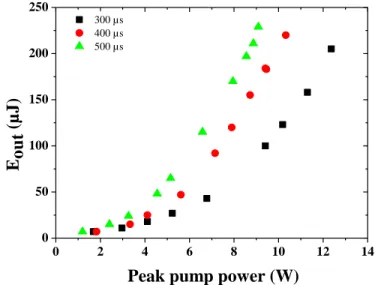
pump power on the output energy of the seeded pulse. Figure 4 displays the evolution of the pulse energy at the output of the amplifier versus the pump pulse duration when the repetition
rate of the microlaser is fixed to 1 kHz. We stopped to increase the pump power each time we reached the lasing threshold of the amplifier.
0 2 4 6 8 10 12 14 0 50 100 150 200 250
Peak pump power (W)
Eo u t (µ J ) 300 µs 400 µs 500 µs
Figure 4: Evolution of the energy of the amplified pulse versus the peak pump power for different pump pulse durations.
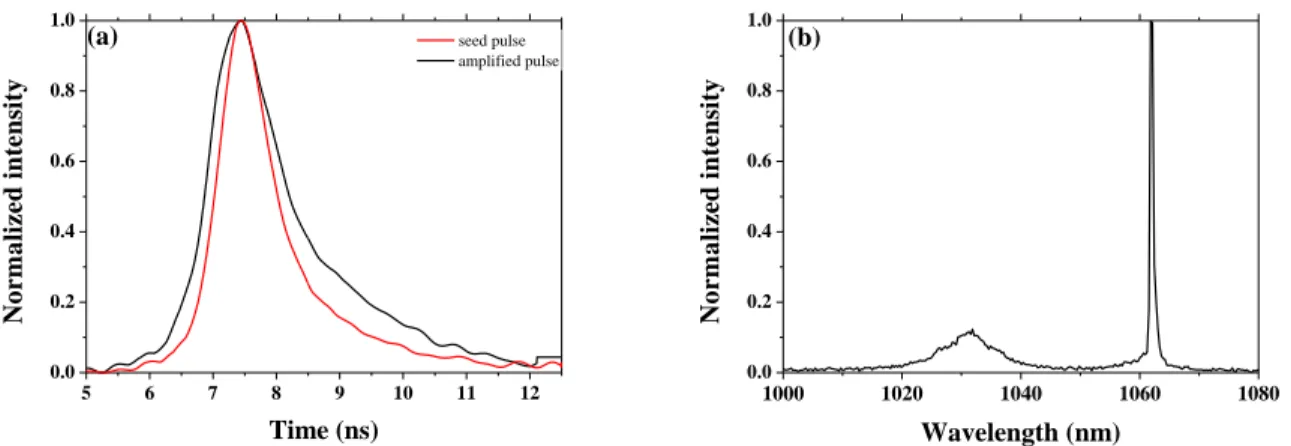
As expected, at a given peak power of the pump, as the pulse duration increased, the energy stored in the fiber and the output pulse energy increased. Energies up to 230 µJ were recorded when the amplifier was pumped with 9 W of pump power during 500 µs. In this regime, which corresponded to a duty cycle of 50%, we recorded a slight modification of the temporal envelope of the seed pulse, and the ASE was rather limited (Fig. 5a-b). The pulse
duration at half width increased from ~1.00±0.05 ns to ~1.33±0.05 ns. It is important to stress
that under this QCW regime, while the output pulse energy increased, the overall efficiency of this amplifier reduced. It was, at most, about 24%. Nevertheless, the beam shape of the amplified pulse remained very good as did its polarization ratio (~100:1). The measurement of the beam
diameter for different positions indicated M2~1.1. These measurements, performed with the
5 6 7 8 9 10 11 12 0.0 0.2 0.4 0.6 0.8 1.0 N o r m a li z e d i n te n si ty Time (ns) seed pulse amplified pulse (a) 1000 1020 1040 1060 1080 0.0 0.2 0.4 0.6 0.8 1.0 N o r m a li z e d i n te n si ty Wavelength (nm) (b)
Figure 5: a) Temporal envelope of the input and amplified pulse: input (amplified) pulse in red (black). b) Spectrum of the output beam. The amplified pulse is centered at =1064 nm. At =1030 nm the apparition of ASE was noticeable. These measurements were performed with 9 W of pump power, and the energy of the amplified pulse was 230 µJ.
Due to the relatively weak absorption (~20%) of the pump power by the amplifying fiber, we did not restrict the length of our amplifying fiber to 110 cm. Using a fiber with the length of L=1.5 m, we amplified the signal to energies up to 350 µJ (Fig. 6).
4 5 6 7 8 9 50 100 150 200 250 300 350
Peak pump power (W) Eo u t (µ J )
Figure 6: Evolution of the energy of the amplified pulse at the exit of a 1.5 meter length fiber versus the peak pump power for a pump duration of 500 µs.
However, occasionally, we noticed that when the amplified pulse energies were ~350 µJ, the generation of nonlinear effects, such as four-wave mixing, was taking place. The latter phenomenon was easily noticeable since it resulted in the generation of visible spectral components. The observation of four-wave mixing regularly foreshadowed the occurrence of damage within the fiber. Therefore, it was safer to keep the length of the amplifier fiber to ~110 cm. Under these conditions, we did not notice the occurrence of any damage within the fiber.
V. Simulations
To simulate the behavior of our fiber amplifier in the QCW regime, we developed a
simple model. We considered that, at room temperature, Yb3+ ions in silica fibers behaved as a
quasi-three-level system. However, in silica fiber, the high phonon energy led to the fast decay of the higher excited states to the metastable level. We therefore assumed that the amplifier media could be described by a simplified two-level rate equation [32]. To account for the behavior of our amplifier, we decomposed its evolution in different sequences. The first was the pumping sequence when the microchip laser was switched off. We therefore derived the population inversion evolution induced by the sole pumping of the amplifying medium. During this sequence, we easily derived the evolution of the pump power at each point within the fiber as well as the amplified stimulated emission. The fiber was split in a 1D grid with meshes of 1 cm. Smaller meshes did not improve the results. For the mesh at position n, the absorbed pump energy is:
(1)
(2)
where is the remaining pump energy, which was not absorbed; ( ) is the
are the population density within the fundamental and excited state level. Accordingly, we derived the inversion of population for each mesh following an Eulerian integration:
, (3)
where dt is our time increment and is the energy of the pump photons.
Knowing the excited population, we derived the number of photons emitted by the spontaneous emission SE(n) at each position of the mesh:
(4)
For Yb3+, this spontaneous emission was mainly centered at =1030 nm. Spontaneous
emission occurring over 4 steradians, only the photons emitted in the numerical aperture of our
fiber were guided in the core fiber and could contribute efficiently to ASE. The other photons not guided in the core of the fiber or leaking through the cladding were considered lost. To compute the ASE, we assumed that for each mesh, ASE resulted from photons emitted within the numerical aperture of the fiber at mesh n and were added with photons emitted and amplified in the neighboring meshes:
, (5)
where ASE(n) is the number of emitted photons by ASE in the mesh n and is the
spontaneous emission at =1030 nm emitted in the numerical aperture of the fiber. According to
the experimental results presented in Fig. 5b, we considered that the value of was averaged
over the ASE spectral range from =1020 nm to =1040 nm. To compute the overall ASE, we
considered photons emitted in the forward direction from mesh 1 to the end of the fiber. According to Eq. 5, this ASE was overestimated since, doing so, we did not consider the impact on the excited state population of ASE generated in the backward direction. To account for this
overestimation, we computed the ASE in the backward direction. We repeated the computation of ASE in the forward and backward directions back and forth. With this method, and after about four iterations, we promptly converged towards a solution, where the difference between ASE between two iterations was less than 1%. The set of equations (1–5) made it possible to compute
the population in the excited state N2(n) at each point of the fiber and allowed us to evaluate the
evolution of the energy of the seed pulse Eout(n) within each mesh of the fiber. According to Estable et al. [33], Eout(n) is:
(6)
where S is the surface of the fiber core; is the emission cross section of ytterbium at 1064
nm; dz is the length of a mesh (1 cm); ( ) is the energy of the seed at the input
(output) of the nth mesh with ; and is the saturated energy density
which is Jsat=h/ . With this latter equation, we were able to compute the energy of the seed
pulse at each position of the fiber. Hereafter, we report on the comparisons between our model and our experimental results.
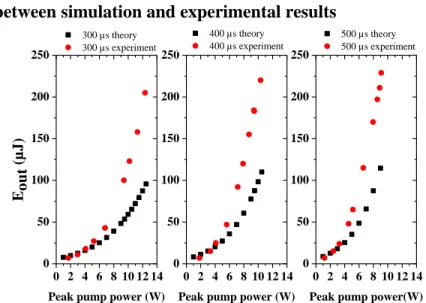
VI. Comparison between simulation and experimental results
0 2 4 6 8 10 12 14 0 50 100 150 200 250 Eo u t (µ J )
Peak pump power (W)
300 µs theory 300 µs experiment 0 2 4 6 8 10 12 14 0 50 100 150 200 250 500 µs theory 500 µs experiment 400 µs theory 400 µs experiment
Peak pump power (W)
0 2 4 6 8 10 12 14 0 50 100 150 200 250
Peak pump power(W)
Figure 7: Evolution of the energy of the amplified pulse versus the peak pump power and for the different durations of the pump pulse.
As evidenced in Figure 7, theoretical and experimental data are in disagreement. Figure 7 revealed that our simulations were always underestimated by at least a factor of 2 in the experimental results! This meant that our simulations neglected a major phenomenon. As already mentioned, the experimental data were recorded while the repetition rate of the microlaser was fixed at 1 kHz. Therefore, the experimental output pulse energy displayed in Figure 7 was computed according to the average power measured at the exit of the fiber. In practice, this meant that each millisecond, the fiber was pumped during 0.5 ms before the seed pulse was
injected. Our simulations were performed considering, first, that this phenomenon took place
once; and, second, neglecting the population that remained in the excited state when another pump pulse excited the amplifying fiber. In other words, our simulation neglected the transient
phenomena and, therefore, the transient evolution of the population of the Yb3+ excited state
towards its steady state value.
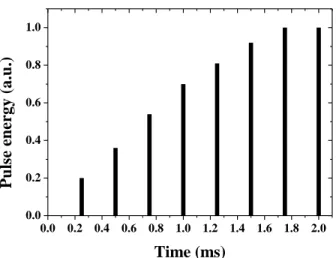
To demonstrate that, indeed, such transient states have to be considered, we recorded the evolution of the intensity of a pulse yielded during ~2 ms by the microlaser working at 4 kHz repetition rate while pumping the amplifying fiber with a pump pulse of ~2 ms. As shown in Figure 8, the pulses yielded by the microlaser were increasingly amplified as time went on. In fact, to account for this phenomenon, we also had to consider that both the pump and the input
pulse were way below the saturation density energy. Hence, after each amplification, many Yb3+
ions remained in their excited state. The latter had to be added to the population brought by the pump beam during the following pumping sequence.
0.0 0.2 0.4 0.6 0.8 1.0 1.2 1.4 1.6 1.8 2.0 0.0 0.2 0.4 0.6 0.8 1.0 P u ls e en er g y ( a .u .) Time (ms)
Figure 8: Temporal spectrogram of 8 amplified pulses injected in the fiber at 4 kHz repetition rate. The amplifying fiber is pumped at the time t=0 during 2 ms with 9 W of peak power.
To account for this transient behavior in our simulation, after the amplification of the
microlaser pulse, we introduced the natural decay of the Yb3+ that remained in the excited state
just after the amplification of the injected pulse. This decay stopped immediately upon the application of another QCW pump pulse. The excited population that was computed just prior to this was considered as the new starting point. Accordingly, we could readily compute the transient evolution that should be recorded. Figure 9 shows the plotted evolution of the energy of
a 6 µJ nanosecond pulse centered at =1064 nm as it propagates in the amplifying fiber when it
is seeded at a 1 kHz repetition rate. During each cycle and prior to seeding, the fiber is QCW
pumped during 500 µs by a laser diode centered at =915 nm with a peak power of 9 W. First,
we noticed that the steady state regime was reached for the eighth pulse; and second, that, in very good agreement with the discrepancies between the simulation and experimental results displayed in Figure 7, the first seeded pulse was about two times less amplified than the third one
(Fig. 9a). In our simulation, we considered that the steady state regime was reached when the
energy difference between two consecutive pulses was less than 5%. Figure 9b also showed that
state emitted at 1064 nm. Indeed, we noted that along the first 40 cm of the fiber, the available gain stocked in the fiber was higher. This observation indicated that the energy of the pulse injected in the fiber was too small compared to the saturation energy; therefore, it was too weak
to efficiently empty the population of the Yb3+ excited state level. Each millisecond, the
remaining energy that was stacked up within the fiber was added to the energy brought by the next pumping cycle. Figure 9b also made it possible to compare the energy stocked all along the fiber that was available for the first pulses and in the steady state regime. It clearly indicates that, in the steady state regime, at the entrance (resp. the exit) of the fiber, more energy is stored in the fiber. This latter phenomenon accounted for the increase in energy of the amplified pulse.
0 20 40 60 80 100 0 50 100 150 200 250 A m p li fi e d s e e d e n e r g y ( µ J )
Positon within the fiber (cm)
Pulse 1 Pulse 2 Pulse 3 Pulse 4 Pulse 5 Pulse 6 Pulse 7 Pulse 8 (a) 0 20 40 60 80 100 4.5 5.0 5.5 6.0 6.5 7.0 7.5 8.0 8.5 9.0 9.5 (b) Pulse 1 Pulse 2 Pulse 3 Pulse 4 Pulse 5 Pulse 6 Pulse 7 Pulse 8 S to r e d e n e r g y ( µ J /c m )
Positon within the fiber (cm)
Figure 9: a) Transient evolution of the energy of a 6 µJ, nanosecond pulse delivered at 1 kHz along a 110 cm long Yb3+ amplifying fiber. Each millisecond, the fiber is pumped during 500 µs by a 9 W peak power pump pulse centered at 915 nm. The nanosecond pulse is injected at z=0 in the fiber immediately after each pumping pulse. b) Associated evolution of the energy stored the fiber along the 110 cm fiber.
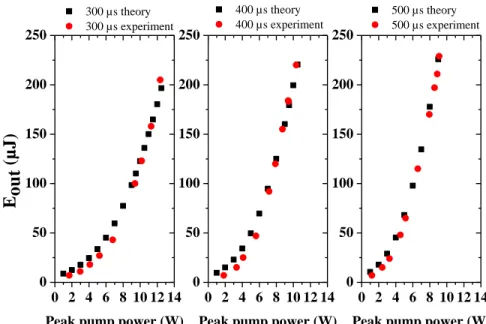
With this transient regime added to our simulations, the experimental and numerical results were in very good agreement (Fig. 10).
0 2 4 6 8 10 12 14 0 50 100 150 200 250 Eo u t ( µ J )
Peak pump power (W)
300 µs theory 300 µs experiment 0 2 4 6 8 10 12 14 0 50 100 150 200 250 500 µs theory 500 µs experiment 400 µs theory 400 µs experiment
Peak pump power (W)
0 2 4 6 8 10 12 14 0 50 100 150 200 250
Peak pump power (W)
Figure 10: Comparison between simulation and experimental data for different pump durations versus the peak pump power. The energy of the seed pulse is 6 µJ.
To further optimize the amplification within our fiber, we used our simulations to study the influence of the pump duration on the evolution of the output energy pulses in the transient regime. In Figure 11, we plotted the evolution of the energy of the first eight pulses exiting the fiber. The fiber was pumped at a repetition rate of 1 kHz by QCW delivered by a laser diode centered at 915 nm where the peak power was 9 W. After each QCW pumping sequence, a 6 µJ nanosecond pulse centered at 1064 nm was injected in the fiber.
0 1 2 3 4 5 6 7 0 50 100 150 200 250 E o u t ( µ J ) Pulse number 100 µs 200 µs 300 µs 400 µs 500 µs
Figure 11: Evolution of the energy of the amplified versus the duration of the pump pulse for a sequence of eight pulses. The pulses delivered at a repetition rate of 1 kHz are injected immediately after each cycle of pumping.
As expected, the amplified pulse energy increased with the pump pulse duration. The steady state regime was reached after about five pulses. This result was important for the characterization of time ignition of a combustion chamber.
VII. Nd:YAG crystal amplification stage
Once the pre-amplified seed pulse was guided close to the combustion chamber, it needed to be further amplified in order to reach the energy ignition threshold and the breakdown threshold power density. As previously mentioned, the peak power required to induce a plasma ranged between 0.1 and 1 MW. To deliver nanosecond pulses with both adequate peak power and energy, we developed another amplification stage. It had to be inserted in the close vicinity of the combustion chamber; therefore, it would have to deal with relatively large temperature changes and high vibration constraints. To design a compact system, we used a double-pass
amplification stage. The chosen amplifying medium was a 10 mm long Nd:YAG rod crystal
doped at 0.6% with a diameter of 4 mm.
This crystal that had a lower quantum defect (~0.76) compared to Yb3+ fiber (~0.89),
behaved like a four-level system. Therefore, it was noticeably less sensitive to temperature variations. The radiative lifetime of the exited state was independent of temperature but
depended on the concentration of Nd3+ ions. It was ~230 µs for 1% concentration and decreased
to 150 µs for 2% [34]. Therefore, in order to store a maximum of energy in the Nd:YAG rod, we chose to fix the concentration to 0.6% and to pump it in a QCW regime. Contrary to its excited
state lifetime, the emission cross section of Nd:YAG at =1064 nm—hereafter labeled as
em(1064nm)—decreased as the temperature increased [35,36]. A simple empiric law made it
em(1064 nm)(T)= (-3.9 10-22 T + 3.445 10-19) cm-2 (7)
Hence, if the temperature increases from 300 K to 450 K, em(1064 nm) decreases by
~26%. It was noted that, simultaneously, the absorption cross section of this crystal at =808 nm
increased [36]. Therefore, the latter phenomena could partly compensate for the decrease of
em(1064 nm) with temperature. Moreover, the amplification spectral width of Nd:YAG at
=1064 nm was relatively small. This was useful in our system since all the ASE centered at
=1030 nm produced in the fiber amplifier could not be further amplified in Nd:YAG.
Furthermore, it should be noted that the peak of emission cross-section band shifted with temperature. The latter phenomenon, which resulted in the decrease of amplification gain, was also partly compensated by the temperature increase of the amplification bandwidth [37]. Regarding the vibration constraints, it is important to underline that the small dimension of our amplifying crystal increased the vibration modes to higher frequencies and limited their amplitudes to ensure a weaker sensitivity to the latter parameter. Hence this crystal presented many advantages for our particular application.
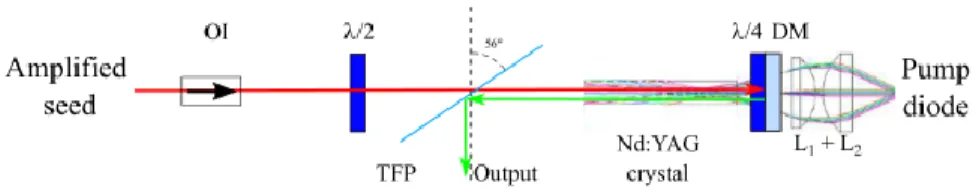
Figure 12: Design of the Nd:YAG amplifier. The seed beam in red (green) is p (s) polarized. /2: half-wave plate;
/4: quarter-wave plate; DM: dichroic mirror; OI: optical isolator; TFP: thin film polarizer.
The design of our double-pass amplifier is depicted in Figure 12. At the exit of the fiber amplifier, the beam collimated to a diameter of ~800 µm; it was sent through an optical isolator (OI) and entered the amplification stage where its size was kept constant. To ensure an optimal
transmission of the pre-amplified seed pulse, a /2 plate was inserted in between the collimator and the OI. Then, the linearly polarized seed pulse passing through the thin film polarizer (TFP) was amplified. After a first pass in the Nd:YAG crystal, the polarization of the seed pulse was
rotated by /2 by means of the /4 plate and was back reflected by a high reflection DM. After
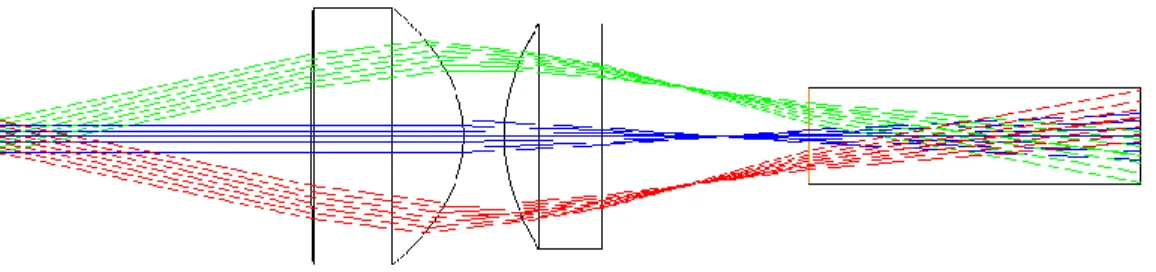
its second pass in the Nd:YAG crystal, the beam was reflected by the TFP and was focused in the combustion chamber by an aspheric short focal lens. The DM reflected more than 99% of the signal pulse and transmitted more than 80% of the beam delivered by the pump, a DILAS QCW 800 µm fiberized diode laser centered at 808 nm. The duty cycle of this diode was 2%. To prevent the occurrence of any thermal effect induced by optical pumping of the Nd:YAG rod, we decided to fix the pumping repetition rate at 10 Hz. To optimize the amplification process within the crystal, we had to optimize both the focusing of the pump pulse within the crystal and its spatial overlap with the seed beam. Therefore, good imaging with a very compact optical system of the output of the multimode 800 µm the pump fiber in the Nd:YAG rod was rather difficult but important. The imaging system was computed with ZEMAX. It was made of two antireflection coated aspherical lenses with 8 mm and 13.5 mm focal length. As depicted in Figure 13, the pump beam was gently focused to a minimum size of 920 µm within the crystal. This pump beam size changed by less than 10% over 90% of the length of the crystal. It was slightly larger than the seed beam size (~800 µm).
Figure 13: Simulation of the focusing performed by the two lenses within the Nd:YAG crystal of the pump beam delivered by the 800 µm optical fiber.
This system was design to be very compact: the distance between the output of the pumping fiber and the DM was ~7 mm. The DM, the quarter-wave plate, and one of the end surfaces of the crystal were almost in contact. To compute the pulse energy after single and
double passes in the Nd:YAG crystal, we used Eq. (6) where the parameters (Jsat, ) of a
Nd:YAG crystal doped at 0.6% were considered.
0.0 0.2 0.4 0.6 0.8 1.0 0 10 20 30 40 50 In v e r si o n o f p o p u la ti o n ( in % ) z (cm) without seed after single pass after double pass
Peak pump power=400 W
(a) 0.0 0.2 0.4 0.6 0.8 1.0 0 2 4 6 8 10 12 14 P u ls e E n e r g y ( m J ) z (cm)
Peak pump power=100 W Peak pump power=200 W Peak pump power=300 W Peak pump power=400 W
(b)
Figure 14: a) Evolution of population inversion within the Nd:YAG crystal for a pump peak power of 400 W. b) Evolution of pulse energy within the Nd:YAG crystal versus the peak pump power.
Typical results of our simulation are depicted in Figure 14. In this simulation, we considered that 350 µJ pulses delivered by the fiber amplifier were injected in a 10 mm long Nd:YAG crystal with a diameter of 4 mm. Prior to amplification, the latter was considered to be homogenously pumped at 808 nm during 250 µs by a pump contra-propagating with respect to the injected nanosecond pulse. In these latter simulations, the pump repetition rate was fixed at 10 Hz. Due to the fast relaxation time of the excited state (~250 µs), we considered that the steady state regime of this amplifier was immediately reached. To compute the evolution of the population inversion, the pump beam profile computed with software ZEMAX was considered. The evolution of the inverted population indicated that an inversion of ~45% with 400 W pump power could be reached (Fig. 14a). Figure 14b presents the evolution of the pulse energy during
its propagation within the Nd:YAG rod, for the first and second amplification pass versus the pump power. 0 100 200 300 400 0 2 4 6 8 10 12 Eo u t( m J )
Peak pump power (W)
Figure 15: Evolution of the pulse energy at the exit of the double pass Nd:YAG amplifier versus the peak pump power. The insert shows the spatial profile of the amplified beam.
Figure 15 displays the beam profile and the experimental evolution of the output pulse energy of our double-pass amplifier versus the peak power of the pump pulse when the energy of pre-amplified nanosecond seed pulse was 350 µJ. Here again, we used a home-made
synchronization electronic device that insured the Yb3+ doped fiber and the Nd:YAG rod were
pumped during 500 µs and 250 µs, respectively, prior to being injected by the pulse delivered by the microchip laser. This device also made it possible to separately control the repetition rate of
the Yb3+ fiber and the Nd:YAG rod amplifier. In the data displayed in Figure 15 the Yb3+ fiber
and Nd:YAG amplifier were pumped at 1 kHz and 10 Hz, respectively. We noticed that the output pulse energy increased almost linearly versus the peak pump power, which reached up to 11 mJ for 400 W of peak pump power (Fig. 15). This indicated an optical (pump) to optical (seed) conversion efficiency of 11%. The numerical and experimental data presented in
Figure 14b and Figure 15 agree well, indicating that with our simulations we were able to capture the most important trend of this amplification stage.
0 100 200 300 400 0 2 4 6 8 10 12 Eo u t( m J )
Energy of the injected pulse (µJ)
Figure 16: Energy of the amplified pulse versus the energy of the injected pulse for a constant peak pump power of 400 W.
Figure 16 displays the evolution of the output pulse energy delivered by the double pass amplifier versus the energy of the pulses delivered by the fiber amplifier when the peak power of the pump beam is fixed at 400 W. We noted that the output pulse energy increased almost linearly with the injected pulses energy. However, as the input pulse energy increased, the factor of amplification in energy decreased from ~50 to ~25. Since the intensity of the pulse was far
below the saturation intensity in Nd:YAG (Jsat=0.6 J cm-2), we attributed this behavior to
phenomena occurring in the fiber amplifier when the pulse energy was over 250 µJ, which was
related partly to polarization instabilities and partly to the increase of ASE at =1030 nm, which
both increased when the energy of the seeding pulses increased. Indeed, as we increased the energy of the injected pulse, the contribution of ASE became less negligible and could not be perfectly corrected. Moreover, the polarization instabilities affected the input energy of the seed
pulse, which was transmitted by the thin film polarizer and amplified in the Nd:YAG rod. We also did not record any significant change of the amplified pulses duration that remained about
=1.33±0.05 ns. The polarization ratio of the beam was better than 100:1.
This whole set of data indicated that the Nd:YAG amplifier that we designed complied with our experimental requirements: a very compact system that delivered a nanosecond pulse
with energy higher than 10 mJ and a beam profile with an M2<1.5. It confirmed that the
combination of Yb3+ amplifying fiber and compact double pass Nd:YAG bulk amplifiers was
well adapted for our application.
VIII. Laser-induced plasma generation and ignition of a combustion chamber
An interesting review of laser ignition phenomena can be found in the literature [3,4]. Ignition of aeronautic combustion engines is usually realized using conventional spark plugs. The spark plug is inserted in a metallic jacket and fixed on the combustion chamber. The anode and cathode of the spark plug are located in the near surface of the combustion chamber. Therefore, when the spark plug is powered, the electrical sparks are produced near the surface of the combustion chamber, which is drilled with hundreds of holes through which flows compressed air. This air flow ensures the efficient cooling of the surface of the combustion chamber as well as the anode and cathode of the spark plug. However, when the combustion chamber is at full power, the air flow near its surface prevents a good interaction between the electric spark and the fuel. Hence, at the full regime, this phenomenon strongly impacts the probability of re-ignition of the engine. This problem can be overcome using laser ignition by focusing the laser pulse a few centimeters away from the surface of the combustion chamber. Moreover, the combustion chamber can be ignited at positions where optimal ignition conditions may be found. To do so, we removed the conventional spark plug and replaced it with a hollow
cylindrical metallic tube on which a sapphire lens was fixed. The diameter of the lens was limited to 8 mm by the diameter of the metallic jacket of the spark plug. Antireflection-coated sapphire lenses with different focal lengths ranging from 20 mm to 7.5 mm were tested. The beam delivered by the Nd:YAG amplifier was directly injected into the metallic tubing containing the focusing lens. For pulse energies larger than 1.5 mJ, we could easily record the creation of plasma in air with all the lenses we tested. The typical plasma generated by a 2.5 mJ nanosecond pulse focused by a 7.5 mm focal lens is displayed in Figure 17.
Figure 17: Image of plasma created in the air by a 2.5 mJ pulse focused by a lens of 7.51 mm. The pulse propagates from the right to the left. The plasma is induced near the lens.
Finally, we tested this amplifying system on a combustion chamber prototype developed at the Office National d'Etudes et de Recherches Aérospatiales (ONERA). The experiment was carried out at an atmospheric pressure using the experimental combustion chamber previously described [38]. The fuel/air mixture of 2.1 was injected during 5 seconds in the chamber. When focusing a 10 mJ pulse produced by our system in the combustion chamber with a 10 mm focal lens, we achieved successful ignition. Under this experimental condition, we found that the probability of ignition was 20% for 10 mJ and it rapidly reached 27% as the pulse energy was increased to 11 mJ. The details of these experiments and the different parameters we explored to
improve the ignition of this experimental combustion chamber will be presented in a forthcoming paper.
IX. Conclusion
We studied and developed a compact nanosecond laser system dedicated to the ignition of combustion engines. This system was based on a nanosecond microchip laser that was injected into two successive amplifiers. The first amplification stage was a YDFA working in a
QCW mode. At a 1 KHz repetition rate, it delivered TEM00 and linearly polarized nanosecond
pulses with a duration of ~1 ns, centered at 1064 nm with energies up to 350 µJ. These results were in very good agreement with the model we specially designed for the pulsed-pump regime. This model was also able to compute the transient state that occurred for the early pulses, which was crucial to enable the design of a lasing ignition device. The second amplification stage was based on a compact Nd:YAG double pass amplifier pumped by a 400 W QCW diode coupled to a 800 µm multimode fiber. At a 10 Hz repetition rate, this system was able to amplify the pulse delivered by the YDFA up to 11 mJ while preserving its beam profile, polarization ratio, and pulse duration.
Finally, we demonstrated that this compact nanosecond system could ignite an experimental combustion chamber. This work offers many prospects that we are now investigating. One is directly related to the increase in the energy of the pulse delivered by the Nd:YAG amplifier as well as the increase in its repetition rate. Another interesting prospect is related to the transient regimes described in this paper. One important problem in the ignition of aeronautic engines is related to the creation of a core combustion that satisfies the Ballal and Lefebvre criterion [39], which indicates that a combustion core can only ignite the chamber
when its decrease in temperature, induced during its expansion, is compensated by a temperature increase induced by combustion. Under this criterion, a too-small combustion core cannot survive. To circumvent this problem, the use the picket-fence strategy proposed for ignition of plasma fusion can be envisioned [40]. A short and intense pulse creates hot plasma, which is subsequently stabilized and heated by a sequence of less powerful pulses. Prior to the injection of a pulse sequence produced by the microlaser, the fiber amplifier and the Nd:YAG rod need to be pumped. Upon injection of the pulse sequence in the amplifiers, the first pulse within the pulse sequence produced by the microlaser will be strongly amplified while the subsequent pulses will be less amplified, but will take advantage of the remaining population inversion within these amplifiers. While less intense, these laser pulses should be absorbed by the plasma generated by the first laser pulse heat; therefore, they will contribute to its stabilization. This strategy has already been explored for automotive combustion engines by different authors [7, 41].
Acknowledgments
This project was partly financed by the French National Research Agency (ANR) under the project ECLAIR, the Conseil Régional d'Aquitaine under the project ParaSources. We thank the center Alphanov for the technical help they provided to us at the beginning of this project.
References
1. M.H. Morsy, “Review and recent developments of laser ignition for internal combustion engines applications,” Renewable and Sustainable Energy Reviews 16(7), 4849-4875 (2012).
2. J.D. Dale, M.D. Checkel and P.R. Smy, “Application of high energy ignition systems to engines Progress,” Energy and Combustion Science 23(5), 379-398 (1997).
3. M. Weinrotter, H. Kopecek, E. Wintner, “Laser ignition of engines, ” Laser Physics, 15 (7), 947-953 (2005).
4. S. A. O’Briant, S. B. Gupta and S. S. Vasu, “Review: Laser ignition for aerospace propulsion, ” Propulsion and Power Research 5, 1–21 (2016)
5. T. X. Phuoc “Laser-induced spark ignition fundamental and applications,” Opt. Lasers Eng. 44(5), 351-397 (2006)
6. R. Tambay, and R. K. Thareja, “Laser induced breakdown study of laboratory air at 0.266, 0.355, 0.532, and 1.06 µm,” J. Appl. Phys. 70, 2890-2892 (1991)
7. S. Lorenz, M. Bärwinkel, R. Stäglich, W. Mülbauer and D Brüggeman, “Pulse train ignition with passively Q-switched laser spark plugs, ” International Journal of Engine Research 17, 139-150 (2016)
8. D. K. Srivastava, E. Wintner, and A.K. Agarwal, “Effect of focal size on the laser ignition of compressed natural gas fueled engine,” Opt. Lasers Eng. 58, 67-79 (2014). 9. D.K. Srivastava, E. Wintner, and A.K. Agarwal “Effect of laser pulse energy on the laser
ignition of compressed natural gas fueled engine,” Opt. Eng. 53(5), 056120 (2014). 10. H. Kofler, J. Tauer, G. Tartar, K. Iskra, J. Klausner, G. Herdin, and E. Wintner, “An
innovative solid-state laser for engine ignition,” Laser Phys. Lett. 4(4), 322–327 (2007). 11. H. Sakai, H. Kan, and T. Taira, “>1 MW peak power single-mode high-brightness
passively Q-switched Nd3+:YAG microchip laser,” Opt. Express 16(24), 19891–19899
(2008).
12. M. Tsunekane, T. Inohara, A. Ando, N. Kido, K. Kanehara, and T. Taira, “High peak power, passively Q-switched microlaser for ignition of engines,” IEEE J. Quantum Electron. 46(2), 277–284 (2010).
13. N. Pavel, M. Tsunekane, and T. Taira, “Composite, all-ceramics, high-peak power
Nd:YAG/Cr4+:YAG monolithic micro-laser with multiple-beam output for engine
14. S. Lorenz, M. Bärwinkel, P. Heinz, S. Lehmann, W. Mühlbauer, and D. Brüggemann, “Characterization of energy transfer for passively Q-switched laser ignition,” Opt. Express 23(3), 2647–2659 (2015).
15. C. Manfletti, and G. Kroupa, "Laser ignition of a cryogenic thruster using a miniaturised Nd:YAG laser," Opt. Express 21(s. 6), A1126-A1139 (2013)
16. Y. Ma, X. Li, X. Yu, R. Fan, R. Yan, J. Peng, X. Xu, R. Sun, and D. Chen, “A novel miniaturized passively Q-switched pulse-burst laser for engine ignition,” Opt. Express
22(20), 24655–24665 (2014).
17. Y. Ma, Y. He, X. Yu, X. Li, J. Li, R. Yan, J. Peng, X. Zhang, R. Sun, Y. Pan, and D. Chen, “Multiple-beam, pulse-burst, passively Q-switched ceramic Nd:YAG laser under micro-lens array pumping,” Opt. Express 23(19), 24955–24961 (2015).
18. T. Dascalu, and N. Pavel, “High-temperature operation of a diode-pumped passively
Q-switched Nd:YAG/Cr4+ :YAG laser,” Laser Phys. 19(11), 2090–2095 (2009).
19. N. Pavel, T. Dascalu, G. Salamu, M. Dinca, N. Boicea and A. Birtas, « Ignition of an
automobile engine by high-peak power Nd:YAG/Cr4+:YAG laser-spark devices ,» Opt.
Express 23(26), 33028-33037 (2015)
20. C. Jauregui, J. Limpert, and A. Tünnermann, “High-power fiber lasers,” Nature Photonics 7, 861–867 (2013).
21. T. Theeg , C. Ottenhues, H. Sayinc, J. Neumann, and D. Kracht, “Core-pumped single-frequency fiber amplifier with an output power of 158 W” Opt. Lett 41(1), 9-12 (2016). 22. L. Lago, D. Bigourd, A. Mussot, M. Douay and E. Hugonnot, "High-energy temporally
shaped nanosecond-pulse master-oscillator power amplifier based on ytterbium-doped single-mode microstructured flexible fiber," Opt. Lett. 36(5), 734-736 (2011).
23. C.D. Brooks and F. Di Teodoro, “1 mJ energy, 1 MW peak-power, 10 W average power, spectrally narrow, diffraction-limited pulses from a photonic-crystal fiber amplifier,” Opt. Express 13(22), 8999-9002 (2005).
24. F. Di Teodoro, P; Belden, P. Ionov and N. Werner, “High-power ns-pulse fiber laser sources for remote sensors,” Opt. Fiber Technol. 20(6), 688–693 (2014).
25. F. Stutzki, F. Jansen, A. Liem, C. Jauregui, J. Limpert and A. Tünnermann, “26 mJ, 130 W Q-switched fiber-laser system with near-diffraction-limited beam quality,” Opt. Lett.
37(6), 1073-1075 (2012).
26. G.P. Agrawal, “Nonlinear fiber optics,” Fifth edition. ed. Elsevier/Academic Press, Amsterdam. (2013)
27. J-P. Fève, P.E. Schrader, R.L. Farrow, and D.A.V. Kliner, “Four-wave mixing in nanosecond pulsed fiber amplifiers,” Opt. Express 15(8), 4647-4662 (2007).
28. H. Zhang, R. Tao, P. Zhou, X. Wang, and X. Xu, “1.5-kW Yb-Raman combined nonlinear fiber amplifier at 1120 nm,” IEEE Photonics Technol. Lett. 27(6), 628-630 (2015).
29. C.J. Koester and E. Snitzer, “Amplification in a fiber laser,” Appl. Opt. 3(10), 1182-1186 (1964).
30. C.R. Giles and E. Desurvire, “Modeling Erbium-doped fiber amplifiers,” J. Lightwave Technol. 9(2), 271-283 (1991).
31. Y. Wang, “Optimization of pulse amplification in Ytterbium-doped double-clad fiber amplifiers,” J. Lightwave Technol. 23(6), 2139- (2005).
32. A.E. Siegman, “Laser pumping and population inversion,” in Lasers (Academic, 1986), pp. 243-263.
33. F. Estable, , “amplification régénérative et multipassage d’impulsions lumineuses dans des milieux solides (YAG dopé néodyme, alexandrite, saphir dopé titane). » PhD Thesis, Université Paris Sud – Paris XI (1992). HAL Id : pastel-00716147, version 1
34. J. Dong, A. Rapaport, M. Bass, F. Szipocs and K. Ueda, “Temperature-dependent stimulated emission cross section and concentration quenching in highly doped
Nd3+:YAG crystals,” Phys. Status Solidi A 202, 2565–2573 (2005).
35. A. Rapaport, S. Zhao, G. Xiao, A. Howard and M. Bass, “Temperature Dependence of the 1.06 µm stimulated emission cross section of neodymium in YAG and in GSGG,” Appl. Opt. 41(33), 7052-7057 (2002).
36. Y. Sato and T. Taira, “Temperature dependencies of stimulated emission cross section for Nd-doped solid-state laser materials, ” Opt. Mater. Express 2(8), 1076-1087 (2012). 37. N. Pavel, M. Tsunekane and T. Taira, “Enhancing performances of a passively
Q-switched Nd:YAG/Cr4+ :YAG microlaser with a volume Bragg grating output coupler,
” Opt. Lett. 35(10), 1617-1619 (2010).
38. G. Linassier, A. Bruyat, Ph Villedieu, N. Bertier, C. Laurenta, O. Rouzaud, R. Lecourt,
H. Verdier and G. Lavergne, “Application of numerical simulations to predict aircraft combustor ignition, ” C. R. Mecanique 341, 201–210 (2013)
39. A. Ballal and A.H. Lefebvre, “Flame propagation in heterogeneous mixtures of fuel droplets, fuel vapor and air,” in Eighteenth Symposium (International) on combustion vol. 18(1), 1737-1747 (1981).
40. J.E. Rothenberg, “Ultrafast picket fence pulse trains to enhance frequency conversion of shaped inertial confinement fusion laser pulses,” Appl. Opt. 39(36), 6931-6938 (2000). 41. C. Dumitrache, A.P. Yalin, and M. N. Shneider, “Laser generated plasma using a dual
pulse approach with application to laser ignition,” 45th AIAA Plasmadynamics and Lasers Conference, AIAA Aviation