HAL Id: hal-00296358
https://hal.archives-ouvertes.fr/hal-00296358
Submitted on 16 Oct 2007
HAL is a multi-disciplinary open access
archive for the deposit and dissemination of
sci-entific research documents, whether they are
pub-lished or not. The documents may come from
teaching and research institutions in France or
abroad, or from public or private research centers.
L’archive ouverte pluridisciplinaire HAL, est
destinée au dépôt et à la diffusion de documents
scientifiques de niveau recherche, publiés ou non,
émanant des établissements d’enseignement et de
recherche français ou étrangers, des laboratoires
publics ou privés.
peroxy nitrate abundances and speciation at Mount
Bachelor Observatory during INTEX-B
G. M. Wolfe, J. A. Thornton, V. F. Mcneill, D. A. Jaffe, D. Reidmiller, D.
Chand, J. Smith, P. Swartzendruber, F. Flocke, W. Zheng
To cite this version:
G. M. Wolfe, J. A. Thornton, V. F. Mcneill, D. A. Jaffe, D. Reidmiller, et al.. Influence of trans-Pacific
pollution transport on acyl peroxy nitrate abundances and speciation at Mount Bachelor Observatory
during INTEX-B. Atmospheric Chemistry and Physics, European Geosciences Union, 2007, 7 (20),
pp.5309-5325. �hal-00296358�
www.atmos-chem-phys.net/7/5309/2007/ © Author(s) 2007. This work is licensed under a Creative Commons License.
Chemistry
and Physics
Influence of trans-Pacific pollution transport on acyl peroxy nitrate
abundances and speciation at Mount Bachelor Observatory during
INTEX-B
G. M. Wolfe1, J. A. Thornton2, V. F. McNeill2,*, D. A. Jaffe2,3, D. Reidmiller2, D. Chand3, J. Smith3,**, P. Swartzendruber2, F. Flocke4, and W. Zheng4,5
1Chemistry Department, University of Washington, Seattle, WA, USA
2Atmospheric Sciences Department, University of Washington, Seattle, WA, USA
3Interdisciplinary Arts and Sciences Department, University of Washington, Bothell, WA, USA 4Atmospheric Chemistry Division, National Center for Atmospheric Research, Boulder, CO, USA
5Cooperative Institute for Research in Environmental Sciences, University of Colorado, Boulder, CO, USA *now at: Department of Chemical Engineering, Columbia University, New York, NY, USA
**now at: UNAVCO, Boulder, CO, USA
Received: 4 June 2007 – Published in Atmos. Chem. Phys. Discuss.: 28 June 2007 Revised: 10 September 2007 – Accepted: 8 October 2007 – Published: 16 October 2007
Abstract. We present month-long observations of speciated
acyl peroxy nitrates (APNs), including PAN, PPN, MPAN, APAN, and the sum of PiBN and PnBN, measured at the Mount Bachelor Observatory (MBO) as part of the INTEX-B collaborative field campaign during spring 2006. APN abun-dances, measured by thermal dissociation-chemical ioniza-tion mass spectrometry (TD-CIMS), are discussed in terms of differing contributions from the boundary layer (BL) and the free troposphere (FT) and in the context of previous APN measurements in the NE Pacific region. PAN mixing ratios range from 11 to 3955 pptv, with a mean value of 334 pptv for the full measurement period. PPN is linearly correlated with PAN (r2=0.96), with an average abundance of 6.5% rel-ative to PAN; other APNs are generally <1% of PAN. Diur-nal cycles and relationships of APNs with ozone reveal a gra-dient in hydrocarbon chemistry between the BL and the FT. On average, levels of APNs, ozone and PPN/PAN are sub-stantially higher in FT air relative to BL air, suggesting that this site is strongly influenced by distant pollution sources. To estimate the impact of long-range transport of Asian pol-lution on atmospheric composition at MBO, we perform a detailed analysis utilizing HYSPLIT back trajectories. This analysis suggests that trans-Pacific transport of Asian pollu-tion leads to substantial increases in APN and ozone mix-ing ratios at MBO, especially when transport occurs via the free troposphere. The ensemble of trajectories indicate that
Correspondence to: J. A. Thornton
(thornton@atmos.washington.edu)
Asian-influenced free tropospheric air was sampled in ∼16% of our data and contained a median PAN mixing ratio double that of the full dataset.
1 Introduction
Rapid economic growth in Asia over the past 30 years has lead to a substantial increase in emissions of particulate and gas-phase pollutants in that region, including nitrogen oxides (NOx≡NO+NO2), sulfur dioxide (SO2)and carbon
monox-ide (CO) (Elliot et al., 1997; van Aardenne et al., 1999; Streets et al., 2001). NOx emissions can alter the
oxidiz-ing capacity of the troposphere through the catalytic produc-tion of ozone, a primary daytime source of OH. Models sug-gest that global tropospheric ozone has increased by 30 to 60% over the last century as a result of anthropogenic activi-ties (Wang and Jacob, 1998; Lamarque et al., 2005), becom-ing a significant component of anthropogenic greenhouse cli-mate forcing (Shindell et al., 2006) and reducing agricultural yields (Chameides et al., 1999; Wang et al., 2005). NOxmay
also contribute to ecosystem eutrophication and soil acidifi-cation through formation of nitric acid (HNO3)and
subse-quent deposition (Goulding et al., 1998). Emissions of NOx
in East Asia doubled between 1985 and 1997 (Streets et al., 2001) and are projected to more than double again by 2020 in the absence of improved mitigation strategies (van Aar-denne et al., 1999). It has also been suggested that boreal
climate warming may exacerbate Siberian forest fires (Jaffe et al., 2004), further enhancing emissions of NOxand other
combustion byproducts over Eurasia.
Rising Asian industrial and biomass burning emissions have the potential to impact atmospheric composition over western North America. Long-range transport (LRT) of pol-lution from the Asian continental boundary layer tends to be strongest in the spring, when warm conveyor belts and oc-casional deep convection events associated with East Asian cyclones loft polluted air masses into the free troposphere (FT), where they are rapidly (5 to 10 days) carried to the Northwestern U.S. by westerly winds (Bey et al., 2001; Cooper et al., 2004; Liang et al., 2004). Modeling studies estimate that polluted air transported from Asia may con-tribute 4–7 ppbv to the ozone background over the North Pacific Ocean (Berntsen et al., 1999) and continental U.S. (Fiore et al., 2002). Jacob et al. (1999) projected that future increases in Asian anthropogenic emissions may enhance springtime surface ozone levels by 1–3 ppbv over western North America despite domestic reductions of ozone precur-sor emissions. These predictions are supported by a num-ber of ground and aircraft measurements throughout the NE Pacific region, which point toward a significant and grow-ing LRT influence on ozone concentrations both episodically (Jaffe et al., 2003a; Bertschi et al., 2004; Hudman et al., 2004; Nowak et al., 2004; Weiss-Penzias et al., 2006) and in the background (Parrish et al., 1992; Jaffe et al., 2003b, 2004). When combined with stagnant mixed layer conditions and increased background O3levels from regional pollution
sources, such enhancements can lead to non-attainment of U.S. EPA ozone standards (Fiore et al., 2002; Jaffe et al., 2004). It has been argued that rising ozone levels in the NE Pacific region are due partly to changes in the springtime ozone photochemical tendency (lower destruction rate) as a result of increasing NOxabundances (Yienger et al., 1999;
Kotchenruther et al., 2001b; Parrish et al., 2004); however, we currently lack the long-term measurements of NOx and
its reservoirs in this region to adequately test models. NOxhas a relatively short lifetime (∼1 day) in the
tropo-sphere, thus its transport far from source regions is largely determined by the formation of insoluble reservoir species (Crutzen, 1979), such as peroxyacetyl nitrate (PAN) and its homologues, to which we refer collectively as acyl peroxy nitrates (APNs). APNs are formed during the photochemi-cal oxidation of volatile organic compounds (VOCs) in the presence of NOx:
RC(O)OO + NO2→RC(O)OONO2 (APN) (1) The structure of the “R” group is dependent on the organic precursor. PAN (R=CH3)is the most abundant APN,
hav-ing both anthropogenic and biogenic precursor sources. The equilibrium in Eq. (1) is highly dependent on temperature; for example, the pseudo-first order lifetime of PAN is greater than 1 month at 258 K but less than 1 h at 298 K. In the
lower troposphere, PAN is lost primarily through thermal de-composition followed by reaction of the peroxy radical with NO or other peroxy radicals; photolysis is the dominant loss mechanism above 7 km (τPAN∼3 weeks), while oxidation by
OH and ozone represents a minor loss pathway throughout the troposphere for all but unsaturated APNs (Talukdar et al., 1995). The thermal stability of APNs in the free troposphere provides a pathway for the transport of NOx from Asian
source regions to remote areas, where subsidence-induced warming and subsequent thermal decomposition of APNs re-leases NOx(Singh et al., 1986; Moxim et al., 1996; Yienger
et al., 1999).
Connecting increasing NOxemissions in Asia to enhanced
ozone production in the NE Pacific region is currently limited by the availability of observations. APNs (predominantly PAN) can compose 60 to 80% of total reactive nitrogen (NOy)in air parcels influenced by Asian pollution (Roberts
et al., 2004). Parrish et al. (2004) have noted that PAN levels may be increasing in the NE Pacific marine boundary layer (MBL), based on observations made during several indepen-dent field campaigns over the last two decades. The apparent rise is consistent with increasing East Asian NOxemissions,
suggesting a growing influence of Asian pollutants on pho-tochemistry near the surface. Few studies have attempted to assess the impacts of LRT on the composition of the conti-nental FT, even though the injection of NOxinto the remote
FT–where ozone production is NOxlimited–has the potential
to significantly alter ozone production chemistry (Moxim et al., 1996; Kotchenruther et al., 2001b; Hudman et al., 2004). As part of the Intercontinental Chemical Transport Exper-iment (INTEX-B) in spring 2006, a suite of chemical and meteorological measurements were made at Mount Bache-lor Observatory (MBO), a ground-based research site in cen-tral Oregon that allows routine sampling of FT air (Jaffe et al., 2005; Weiss-Penzias et al., 2006). This paper presents observations of a range of APNs, including PAN, per-oxypropionyl nitrate (PPN, R=CH3CH2),
peroxymethacry-loyl nitrate (MPAN, R=CH2C(CH3)), peroxyacryloyl nitrate
(APAN, R=CH2CH), and the sum of peroxy-n-butyryl
ni-trate (PnBN, R=CH3CH2CH2)and peroxyisobutyryl nitrate
(PiBN, R=(CH3)2CH), made between 11 April and 14 May
2006 at MBO. First, we discuss the behavior and speciation of APNs in terms of differing contributions from surface and FT air. Next, we utilize relationships between APNs, ozone and water vapor to diagnose the effect of air mass origin and history on APN abundances. Finally, we perform an ensem-ble trajectory analysis to estimate the contribution of LRT of Asian pollution to APN and ozone abundances at MBO. We conclude that FT transport of Asian pollution and subsequent subsidence over western North America can significantly al-ter ozone photochemistry at high-altitude locations.
Σ Σ Σ Σ !" ! α ! !" ! # ! $$ % &%'( )* % +$ , -( % . / , , 0 1 # $
Fig. 1. (a) TD-CIMS instrument schematic. (b) Representative TD-CIMS mass spectrum obtained at MBO. Note the logarithmic scale above 300 counts s−1. The signal at m/z=59 corresponds to ∼850 pptv of PAN.
2 Methods
2.1 Site description and sampling
The MBO site (43.979◦N, 121.687◦W, 2763 m above sea level (a.s.l.)) has been described in detail pre-viously (Weiss-Penzias et al., 2006); a map of the surrounding area is provided as supplemental ma-terial (http://www.atmos-chem-phys.net/7/5309/2007/ acp-7-5309-2007-supplement.pdf). The mountain itself is snow-covered through summer and the upper half is above tree line, whereas the surrounding area is predominantly coniferous forest. The Mount Bachelor Ski Resort is located on the east face, and the closest populated areas are Bend (pop. 65 210) at 31 km to the east and Redmond (pop. 21 109) at 53 km to the northeast, both of which are located along a U.S. highway (Rt. 97) that runs north-south and approaches to within 25 km east of Mt. Bachelor. Prevailing winds were northwesterly on average during the campaign but ranged from southwesterly to northeasterly, which is a broader range than reported for previous studies at MBO (Jaffe et al., 2005; Weiss-Penzias et al., 2006); thus, there may be some potential for influence from local pollution sources during spring 2006.
A variety of measurements were made at MBO during INTEX-B; a detailed discussion of the instrumentation and
methodology may be found elsewhere (Weiss-Penzias et al., 2006). For analysis of the APN data, we employ 5-min and 60-min averages of ozone, water vapor, sub-micron parti-cle light scattering, carbon monoxide and gaseous elemental mercury; these measurements are summarized in Table 1. A common sampling inlet, located 15 m above the instrument room, was used to draw ambient air at a rate of 20 slpm from the sampling tower through 15 m of 3/8′′OD PFA tubing to a gas distribution manifold shared by the CO, O3and APN
in-struments; the Hg and scattering instruments employed sep-arate inlets. From the manifold, 2 slpm were pulled through 5 m of 1/4′′ OD PFA tubing to the APN instrument,
result-ing in an average residence time of 2 s for transit from the inlet tower to the APN instrument. APN loss due to thermal decomposition during transit should be minimal (<0.1%). 2.2 Measurement of APNs
A custom-built thermal-dissociation chemical ionization mass spectrometer (TD-CIMS) was employed to detect APNs; the technique is similar to those of Villalta and Howard (1996) and Slusher et al. (2004). Figure 1a illus-trates the instrument and sampling system. Sample air is pulled at 2 slpm through a heated inlet consisting of a 17 cm length of 1/2′′OD PFA tubing maintained at 160–180◦C. A coupled chemistry-heat transfer model indicates a final axial gas temperature of 145◦C and dissociation of >99% of PAN
Table 1. Observations used in APN analysis.
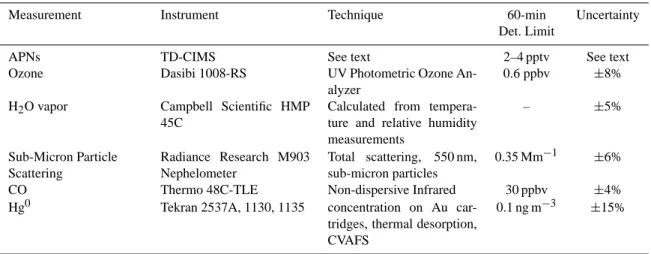
Measurement Instrument Technique 60-min Uncertainty
Det. Limit
APNs TD-CIMS See text 2–4 pptv See text
Ozone Dasibi 1008-RS UV Photometric Ozone
An-alyzer
0.6 ppbv ±8%
H2O vapor Campbell Scientific HMP
45C
Calculated from tempera-ture and relative humidity measurements – ±5% Sub-Micron Particle Scattering Radiance Research M903 Nephelometer Total scattering, 550 nm, sub-micron particles 0.35 Mm−1 ±6%
CO Thermo 48C-TLE Non-dispersive Infrared 30 ppbv ±4%
Hg0 Tekran 2537A, 1130, 1135 concentration on Au
car-tridges, thermal desorption, CVAFS
0.1 ng m−3 ±15%
into NO2and peroxy radicals under these conditions.
Ther-mal dissociation rates of other APNs are similar to those of PAN, thus we expect near-complete dissociation of all APNs studied (Roberts and Bertman, 1992; Grosjean et al., 1994a, b).
Upon exiting the inlet region, the hot sample gas passes through a flow-restricting orifice into the ion-molecule re-action region (55–60 Torr) where it immediately mixes with an iodide reagent ion flow. Iodide is generated by flowing trace amounts of methyl iodide (CH3I) in 2 slpm N2through
a commercial210Po α-particle ionizer (10 mCi, NRD). Per-oxy radicals react with iodide to form their corresponding carboxylate anions (Villalta and Howard, 1996):
RC(O)O2+I−·(H2O)n→RC(O)O−·(H2O)n+IO (2)
By retaining the “R” group, the TD-CIMS technique al-lows for speciation of APNs with different molecular masses; PiBN and PnBN, which have the same molecular mass, are detected as a sum and will be referred to as 6PBNs. After a reaction time of 70 ms, ions are focused through a second orifice into a collisional dissociation chamber (CDC) held at 0.8 Torr. A set of electrostatic lenses in the CDC establish an electric field of 55 V/cm to accelerate ions and break water-ion clusters apart through colliswater-ions with bath gas, thereby simplifying mass spectra and reducing the effect of humid-ity changes on instrument sensitivhumid-ity. Ions are then focused through a third pinhole into the differentially pumped high-vacuum chamber. Here an octopole ion guide directs ions through a final pinhole before mass selection and detection by a quadrupole mass spectrometer (Extrel). Signal intensi-ties at 59 (PAN), 71 (APAN), 73 (PPN), 85 (MPAN) and 87 (6PBNs) amu were acquired at 0.1 Hz with a signal collec-tion time of 1 s per mass. A full mass spectrum (10–200 amu) was also recorded every 3–6 h. A typical mass spectrum ob-tained during the measurement period is shown in Fig. 1b.
2.3 Sensitivity and background determination
Calibrations were performed at 45–90 min intervals by stan-dard addition of ∼1 ppbv of PAN (62.5 ppbv before dilu-tion into the sample stream) to sample air just prior to en-tering the heated inlet. PAN was generated by an acetone-nitric oxide photolysis source analogous to that of Roberts et al. (2004) and based on the work of Warneck and Zer-bach (1992). During the first half of the measurement pe-riod, isotopically-labeled acetone (17.79±0.36 ppmv in air, Scott-Marrin) was used with NO (1.025±0.020 ppmv in O2
-free N2, Scott-Marrin) to generate isotopically-labeled PAN
(13C-PAN) with the intention of shifting the calibration peak by 1 amu, thus allowing for continuous calibration. The ap-pearance of non-negligible signal at 59 amu during addition of 13C-PAN ultimately precluded a continuous calibration procedure, although the interference was fairly constant and easily removed from the raw data. We suspect that the inter-ference resulted from a combination of12C-acetone impuri-ties in the13C-acetone cylinder and insufficient signal reso-lution between the 59 amu and 60 amu peaks. 12C-acetone (18.62±0.37 ppmv in air, Scott-Marrin) was used for the re-mainder of the campaign. Before deployment, the photolytic PAN source was cross-checked against an NO/NOyanalyzer
operated by the Jaffe group at UW Bothell. These tests sug-gest a PAN formation efficiency of 95±1%, in good agree-ment with a chemical kinetics model and previous tests of analogous PAN sources (Volz-Thomas et al., 2002; Roberts et al., 2004).
The average sensitivity to PAN during the measurement period was 1.4±0.7 counts pptv−1s−1(mean±1 σ ). The 1 σ deviation corresponds to the entire data set. The median per-cent difference between adjaper-cent sensitivity measurements was 4.5%. Changes in the sensitivity of the TD-CIMS were inversely correlated with small changes (<10%) in the chem-ical ionization region pressure, which appear to have been
related to 5–10◦C diurnal variations in instrument room
tem-perature. Data analysis was largely unaffected by these fluc-tuations, as calibrations were performed frequently enough to capture any change in sensitivity. Average sensitivities from each calibration period were linearly interpolated to give concentration values for the 1-s data, and the sensitiv-ity of the TD-CIMS was assumed to be the same for all APNs. The nature of chemical ionization generally allows for extrapolation of calibrations constants within a family of ion-molecule reactions, as the reaction rates are often very similar within a family. We have confirmed this assump-tion for PPN in our lab, and other groups have shown that 6 PBNs and APAN also have similar sensitivities to PAN, but for MPAN the TD-CIMS sensitivity appears to be 3–8 times lower (Slusher et al., 2004; Turnipseed et al., 2006). Since the calculated concentrations are inversely proportional to sensitivity, the data reported here for MPAN may be consid-ered a lower limit to its actual atmospheric abundance; our conclusions herein are not dependent on the absolute abun-dance of MPAN. We note that the assumption of similar cal-ibration constants may fail under dry conditions, as previ-ous laboratory tests on an analogprevi-ous instrument suggest that the TD-CIMS technique may be 10–50% more sensitive to PPN than PAN at low (<100 ppmv) H2O concentrations in
the chemical ionization region (Swanson et al., 2004). It is unlikely that this was a significant issue during the measure-ment period, as estimates from ambient measuremeasure-ments indi-cate that H2O concentrations were always >125 ppmv in the
chemical ionization region.
Instrumental background noise was determined every 30 min by diverting sample air through a 27 cm length of 1/2′′OD stainless steel tubing packed with stainless
steel wool and heated to 150–180◦C prior to entering
the TD-CIMS. Laboratory tests using the PAN calibra-tion source suggest a destruccalibra-tion efficiency of >99% for PAN. The heated PFA inlet was also occasionally cooled to room temperature during the measurement period to check for temperature-independent interferences; all APN signals dropped to background levels during these tests. Average background count rates were found to be equivalent to 7 pptv for PAN and 2 pptv for other APNs, yielding 1-s detection limits (S/N=2) of 8 pptv for PAN and 5 pptv for other APNs. Averaging of the data to a 5-min or 60-min time base further reduces the detection limits, such that they are determined primarily by the deviation in adjacent background measure-ments (∼4 pptv for PAN and ∼2 pptv for other APNs). It should be noted that the less abundant APNs (MPAN, 6 PBNs and APAN) were often below the background-limited detection limit; however, these points are still used in the data analysis. Cumulative errors for the 1-s data are estimated at
±(15%+6) pptv for PAN and ±(15%+2) pptv for all other APNs.
2.4 Trajectory analysis
To assess the history of various air masses reaching MBO and identify potential pollution transport events from Asia, 10-day kinematic back trajectories (BTs) were calculated using the HYbrid Single-Particle Lagrangian Integrated Trajectory (HYSPLIT) model (Draxler and Rolph, 2003). The model was operated with meteorological input from the Global Data Assimilation System (GDAS) archive, which has a 3-h time resolution, 1◦latitude by 1◦longitude horizontal resolution and 23 vertical layers from the surface to 20 hPa. Ensemble BTs were initialized for each hour of the measurement period in a grid box centered on MBO, with start locations every 0.125◦in a 0.5◦latitude by 0.5◦longitude grid box and every 100 m of altitude from 0–2900 m above ground level (a.g.l.). This translates to 30 initialization altitudes with 25 initial-ization locations per altitude, yielding 750 trajectories per initialization time and a total of 588 000 BTs for the entire measurement period. This method is analogous to the calcu-lation of “retroplumes” as introduced by Stohl et al. (2002).
We use these BTs to estimate the magnitude of pollu-tion transport from Asia by determining how long each tra-jectory particle spends in an “East Asian box” defined as 20–45◦N by 100–130◦E by 0–3 km, similar to the method
described by Weiss-Penzias et al. (2006, 2007). This box corresponds to the continental boundary layer of an area of east-central China and Korea with high levels of an-thropogenic emissions as estimated by Streets et al. (2003) and measured by orbiting platforms such as MOPITT (cf. Heald et al., 2003); a map may be found in the supplemen-tal material (http://www.atmos-chem-phys.net/7/5309/2007/ acp-7-5309-2007-supplement.pdf). For each hour of the campaign and each BT initialization altitude, the number of hours in the East Asian box are counted and then averaged over the 25 trajectories for that initialization time and alti-tude. Thus, we compute the number of BTs passing through the East Asian box, weighted by the average amount of time each BT spends in the box. Results presented below are computed with trajectories driven by GDAS meteorol-ogy; however, we also performed this analysis with trajec-tories driven by the FNL (a lower-resolution archive of the GDAS output) and NCEP/NCAR Reanalysis meteorological datasets (information on these datasets may be found at http: //www.arl.noaa.gov/ss/transport/archives.html). Comparable conclusions are drawn in all cases, even though individ-ual trajectories were often different for each meteorological dataset. Section 4.2 details the results of this analysis.
3 Observations and analysis
3.1 Measurement summary
Figure 2 shows time series for 60-min averaged PAN, PPN, the ratio of PPN to PAN, ozone and CO for day of year 101
! " # $
Fig. 2. Time series of (a) PAN, (b) PPN, (c) PPN/PAN, (d) O3and (e) CO for the full period of APN measurements. For reference, day of year 101 corresponds to 11 April and day 121 to 1 May. Hourly-averaged data are plotted for clarity. Gray bars highlight discussed events.
to 134 (11 April to 14 May). Temporal profiles of PAN, PPN and other measured APNs (not shown) are qualitatively similar throughout the campaign. Air sampled during the first 11 days was relatively clean compared to the remain-der of the campaign, with PAN mixing ratios ranging from 20 to 321 pptv (mean 124±55 pptv) and O3 concentrations
from 34 to 58 ppbv (mean 47±4 ppbv). Ten-day back tra-jectories for this period indicate that air masses reaching MBO originated primarily from the Pacific MBL with min-imal continental influence. Starting on day 112 significant episodic increases in PAN and PPN are evident, particularly on days 113, 126, 128-129, and 132. Ozone also shows greater variability after day 112, reaching the highest values of the campaign (∼90 ppbv) on day 112 followed by a pe-riod of fairly low values (∼35 ppbv) from days 117 to 120. Changes in PAN and ozone are often strongly correlated dur-ing individual events (cf. days 128 and 132). Linear fits to four-day medians of PAN and O3 (not shown) indicate an
average increase of 0.48 ppbv/day for O3and 11.6 pptv/day
for PAN, consistent with seasonal changes in photochem-istry and long-range transport throughout the measurement
Table 2. Statistics for 5-min measurementsa.
Species Median Mean 1 σ Min. Max. Sloped r2d
PAN 203 334 369 11 3855 – – PPN 14 23 26 1 228 0.0654 0.96 6PBNs 3 3 3 0c 25 0.0079 0.63 MPAN – – – – – 0.0045b 0.59 APAN 1 1 1 0c 26 0.0028 0.39 Ozone 52 53 10 28 93 – – CO 143 142 15 83 283 – –
aAPN values in pptv, CO and O
3values in ppbv bLower limit
cMinimum values below detection limit dWith respect to PAN
period. CO exhibits less variability than the other species but does occasionally show coincident increases with PAN (cf. days 127 and 132).
Despite the apparent similarity between the temporal profiles of their absolute abundance, the ratio of PPN to PAN (Fig. 2c) varies considerably throughout the campaign. PPN/PAN ranges from 0.033 to 0.144, within the span re-ported by Roberts et al. (2004) for the NE Pacific region. The highest values of PPN/PAN tend to occur during times when both PAN and PPN are very low (e.g. days 126 and 128) and may be a consequence of concentrations approaching the de-tection limit of the TD-CIMS. This ratio (or its surrogate, the slope of a plot of PPN vs. PAN) is often used to diagnose anthropogenic influence in pollution plumes (Williams et al., 1997; Roberts et al., 2004). Though the utility of this indica-tor at MBO is complicated by extensive photochemical aging and dilution during LRT, which tends to lower the PPN/PAN ratio relative to source levels (Singh and Salas, 1989), we demonstrate below that the PPN/PAN ratio is still higher in LRT air than in air representative of the regional boundary layer composition.
Table 2 lists the statistical parameters for all APNs mea-sured at MBO, as well as O3and CO, using data averaged
onto a 5-min time base; MPAN abundances are not reported as their quantification is uncertain. For PAN and PPN, the mean values are greater than the medians by a factor of ∼1.7, reflecting the sporadic occurrence of high APN events; as such, the medians are a more appropriate indicator of the av-erage springtime behavior. Maxima for PAN and PPN were reached during two short events occurring on day 132. A number of other chemical tracers also displayed large en-hancements at this time, including ozone (24% above the campaign median) and sub-micron particle scattering (a fac-tor of 1.5 above the campaign median, not shown); water va-por dropped by a factor of 3, suggesting FT air. The origins of these events are unclear. Back trajectories indicate the pos-sibility of LRT from central East Asia and/or Eastern Europe,
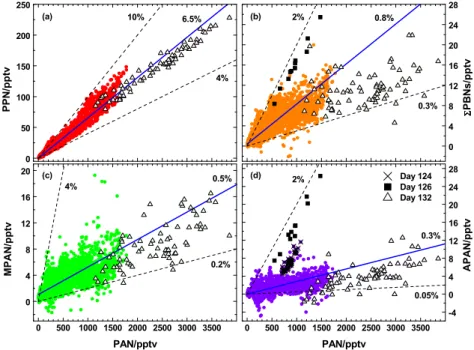
ΣΣΣΣ
Fig. 3. Relationships of PAN with (a) PPN, (b) 6PBNs, (c) MPAN and (d) APAN. Colored circles represent all 5-min data, while individual events are plotted as x’s (day 124), black squares (day 126), and open triangles (day 132). The solid lines are the linear least-squares fits to all data in each plot (see Table 2 for fit results). The dashed lines provide an estimate of the range of slopes. Note that reported MPAN values are a lower limit.
the latter of which experienced a broad band of agricultural and forest fires during late April and early May (Stohl et al., 2007). Additionally, several forest fires (possibly con-trolled burns) were also observed in the area around MBO during this period, resulting in a layer of haze clearly visible from the summit building. A more intensive analysis of such episodes is beyond the scope of the current study. Remov-ing these two events does not alter the campaign statistics enough to impact our conclusions, decreasing the mean and standard deviation for PAN by 7% and 17%, respectively. 3.2 Correlations among APNs
While PAN is by far the most abundant APN, a number of other APNs are also produced in the rich hydrocarbon chem-istry of the lower troposphere. PPN is generally the next most abundant, and is believed to be predominantly anthropogenic in origin (Singh and Salas, 1989). In contrast, MPAN is de-rived primarily from the photo-oxidation of biogenic hydro-carbons, particularly isoprene (Tuazon and Atkinson, 1990; Bertman and Roberts, 1991). Other APNs have also been recently detected in the field, including APAN (Roberts et al., 2001; Tanimoto and Akimoto, 2001), PnBN (Grosjean et al., 1993; Glavas and Moschonas, 2001) and PiBN (Roberts et al., 2002, 2003), all phytotoxic compounds associated with petrochemical precursors (Taylor, 1969; Roumelis and Glavas, 1992). Speciation of APNs can provide insight into sources of photochemical ozone precursors, especially near urban regions where recent photochemical production yields
high APN concentrations (Williams et al., 1997; Roberts et al., 1998, 2002).
Relationships of PAN with PPN, MPAN, 6PBNs and APAN are plotted in Fig. 3 using 5-min data, and the results of the error-weighted linear least-squares fit to each plot are summarized in Table 2. All APNs show a clear linear cor-relation with PAN, with slopes relative to PAN decreasing in the order PPN, 6PBNs, MPAN and APAN. This trend partly reflects the varying lifetimes and abundances of both the APNs and their VOC precursors; for example, the un-saturated hydrocarbon moiety in MPAN and APAN makes these compounds more susceptible to oxidation by OH and O3. The same ordering is also apparent in the progressively
weaker correlation coefficients, which may be a byproduct of atmospheric concentrations approaching the detection limit. Linear correlations are maintained even during the high PAN events observed on day 132, although the slopes of linear fits to the data during this period are generally lower than the fits to the full dataset, possibly suggesting more complete oxi-dation of VOCs prior to APN formation. Removing day 132 data has a negligible effect on the linear fits to the full dataset. The slopes listed in Table 2 and the range of values ob-served for the various APN-PAN relationships (denoted by dashed lines in Fig. 3) suggest that most of the polluted air intercepted at MBO, regardless of its origin, is photochem-ically aged. PPN is clearly the most ubiquitous APN af-ter PAN, with the ratio of PPN/PAN ranging from 4–10% and averaging 6.5% (Fig. 3a). PPN and PAN are highly
!"# $%& $ # ' '$ "(!
Fig. 4. Relationships of (a) PAN and O3, (b) PAN and CO, (c) CO and O3, (d) PAN and sub-micron particle scatter for all 5-min data. Note
the logarithmic scale for PAN in (a) and (b) and the axis break for particle scattering in (d). Gray circles represent all data, while events are plotted as asterisks (day 112), black squares (day 126) and open triangles (day 132).
correlated (r2=0.96), which is somewhat unexpected con-sidering the diversity of air masses sampled at MBO. Our PPN/PAN agrees well with the range (3–14%) and average (8%) of values reported by Singh et al. (1989) for North America and is well below the 12–15% observed for urban areas (Roberts et al., 1998, 2002, 2003), indicating the ab-sence of “fresh” anthropogenic pollution. In contrast to PPN, other APNs are much less abundant (<1% of PAN on av-erage), with mixing ratios and slopes approximately an or-der of magnitude smaller than those measured at urban lo-cations (Roberts et al., 2002, 2003). Occasional episodic in-creases in these compounds are still observed; for instance, a plume sampled on day 124 contained relatively high levels of APAN, and another event on day 126 brought the highest values of the campaign for APAN and 6PBNs (see Figs. 3b and d). These narrow plumes also contained uncharacteristi-cally high levels of CO and sub-micron particle scattering, up to 283 ppbv and 190 Mm−1, respectively (see Fig. 4). Such enhancements suggest an unidentified anthropogenic com-bustion source or very rapid long-range transport given the expected short OH-lifetime of APAN; back trajectories for these episodes are inconclusive.
Though most of the cross-correlations of the four less abundant APNs yield little additional information, the cor-relation between 6PBNs and MPAN (r2=0.73) is stronger than might be expected, considering that the former is thought to be primarily anthropogenic in origin, while the latter is predominantly biogenic. Although the MPAN pre-cursor methacrolein has been identified as a minor
com-ponent of vehicle exhaust (Zervas et al., 1999), this cor-relation may provide evidence of the existence of an unidentified biogenic APN, namely peroxypyruvyl nitrate (CH3C(O)C(O)OONO2, PPyN), which would be detected at
the same mass as 6PBNs (m/z=87). PPyN has been pos-tulated to be a product of MPAN oxidation (Orlando et al., 2002) and would likely have a longer atmospheric lifetime than MPAN, but it has yet to be uniquely identified in the atmosphere. It is not possible to differentiate between the various possible species at this mass with the current dataset. 3.3 PAN relationships with ozone, carbon monoxide and
particle scattering
Figure 4a displays the log-linear relationship of PAN and ozone for all 5-min data. For the majority of the data, PAN and ozone exhibit a positive correlation, which is to be ex-pected since both are products of coupled NOx–VOC
photo-chemical cycles in the troposphere. A number of previous studies have also reported strong positive correlations be-tween PAN and O3(Singh et al., 1990; Parrish et al., 1992;
Walega et al., 1992; Roberts et al., 2002). Both O3 and
PAN are relatively high during the events on days 126 and 132, suggesting active photochemistry in these air masses; CO–O3relationships yield little information for these events,
although a slight positive correlation is seen for day 132 (Fig. 4c). The lone enhancement of O3 on day 112 and
high-altitude trajectories (approaching 10 km) makes strato-spheric influence a likely possibility for this episode. Al-though the negative CO–O3 correlation typically associated
Table 3. Comparison of PAN observations at Northern midlatitudesa.
Study/Location Typeb Dates Alt./km Median Mean 1 σ Max Reference
Point Arena MBL April–May 1985 0.0 40 57 47 173 Parrish et al. (1992)
PHOBEA/CPOc MBL March–April 1997 0.5 103 140 129 395 Jaffe et al. (2001)
PHOBEA/CPO MBL March–April 1998 0.5 101 134 102 363 Jaffe et al. (2001)
PHOBEA/Air MBL/FT March–April 1999 2–4 108 183 186 622 Kotchenruther et al. (2001a)
ITCT 2K2 MBL/FT April–May 2002 2–4d 118 142 117 660 Roberts et al. (2004)
INTEX-B/C-130 MBL/FT April–May 2006 2–4d 233 262 189 2575 F. Flocke, personal communication
Niwot Ridge CBL/FT July 1984 3 – 275 300 2317 Singh and Salas (1989)
Jungfraujoch CBL/FT MAM 1997-98 3.6 294 346 245 7000 Zellweger et al. (2003)
INTEX-B/MBO CBL/FT April–May 2006 2.7 206 340 370 3074 This work
aPAN values in pptv. Ground data are 60-min averages; aircraft data are 1-min averages. bMBL: marine boundary layer; FT: free troposphere; CBL: continental boundary layer cCheeka Peak Observatory
dWest of 120◦ W
with stratospheric intrusions is not observed for the day 112 event (Fig. 4c), we note that this correlation depends on the CO–O3 relationship within the region of the lower
strato-sphere from which the intrusion originated and the degree of mixing during downward transport to MBO.
The PAN–CO relationship, shown in Fig. 4b, is also log-linear for the bulk of observations. CO mixing ratios are sometimes strongly positively correlated with PAN and par-ticle scattering (Fig. 4d), such as on day 126, but show little overall correlation with O3(Fig. 4c) in this data set. A
gen-eral positive correlation is expected for CO and PAN given that emission sources of CO and NOxare often collocated,
although the enhancement ratio for a particular episode will depend both on the photochemical and meteorological his-tory of an air mass – as CO and PAN lifetimes could be vastly different – and on the exact nature of the emission source. For example, recent Asian emission inventories have estimated that CO/NOxemission factors are 16–65 g/g for
in-efficient combustion sources (e.g. domestic fuel and biomass burning) but are close to zero for other anthropogenic sources such as coal-fired power plants (Streets et al., 2003). Mean CO concentrations measured at MBO in spring 2006 are
∼20 ppbv lower compared to previous years, and the vari-ability is also lower by 5–10 ppbv (Jaffe et al., 2005). While the reasons for these differences are not yet well understood, it is conceivable that the relative contribution of domestic fuel and biomass burning to pollution observed at MBO was stronger in previous years.
PAN and sub-micron particle scattering typically exhibit a positive correlation (Fig. 4d), although the slope of this cor-relation will depend strongly on the history of the air mass. For example, the low slope and high scattering values for the day 126 episode indicates a lack of particle scavenging ei-ther because the plume is fresh or transport was rapid and
dry. The high slope for the day 132 event suggests that this plume is more aged, with more photochemical production of PAN and significant particle scavenging during transport. A more detailed analysis of these events is precluded by a lack of additional measurements such as speciated hydrocarbons and NOx/NOy.
3.4 Comparison with previous APN measurements Table 3 presents statistics from a collection of field measure-ments of PAN made at various locations in the NE Pacific and the northern FT; references pertinent to the following discus-sion are also listed. PAN mixing ratios measured at MBO in spring 2006 are among the highest ever reported in re-mote western North America, although the available data is far from comprehensive. PAN abundances at Point Arena, CA – among the first to be reported for the NE Pacific – are quite low (<100 pptv), as would be expected for a site that samples predominantly clean MBL air. Later spring-time studies in this region, such as PHOBEA and ITCT 2K2, have focused largely on non-continental regions, where PAN concentrations are expected to be lower due to warmer temperatures (when sampling MBL air) and lower precursor concentrations. Mean PAN concentrations for these inves-tigations are 100–200 pptv, 30–50% of the MBO mean. In aircraft-based campaigns, 1-min maximum PAN concentra-tions observed at higher altitudes (in the FT) or in Asian-influenced air are well below the 60-min maxima observed during pollution episodes at MBO. Interestingly, PAN obser-vations recorded on the NCAR C-130 research aircraft dur-ing INTEX-B are much closer to the MBO values than pre-vious aircraft measurements, with a mean of 275 pptv and a maximum of 2.6 ppbv. Whether these more recent data sug-gest an increasing trend in PAN across the NE Pacific, re-flect stronger LRT from Asia during 2006, or indicate more
! " # $ % & ' & (
Fig. 5. Diurnal profiles of (a) PPN/PAN, ozone and water vapor, (b) PAN and PPN, calculated with 5-min data. Each hourly point represents the mean (a) or median (b) of all five-minute points within ±30 min of that hour. Error bars denote the standard deviation of the mean for each point. Vertical dash-dotted lines indicate average sunrise/sunset times at MBO during the campaign.
sampling of this pollution compared to the previous cam-paigns remains to be determined through a combination of modeling and additional longer term observations.
A comparison of PAN measurements between the few other high-altitude mountain locations in the Northern Hemi-sphere provides further context to our MBO data. PAN measurements at Niwot Ridge, Colorado, and Jungfraujoch, Switzerland, are quite similar to our observations at MBO, both in the mean values and standard deviations, although direct comparison with the summertime Niwot Ridge mea-surements is complicated by seasonal PAN variations. Zell-weger et al. (2003) reported springtime PAN mixing ratios of up to 7 ppbv at Jungfraujoch, almost twice our observed maximum. Furthermore, our values are within the range of PAN concentrations observed in numerous non-urban conti-nental air masses around the world (see Roberts, 1990, and references therein). Thus we conclude that APN values mea-sured at MBO are representative of an inland mountaintop site that intercepts a mixture of FT, MBL and continental air. 3.5 Boundary layer vs. free troposphere influences As demonstrated by Weiss-Penzias et al. (2006), the spring-time diurnal patterns of many chemical and meteorological parameters at MBO tend to be controlled by the meteorology characteristic of many high alpine sites. During the daytime, surface heating in surrounding valleys generates an upslope flow, bringing air to MBO from the mixed layer that is warm, higher in water vapor and depleted in ozone due to surface losses. At night this flow is reversed and accompanied by a
drop in the mixed layer height, drawing drier, ozone-rich FT air down to MBO. To assess the average springtime diurnal behavior of APNs at MBO, we plot in Fig. 5 the mean values of ozone, water vapor and PPN/PAN, as well as median PAN and PPN, as a function of local time of day. Median PAN and PPN cylces are shown instead of means because the lat-ter are prone to weighting by a few high-APN events, and thus we deem the median to be a more appropriate indicator of the average diel behavior for APNs. Ozone, water vapor and PPN/PAN display similar mean and median profiles, as these parameters are normally distributed. While the stan-dard deviation of each point is large due to the variety of air masses intercepted at MBO, the standard error of the means, defined as σ /(N)1/2and indicated by the error bars, is a more appropriate measure of the uncertainty in the average behav-ior and is within 8% for PAN and PPN and 3% for ozone and water vapor. The diurnal patterns for ozone and water vapor (Fig. 5a) are qualitatively the same as those for the 2004 MBO data set reported in Weiss-Penzias et al. (2006), although in the 2006 data the maximum water vapor and min-imum ozone are reached ∼1 h later; small time shifts are also observed for diurnal profiles of temperature, wind speed and relative humidity (not shown). Moreover, the 2006 diurnal cycles show higher average ozone (by ∼9 ppbv) and lower water vapor (by ∼1 g kg−1). These differences may reflect the inclusion of early April measurements in the 2004 data set or a stronger influence from the FT during 2006; long-term measurements at MBO will help elucidate the nature of these discrepancies.
Figure 5b illustrates the diurnal variations of PAN and PPN; as in the longer data set (see Fig. 2), PAN, PPN and the other APNs (not shown) qualitatively exhibit the same behavior. Diurnal cycles in both PAN and PPN have been observed previously at other ground sites (Singh and Salas, 1989; Walega et al., 1992; Zellweger et al., 2003; Doskey et al., 2004), although other high-alpine sites typ-ically show a single maximum in the afternoon that is at-tributed to thermally-induced vertical transport of local pol-lution. The springtime trend at MBO is clearly more compli-cated but is consistent with contributions from photochemi-cal activity, boundary layer dynamics and LRT. For example, the broad late morning peak in the median PAN profile might be attributed to photochemical production, and a second rise before midnight – after photochemical production has ceased – may be related to stronger subsidence from the FT. Note that the range of variability in the PAN diurnal cycle is small (∼60 pptv) compared to the range of the full set of PAN mea-surements (11–3855 pptv), illustrating that diurnal processes have only a minor effect on APN levels at MBO compared to other influences, such as LRT of non-local pollution.
Despite the similarity of the PAN and PPN diurnal pro-files, Fig. 5a illustrates a clear diurnal cycle in the PPN/PAN ratio, with PPN mixing ratios ranging from 6.4% to 7.3% of those of PAN. This cycle is present for both mean and me-dian PPN/PAN profiles. Although the cycle phase appears to be shifted back by ∼1 h relative to ozone and water va-por, the trend is almost parallel to that of ozone (r2=0.66) and also correlates negatively with water vapor (r2=0.68) (correlation coefficients are for the diurnal trends as plot-ted). The diurnal variation in ozone correlates stronger with PPN (r2=0.41) than PAN (r2=0.19), suggesting that diur-nal variations in PPN/PAN are more a function of changes in the PPN mixing ratio (relative to PAN). Given the sim-ilarity of the diurnal patterns for PPN/PAN and ozone, we conclude that upslope/downslope flows drive the diurnal be-havior of PPN/PAN. It is unlikely that this cycle is an arti-fact caused by water vapor-induced changes in relative PAN and PPN sensitivities, as detailed calculations indicate that even a 50% difference in PPN and PAN sensitivities at the lowest H2O concentrations cannot explain the observed
diur-nal trend in the PPN/PAN ratio. Differing loss rates of PAN and PPN to deposition (Shepson et al., 1992; Turnipseed et al., 2006) or thermal decomposition may affect changes in the PPN/PAN ratio between BL and FT air, although the ob-served PPN/PAN cycle is counter to that expected from ther-mal decomposition rates, which are estimated to be ∼20% faster for PAN than for PPN (Kirchner et al., 1999; Roberts et al., 2004). In the absence of other sinks or significant trans-port, the PPN/PAN ratio would be higher in warmer bound-ary layer air. We conclude that the PPN/PAN diurnal cycle is most likely due to differences in hydrocarbon chemistry between the boundary layer and the free troposphere.
To distinguish between boundary layer (BL) and FT air masses, we utilize water vapor concentrations as in
previ-Σ ΣΣ Σ ! " # Σ Σ Σ Σ # # # " #$$ %
Fig. 6. Relationship of ozone with (a) APNs and (b) APN/PAN ratios and water vapor. Each point represents the binned mean of an equal number of points from the five-minute dataset, and each curve is normalized to its maximum value (indicated in plot legends).
ous analyses of MBO observations (Weiss-Penzias et al., 2006). Filters for the 60-min data set were generated by including only the lowest (FT) or highest (BL) 20th per-centiles by water vapor, corresponding to H2O<1.5 g kg−1
and H2O>2.9 g kg−1, respectively. Medians for the total
dataset, as well as the BL and FT subsets, are listed in Ta-ble 4. PAN increases by more than 200 pptv and ozone by 22 ppbv in “dry” air relative to “wet” air, suggestive of higher concentrations in the FT. No significant differences were observed in CO (not shown) between the dry, wet and full datasets, although enhancements of ∼10 ppbv have been observed in dry air at MBO in previous years (Weiss-Penzias et al., 2006).
Ozone abundances at MBO are affected by mountain me-teorology and long-range transport but are also photochemi-cally linked to APNs; thus, relationships of ozone with APNs and APN/PAN ratios can provide insight into variations in hydrocarbon chemistry between different air masses. Fig-ure 6a shows mean values of PAN, PPN, 6PBNs, MPAN and APAN, binned by ozone such that each bin contains an equal amount of points from the 5-min dataset and normal-ized to their maximum values for comparison. Figure 6b is
! ! " # $ " # % & ' ( ) * + , ,
-Fig. 7. (a) Average number of hours spent in the East Asian box for back trajectories originating around MBO, as a function of trajectory initialization time and altitude. Results are plotted at 100 m altitudinal increments for every hour of the campaign. White space represents time/altitude pairs where no trajectories passed through the box (hours in Asian box = 0). The horizontal lines denote the range of data used to calculate the ALRT index. (b) Time profiles of the ALRT index (thick magenta line) and PAN (thin black line). The ALRT index is defined as the mean of the 1.7–2.1 km cross-sections of plot (a). Each point is the mean for 125 trajectories. Gray bars highlight events for which trajectories are plotted in Fig. 8.
90 E 120 E 1 50 E 1 80 E 150 W 120 W 0 30 N 60 N 90 E 120 E 150 E 1 80 E 150 W 120 W 0 30 N 60 N 90 E 120 E 1 50 E 1 80 E 150 W 120 W 0 30 N 60 N
Fig. 8. Representative 10-day back trajectories for LRT events highlighted in Fig. 7b. Each plot shows 25 trajectories initialized at a single height in a 0.5◦latitude by 0.5◦longitude grid centered on MBO. Red lines represent full trajectories, while black circles denote 24-h intervals. (a) Day 113, initialization time 04:00 UTC, initialization altitude 2.0 km a.g.l. (b) Day 117, initialization time 08:00 UTC, initialization altitude 2.0 km a.g.l. (c) Day 128, initialization time 04:00 UTC, initialization altitude 1.8 km a.g.l.
an analogous plot for PPN/PAN, 6PBNs/PAN, MPAN/PAN, APAN/PAN and water vapor. The standard error for each point is relatively small (<7%) and the use of bin medians (not shown) yields the same results as bin means. Figure 6a reveals that all APNs demonstrate similar correlations with ozone, starting at 20% to 40% of their peak values and in-creasing to maxima at the highest ozone concentrations. The observed trends are consistent with the photochemical rela-tionship of APNs and O3 but are also indicative of
gradi-ents in these species between BL and FT air, as illustrated
by the simultaneously decreasing water vapor in Fig. 6b. BL air should be relatively depleted in ozone and APNs due to stronger sinks: deposition removes ozone (and to some ex-tent APNs) near the surface, and thermal decomposition of APNs is faster in warmer, lower-altitude air.
Relationships of APN/PAN ratios with ozone provide a more direct gauge of the type of hydrocarbons participating in photochemical cycles. Figure 6b shows that PPN/PAN in-creases by ∼15% over the range of mean ozone values while APN/PAN ratios for larger-chain APNs decrease by 50% to
70%. Taken with the large drop in water vapor concentra-tion, these profiles imply a significant, but expected, change in the hydrocarbon chemistry on transitioning from BL to FT air. In the mixed layer, continental petrochemical sources in the region around Mount Bachelor, primarily vehicular traf-fic and domestic fuel use, could contribute to elevated levels of 6PBNs and APAN, while biogenic VOCs from surround-ing coniferous forests could enhance MPAN levels. In aged FT air, on the other hand, longer-chain or unsaturated APNs should be depleted relative to PAN because of less-abundant precursors and, for MPAN and APAN, faster oxidation by OH and O3. For example, the typical lifetime against
reac-tion with OH is ∼1 year for PAN and ∼10 h for MPAN. The positive correlation of PPN/PAN and ozone is analogous to the parallel diurnal cycles seen in Fig. 5a and implies that MBO is impacted by transport of anthropogenic pollution from distant sources via the free troposphere.
3.6 Examining Asian long-range transport with trajectories We employ an ensemble back trajectory (BT) analysis to ob-tain an estimate of the impact of Asian LRT (ALRT) on APN levels at MBO. Figure 7a displays the average residence time in the East Asian box for BTs initialized at MBO, plotted as a function of BT initialization altitude and time. Results re-veal a number of ALRT episodes, many of which display a downward-sloping “L” shape suggestive of subsidence. The percentage of Asian-influenced BTs passing near MBO at a given BT start altitude increases from <1% at 0 km to 43% at 2.9 km, consistent with the view that LRT pathways are primarily via the free troposphere in the spring (Liang et al., 2004) and that mixed layer composition is dominated by lo-cal and regional influences. The mean residence time in the East Asian box for ALRT BTs is ∼6.5 h. Separate calcula-tions indicate that BTs leaving the East Asian box take an average of 8-9 days to reach MBO, although transit times as short as 6 days are not uncommon.
Comparison of predicted ALRT events with observations at MBO requires selecting trajectory model output from the appropriate altitude. HYSPLIT calculates ground level for the grid containing MBO to be 1.0–1.1 km above sea level (a.s.l.), while the actual altitude of the summit building is 2.76 km a.s.l.; this places MBO at ∼1.7 km above ground level (a.g.l.) for the GDAS meteorological dataset. In or-der to adequately catch descending plumes, however, it is often necessary to examine BTs at several initialization al-titudes (Weiss-Penzias et al., 2006). Visual comparison of individual altitudinal cross-sections from Fig. 7a with PAN and ozone profiles reveals the same phenomenon as observed for the 2004 MBO intensive, where some plumes observed at MBO arrive at a time different from that predicted by the BT analysis. This is particularly prevalent for strongly subsiding air masses and is symptomatic of the accumulation of errors when running the trajectory model over a 10-day period. The computation of a statistical set of trajectories – as done in the
Table 4. Median values for filtered 60-min data.
Data Filter PANa PPNa PPN/PAN Ob3 H2Oc # pts
All Data 206 13 0.068 52 2.2 784 Dry 379 27 0.074 65 1.0 170 Wet 162 9 0.056 43 3.3 163 ALRT>0 284 19 0.069 55 2.0 446 ALRT=0 148 10 0.065 49 2.5 338 Dry + ALRT 414 29 0.074 65 1.0 126 Values inapptv,bppbv,cg kg−1.
current study – reduces such errors, but we will refrain from drawing detailed connections between trajectory results and observations.
To evaluate the extent of Asian influence at MBO, we em-ploy an ALRT index, plotted in Fig. 7b and defined as the average of the five cross-sections between 1.7 and 2.1 km in Fig. 7a. This altitude range provides the best alignment be-tween BT-predicted and observed pollution events, and the width (500 m) is on the order of the GDAS vertical resolu-tion. Comparing the ALRT index time series with the PAN profile, also plotted in Fig. 7b, reveals that some pollution events are captured quite well by the ALRT index (days 113 and 131). In other cases, however, substantial chemical en-hancements are observed without increases in the ALRT in-dex (day 129), or the ALRT inin-dex predicts an episode but no significant enhancements are detected at that time (day 117). There is no reason to expect, a priori, a direct correlation be-tween APN abundances and residence time in the East Asian box, as atmospheric composition at MBO is often subject to numerous influences. First, LRT is expected from regions other than Asia (e.g. Siberia, the Arctic, California, etc.). Trajectories for the broad event on days 128–129 (Fig. 8c), for example, suggest strong subsidence from the upper Arc-tic troposphere, which may have contained elevated pollu-tant levels due to the previously mentioned Eastern European fires (Stohl et al., 2007). Measurements of levoglucosan, a product of cellulose pyrolysis, taken at MBO during this time also imply a biomass burning source (T. Primbs, personal communication). Second, not all air masses leaving the East Asian box will reach North America with elevated pollutant levels. Dilution and chemical losses may deplete plume con-centrations during transport, depending on the actual trajec-tory. APNs may only survive LRT when temperatures are cold enough that their thermal decomposition lifetime ex-ceeds the entire transit period, as in the strong subsidence event observed on day 113 (Fig. 8a). When ALRT occurs within the MBL, as was the case for the air mass observed on day 117 (Fig. 8b), APN concentrations can be severely depleted. A higher ALRT index does not necessarily trans-late to larger enhancements; however, longer residence times
should increase the probability that an LRT air mass will con-tain pollution from Asia.
The ALRT index provides a useful means for gauging the average perturbations in atmospheric composition at MBO caused by ALRT. To extract data representative of ALRT, we divide the 60-min dataset into two categories: times when BTs indicate a history in the East Asian box (ALRT index>0) and times when they do not (ALRT index=0). Ta-ble 4 shows that the ALRT-influenced dataset, comprising
∼57% of all data points, displays elevated medians for all chemical values relative to the “no ALRT” data. PAN and PPN are enhanced by nearly a factor of two, and O3 is
∼10% higher. Our results agree well with those of Nowak et al. (2004), who estimate mean PAN an O3enhancements of
360 pptv and 73 ppbv, respectively, in Asian pollution plumes as identified by CO measurements and back trajectories.
Recent studies have identified the gaseous elemental mercury-carbon monoxide enhancement ratio as a tracer of pollution from Asia, with “Asian” plumes exhibiting a char-acteristic 1(Hg0)/1(CO) of ∼0.0048 ng m−3ppbv−1 (Jaffe et al., 2005; Swartzendruber et al., 2006; Weiss-Penzias et al., 2006, 2007). The enhancement ratio for the ALRT sub-set – calculated as the linear slope of a plot of Hg0versus CO – yields a value of 0.0049 ng m−3ppbv−1, in excellent agree-ment with the expected Asian ratio and lending support to the trajectory filter analysis. Mercury data is only available after day 113, thus the 1(Hg0)/1(CO) values are calculated with roughly half of the number of points shown in the last column of Table 4, although the Hg0-CO correlation is still moder-ately strong (r2=0.28) and statistically significant (p≪0.01). We believe this finding provides support to our conclusions drawn from the ALRT trajectory-based filter. Otherwise, it is an odd coincidence that the ALRT filter selects air with the same Hg/CO enhancement ratio as is typical of Asian out-flow. As with the wet/dry filters, CO mixing ratios exhibit no significant difference between ALRT and non-ALRT air masses. Performing a similar analysis on spring 2005 MBO data yields a CO enhancement of ∼18 ppbv in ALRT air; the differences in CO behavior between 2005 and 2006 are not yet fully understood.
Median water vapor varies little between the ALRT, no ALRT and full datasets, indicating that LRT from Asia is not necessarily restricted to dry FT air masses. Nevertheless, plumes transported from Asia in the free troposphere should contain higher average APN concentrations due to longer thermal lifetimes (Wang et al., 2006). To test this hypothesis, the dry and ALRT filters were combined to extract ALRT air masses arriving from the FT. Resulting median values (see Table 4) confirm that the largest average enhancements for all quantities are observed during periods when high-altitude LRT brings air from the central East Asian boundary layer to MBO. Median PAN is double the campaign median at 414 pptv, and O3 is enhanced by 12 ppbv (∼20%) over the
campaign median. These points comprise ∼16% of all APN observations made at MBO in spring 2006. The same
con-clusions are reached if the ALRT index is constructed from trajectories driven by the FNL or NCEP/NCAR Reanalysis meteorological datasets.
4 Conclusions
We have presented an analysis of a suite of acyl peroxy ni-trates measured at Mount Bachelor Observatory in April and May of 2006. APN abundances at MBO are highly vari-able and event-driven, with 5-min average PAN mixing ratios ranging from 11 to 3855 pptv and averaging 334 pptv. Rela-tionships of PAN with PPN, MPAN, 6PBNs and APAN are characteristic of well-aged air masses influenced by a vari-ety of local, regional and global-scale sources. Both ozone and CO display a strong log-linear relationship with PAN. While higher than previous campaigns in the NE Pacific re-gion, observed PAN levels at MBO are consistent with PAN measurements at other high-alpine sites. Investigation of di-urnal cycles and correlations of APNs and APN/PAN ratios with ozone reveals a gradient in hydrocarbon chemistry be-tween boundary layer and free tropospheric air. Our analysis indicates that the highest levels of ozone and APNs observed at MBO arrive from the free troposphere and are associated with anthropogenic pollution. A back trajectory analysis sug-gests that LRT of Asian pollution via the free troposphere ef-fectively doubles the mean PAN mixing ratio at MBO during pollution episodes.
The consequences of trans-Pacific pollution transport from Asia for local photochemistry in western North America re-mains to be fully elucidated. While the ALRT index provides a useful first estimate of the impacts on atmospheric com-position at MBO, thorough modeling studies are necessary to fully understand the effects of APN transport on quan-tities like nitrogen deposition and the ozone photochemical tendency in Northwestern America. Such efforts will re-quire simulations with coupled chemistry-transport models and detailed box-modeling of the strongest transport events observed during the campaign. We stress the need for con-tinuous observations of APNs and other chemical species at sites such as MBO, to acquire a dataset extensive enough to allow evaluation of the long-term effects of increasing Asian emissions on air quality in western North America.
Acknowledgements. The authors thank J. Roberts for providing
plans for the PAN calibration source, D. Tanner for providing plans for the octopole ion guide, T. Primbs for levoglucosan data, R. Yatavelli and A. Moon for technical support and help-ful discussion, and L. Jaegl´e for insighthelp-ful comments on the manuscript. We also thank the staff of the Mount Bachelor Ski Resort and C. Higginbotham for their cooperation and assistance. This work was supported by NASA Office of Earth Science grant NIP/03-0000-0025 and NSF-ATM-0613064. G. M. Wolfe was supported by NASA Headquarters under the Earth System Science Fellowship Grant NNG-05GP64H.
References
Berntsen, T., Karlsdottir, S., and Jaffe, D.: Influence of Asian emissions on the composition of air reaching the North Western United States, Geophys. Res. Lett., 26(14), 2171–2174, 1999. Bertman, S. B. and Roberts, J. M.: A PAN analog from isoprene
photooxidation, Geophys. Res. Lett., 18(8), 1461–1464, 1991. Bertschi, I. T., Jaffe, D. A., Jaegle, L., Price, H. U., and Dennison,
J. B.: PHOBEA/ITCT 2002 airborne observations of transpacific transport of ozone, CO, volatile organic compounds, and aerosols to the northeast Pacific: impacts of Asian anthropogenic and Siberian boreal fire emissions, J. Geophys. Res., 109, D23S12, doi:10.1029/2003JD004328, 2004.
Bey, I., Jacob, D. J., Logan, J. A., and Yantosca, R. M.: Asian chemical outflow to the Pacific in spring: Origins, pathways, and budgets, J. Geophys. Res., 106(D19), 23 097–23 113, 2001. Chameides, W. L., Li, X., Tang, X., Zhou, X., Luo, C., Kiang, C.
S., St. John, J., Saylor, R. D., Liu, S. C., Lam, K. S., Wang, T., and Giorgi, F.: Is ozone pollution affecting crop yields in China?, Geophys. Res. Lett., 26(7), 867–870, 1999.
Cooper, O. R., Forster, C., Parrish, D., Trainer, M., Dunlea, E., Ry-erson, T., H¨ubler, G., Fehsenfeld, F., Nicks, D., Holloway, J., De Gouw, J., Warneke, C., Roberts, J. M., Flocke, F., and Moody, J.: A case study of transpacific warm conveyor belt transport: Influ-ence of merging airstreams on trace gas import to North America, J. Geophys. Res., 109, D23S08, doi:10.1029/2003JD004006, 2004.
Crutzen, P. J.: The role of NO and NO2in the chemistry of the
tro-posphere and stratosphere, Ann. Rev. Earth Planet. Sci., 7, 443– 472, 1979.
Doskey, P. V., Kotamarthi, R. V., Fukui, Y., Cook, D. R., Breitbeil III, F. W., and Wesely, M. L.: Air-surface exchange of peroxy-acetyl nitrate at a grassland site, J. Geophys. Res., 109, D10310, doi:10.1029/2004JD004533, 2004.
Draxler, R. R. and Rolph, G. D.: HYSPLIT (HYbrid Single-Particle Lagrangian Integrated Trajectory) Model access via NOAA ARL READY Website, NOAA Air Resour. Lab., Silver Spring, MD., available at http://www.arl.noaa.gov/ready/hysplit4.html, last ac-cessed August 2007.
Elliot, S., Blake, D. R., Duce, R. A., Lai, C. A., McCreary, I., Mc-Nair, L. A., Rowland, R. S., Russel, A. G., Streit, G. E., and Turco, R. P.: Motorization of China implies changes in Pacific air chemistry and primary production, Geophys. Res. Lett., 24(21), 2671–2674, 1997.
Fiore, A. M., Jacob, D. J., Bey, I., Yantosca, R. M., Field, B. D., Fusco, A. C., and Wilkinson, J. G.: Background ozone over the United States in summer: Origin, trend, and contribu-tion to pollucontribu-tion episodes, J. Geophys. Res., 107(D15), 4275, doi:10.1029/2001JD000982, 2002.
Glavas, S. and Moschonas, N.: Determination of PAN, PPN, PnBN and selected pentyl nitrates in Athens, Greece, Atmos. Environ., 35(32), 5467–5475, 2001.
Goulding, K. W. T., Bailey, N. J., Bradbury, N. J., Hargreaves, P., Howe, M., Murphy, D. V., Poulton, P. R., and Willison, T. W.: Nitrogen deposition and its contribution to nitrogen cycling and associated soil processes, New Phytol., 139, 49–58, 1998. Grosjean, D., Grosjean, E., and Williams, E. L.: Thermal
decom-position of PAN, PPN and vinyl-PAN, Air & Waste, 44(4), 391– 396, 1994a.
Grosjean, D., Grosjean, E., and Williams II, E. L.: Thermal
de-composition of C3-substituted peroxyacyl nitrates, Res. Chem. Intermed., 20(3–5), 447–461, 1994b.
Grosjean, D., Williams II, E. L., and Grosjean, E.: Ambient lev-els of peroxy-n-butyryl nitrate at a Southern California moun-tain forest smog receptor location, Environ. Sci. Technol., 27(2), 326–331, 1993.
Heald, C. L., Jacob, D. J., Fiore, A. M., Emmons, L. K., Gille, J. C., Deeter, M. N., Warner, J., Edwards, D. P., Crawford, J. H., Hamlin, A. J., Sachse, G. W., Browell, E. V., Avery, M. A., Vay, S. A., Westberg, D. J., Blake, D. R., Singh, H. B., Sandholm, S. T., Talbot, R. W., and Fuelberg, H. E.: Asian outflow and trans-Pacific transport of carbon monoxide and ozone pollution: an integrated satellite, aircraft, and model perspective, J. Geophys. Res., 108(D24), ACH 25/21-ACH 25/13, 2003.
Hudman, R. C., Jacob, D. J., Cooper, O. R., Evans, M. J., Heald, C. L., Park, R. J., Fehsenfeld, F., Flocke, F., Holloway, J., H¨ubler, G., Kita, K., Koike, M., Kondo, Y., Neuman, A., Nowak, J., Olt-mans, S., Parrish, D., Roberts, J. M., and Ryerson, T.: Ozone production in transpacific Asian pollution plumes and implica-tions for ozone air quality in California, J. Geophys. Res., 109, D23S10, doi:10.1029/2004JD004974, 2004.
Jacob, D. J., Logan, J. A., and Murti, P. P.: Effect of rising Asian emissions on surface ozone in the United States, Geophys. Res. Lett., 26(14), 2175–2178, 1999.
Jaffe, D., Anderson, T., Covert, D., Trost, B., Danielson, J., Simp-son, W., Blake, D., Harris, J., and Streets, D.: Observations of ozone and related species in the northeast Pacific during the PHOBEA campaigns 1. Ground-based observations at Cheeka Peak, J. Geophys. Res., 106(D7), 7449–7461, 2001.
Jaffe, D., Bertschi, I., Jaegl´e, L., Novelli, P., Reid, J. S., Tanimoto, H., Vingarzan, R., and Westphal, D. L.: Long-range transport of Siberian biomass burning emissions and impact on surface ozone in western North America, Geophys. Res. Lett., 31, L16106, doi:10.1029/2004GL020093, 2004.
Jaffe, D., McKendry, I., Anderson, T., and Price, H.: Six ‘new’ episodes of trans-Pacific transport of air pollutants, Atmos. Env-iron., 37, 391–404, 2003a.
Jaffe, D., Prestbo, E., Swartzendruber, P., Weiss-Penzias, P., Kato, S., Takami, A., Hatakeyama, S., and Kajii, Y.: Export of atmo-spheric mercury from Asia, Atmos. Environ., 39, 3029–3038, 2005.
Jaffe, D., Price, H., Parrish, D., Goldstein, A., and Harris, J.: Increasing background ozone during spring on the west coast of North America, Geophys. Res. Lett., 30(12), 1613, doi:10.1029/2003GL017024, 2003b.
Kirchner, F., Mayer-Figge, A., Zabel, F., and Becker, K. H.: Ther-mal Stability of Peroxynitrates, Int. J. Chem. Kinet., 31, 127– 144, 1999.
Kotchenruther, R., Jaffe, D. A., Beine, H. J., Anderson, T. L., Bot-tenheim, J. W., Harris, J. M., Blake, D. R., and Schmitt, R.: Observations of ozone and related species in the northeast Pa-cific during the PHOBEA campaigns 2. Airborne observations, J. Geophys. Res., 106(D7), 7463–7483, 2001a.
Kotchenruther, R. A., Jaffe, D. A., and Jaegl´e, L.: Ozone pho-tochemistry and the role of peroxyacetyl nitrate in the spring-time northeastern Pacific troposphere: Results from the Photo-chemical Ozone Budget of the Eastern North Pacific Atmosphere (PHOBEA) campaign, J. Geophys. Res., 106(D22), 28 731– 28 742, 2001b.