HAL Id: hal-00304049
https://hal.archives-ouvertes.fr/hal-00304049
Submitted on 20 Mar 2008HAL is a multi-disciplinary open access
archive for the deposit and dissemination of sci-entific research documents, whether they are pub-lished or not. The documents may come from teaching and research institutions in France or abroad, or from public or private research centers.
L’archive ouverte pluridisciplinaire HAL, est destinée au dépôt et à la diffusion de documents scientifiques de niveau recherche, publiés ou non, émanant des établissements d’enseignement et de recherche français ou étrangers, des laboratoires publics ou privés.
Odin/OSIRIS observations of stratospheric NO3
through sunrise and sunset
C. A. Mclinden, C. S. Haley
To cite this version:
C. A. Mclinden, C. S. Haley. Odin/OSIRIS observations of stratospheric NO3 through sunrise and sunset. Atmospheric Chemistry and Physics Discussions, European Geosciences Union, 2008, 8 (2), pp.5901-5917. �hal-00304049�
ACPD
8, 5901–5917, 2008 OSIRIS observations of stratospheric NO3 C. A. McLinden and C. S. Haley Title Page Abstract Introduction Conclusions References Tables Figures ◭ ◮ ◭ ◮ Back CloseFull Screen / Esc
Printer-friendly Version Interactive Discussion Atmos. Chem. Phys. Discuss., 8, 5901–5917, 2008
www.atmos-chem-phys-discuss.net/8/5901/2008/ © Author(s) 2008. This work is distributed under the Creative Commons Attribution 3.0 License.
Atmospheric Chemistry and Physics Discussions
Odin/OSIRIS observations of
stratospheric NO
3
through sunrise and
sunset
C. A. McLinden1and C. S. Haley2
1
Environment Canada, Toronto, ON, M3H 5T4, Canada
2
Centre for Research in Earth and Space Science, York Univ., Toronto, ON, M3J 1P3, Canada Received: 17 January 2008 – Accepted: 13 February 2008 – Published: 20 March 2008 Correspondence to: C. A. McLinden ([email protected])
ACPD
8, 5901–5917, 2008 OSIRIS observations of stratospheric NO3 C. A. McLinden and C. S. Haley Title Page Abstract Introduction Conclusions References Tables Figures ◭ ◮ ◭ ◮ Back CloseFull Screen / Esc
Printer-friendly Version Interactive Discussion
Abstract
The nitrate radical (NO3) has been detected in visible limb-scattered spectra measured
by the Optical Spectrograph and InfraRed Imager System (OSIRIS) on-board the Odin satellite when observing at large solar zenith angles (91–97◦). Apparent slant column
densities of NO3at tangent heights between 10 and 45 km are derived via spectral fit-5
ting in the 590–680 nm window. Using observations from multiple scans spanning solar zenith angles of 91–97◦, the rapid evolution of NO
3through sunrise and sunset can be
traced. Slant column densities are found to be consistent with those simulated using a radiative transfer model with coupled photochemistry. In addition, a strong dependence of NO3 with temperature is observed. These results indicate that OSIRIS possesses
10
signal-to-noise sufficient to make useful measurements of scattered sunlight out to so-lar zenith angles of 96–97◦and suggests the possibility of retrieving profile information
for NO3and other species at large solar zenith angles.
1 Introduction
An important player in nighttime stratospheric photochemistry is the nitrate radical,
15
NO3. In the absence of sunlight, the following Reactions (R1)–(R3) largely govern the stratospheric NO3abundance:
O3+ NO2→ O2+ NO3 (R1)
NO3+ NO2+ M → N2O5+ M (R2)
N2O5+ M ↔ NO3+ NO2+ M (R3)
20
Since N2O5 may be converted to HNO3 on the surface of aerosols, NO3 represents a
key intermediary in the conversion of NOyfrom an active (NO and NO2) to an inactive
ACPD
8, 5901–5917, 2008 OSIRIS observations of stratospheric NO3 C. A. McLinden and C. S. Haley Title Page Abstract Introduction Conclusions References Tables Figures ◭ ◮ ◭ ◮ Back CloseFull Screen / Esc
Printer-friendly Version Interactive Discussion to sunset/sunrise in the stratosphere, photolysis rapidly destroys NO3, thereby
sup-pressing its abundance to a small fraction of its nighttime values. To date all successful measurements of stratospheric NO3have been made by sampling the atmosphere at
SZA&94◦. Figure 1 illustrates the evolution of NO
3 profiles calculated using the
Uni-versity of California, Irvine (UCI) photochemical box model (Prather,1992;McLinden
5
et al., 2000) through sunrise and sunset. At the onset of sunrise (SZA=97.8◦) NO 3
remains near its maximum nighttime value until there is direct illumination of the up-per stratosphere. At a SZA of 95.5◦, NO
3below 28 km remains at its maximum while
above this altitude there is substantial destruction from photolysis. At a SZA of ∼93◦,
NO3 is reduced by more than order of magnitude. The growth of NO3 begins as the
10
sun sets in the stratosphere but is delayed (relative to sunrise) due to the time constant of Reaction (R1).
Historically, ground-based lunar measurements (e.g.,Noxen et al.,1978;Wagner et
al.,2000) have been used most extensively to measure NO3. Stellar and lunar occulta-tion of NO3has also been successful in retrieving profiles (Renard et al.,2001,2005), 15
most recently with GOMOS (Global Ozone Measured by Occultation of Stars) (
Marc-hand et al.,2004). SCIAMACHY (SCanning Imaging Absorption SpectroMeter for At-mospheric CHartographY) (Amekudzi et al.,2005) and SAGE (Stratospheric Aerosol and Gas Experiment) III (R. Moore, personal communication, 2006) have proven capa-ble of retrieving NO3profiles via lunar occultation. Lunar and stellar systems are
advan-20
tageous since their light source is dim enough to not affect the NO3abundance. Other
ground-based systems, such as the off-axis zenith technique (e.g.,Weaver,1996), em-ploy the Sun as a source and observe during twilight. The key with all methods that measure Sunlight is to observe light that has traversed a range of SZAs in order to have a large enough photon signal to overcome noise but also to traverse local night
25
where NO3is abundant. All told there have been relatively few measurements of strato-spheric NO3made to date with only GOMOS providing large-scale, vertically-resolved
ACPD
8, 5901–5917, 2008 OSIRIS observations of stratospheric NO3 C. A. McLinden and C. S. Haley Title Page Abstract Introduction Conclusions References Tables Figures ◭ ◮ ◭ ◮ Back CloseFull Screen / Esc
Printer-friendly Version Interactive Discussion This work examines the utility of OSIRIS (Optical Spectrograph and InfraRed Imager
System) for sensing stratospheric NO3. OSIRIS, in orbit on the Odin satellite since
2001, measures sunlight scattered from the Earth’s limb from 7–70 km in tangent height and between 280 and 800 nm at 1 nm resolution (Llewellyn et al.,2004). While a limb-scatter instrument is not an obvious candidate for NO3 retrievals, Odin resides in a 5
Sun-synchronous, near-terminator orbit. This means OSIRIS, which was designed for observing at low light levels, generally observes near sunrise and sunset.
2 OSIRIS observations of NO3apparent Slant Column Densities
For the optimal NO3detection geometry, OSIRIS needs to look as far off the terminator
as possible in order to maximize the variation of the SZA along the line-of-sight (LOS).
10
Additionally, the scattering angle (or, the angle between the incoming sunlight and the OSIRIS LOS) must be a minimum so that OSIRIS is on the night side of the tangent point. This combination will increase photon signal due to the (relatively) small SZAs at the tangent point, and also increase the NO3 absorption signal as this light must then
traverse larger SZAs, and hence NO3abundances, on its way to OSIRIS. Using these 15
criteria the optimal period to observe NO3at sunrise is in December on the descending node (scattering angle of ∼74◦) and NO
3 at sunset is in June on the ascending node
(scattering angle of ∼58◦). This study will focus exclusively on these periods.
The spectral fitting routine ofHaley et al.(2004) was used to derive apparent slant column densities (SCDs) of NO3 between 10 and 45 km. The SCD represents the 20
number density weighted pathlength of the scattered sunlight through the atmosphere. Possible paths include single-scattered, multiple-scattered, as well as light reflected from the surface into the observing LOS. Considering the longer wavelengths (see below) and large SZAs, a large fraction of the detected light should originate from singly-scattered photons. The fitting window 590–680 nm was selected over the more
25
common 640–680 nm window as the additional pixels increased signal-to-noise and reduced correlations with other absorbers, particularly ozone. The two spectral
win-ACPD
8, 5901–5917, 2008 OSIRIS observations of stratospheric NO3 C. A. McLinden and C. S. Haley Title Page Abstract Introduction Conclusions References Tables Figures ◭ ◮ ◭ ◮ Back CloseFull Screen / Esc
Printer-friendly Version Interactive Discussion dows give very similar SCDs. For each scan the reference spectrum was obtained by
co-adding all spectra from that scan with tangent heights between 45 and 55 km. The NO3cross-sections at 298 K are scaled to a temperature of 230 K (Orphal et al.,2003).
Other species included in the spectral fit are ozone (221 K) (Bogumil et al.,2003), NO2 (202 K) (Vandaele et al.,1998), O4, and H2O (see below). Rayleigh, tilt/undersampling 5
(Sioris et al.,2003) and polarization (McLinden et al.,2002b) pseudo-absorbers were also included. A second-order closure polynomial was used and no correction for the Ring effect was performed as it has only a small effect in this region.
Water vapour cross-sections at 10 hPa and 243 K were derived using line parameters from HITRAN 2003 in a line-by-line code (Y. Rochon, personal communication, 2004)
10
and smoothed to the resolution of OSIRIS. It was found that including additional H2O cross-sections at other pressures and temperatures, or a pseudo-absorber for the H2O
temperature dependence (i.e., d σ/d T ) (Aliwell and Jones,1996) had little impact and so were not included. This is likely due to a very small contribution from multiple-scattered and surface-reflected light that has sampled the water-rich troposphere.
15
A representative spectral fit is shown in Fig. 2. The two largest NO3 absorption
features at 623 and 662 nm are clear. Based on the fitting residuals it is estimated that the detection limit is <5×1013cm−2for SZAs of 95◦
and smaller and 1×1014cm−2
for larger SZAs. Two sections of the spectra are excluded from the fit as they contain complex spectral features not easily accounted for: an unknown feature at 608 nm and
20
a combination of the red-line of atomic oxygen and the O−
2γ band near 630 nm.
In this study two periods of OSIRIS data were analyzed: (i) 1–21 December 2003 covering 94 orbits and (ii) 6 June–3 July 2004 covering 150 orbits. Sunrise in the December period covered a latitude band between 20◦N to 45◦N with a total of 380
scans, about 3–6 scans per orbit. Sunset in June occurred over the equator (5◦S to 25
10◦N) with 115 total scans, 2–4 per orbit. The June data is sparser due to OSIRIS
observing in so-called “strat-meso” mode in which limb scans extended up to 110 km (as opposed to the typical 70 km). All NO3 SCDs were interpolated onto a standard
ACPD
8, 5901–5917, 2008 OSIRIS observations of stratospheric NO3 C. A. McLinden and C. S. Haley Title Page Abstract Introduction Conclusions References Tables Figures ◭ ◮ ◭ ◮ Back CloseFull Screen / Esc
Printer-friendly Version Interactive Discussion rapid variation of NO3 with SZA, and recognizing that SZA changes by 0.5◦ to 0.8◦
over the course of a scan, each tangent height observation was sorted according to its particular SZA (as opposed to the representative SZA assigned to the scan). Thus, observations from a given scan often span two SZA bins. Only scans in which the minimum in signal-to-noise ratio between 10–45 km in the fitting window exceeded 10
5
were processed.
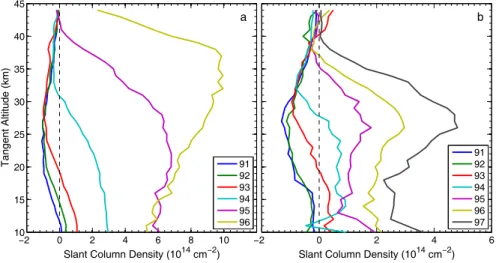
The mean SCDs in each bin are shown in Fig. 3 during sunrise and sunset. At a SZA of 96◦ during sunrise abundances are near their night-time levels but once the
sun rises, initially in the upper stratosphere, there is rapid destruction via photolysis. This destruction progresses downward as the sun rises further. At a SZA of 93◦ there 10
is only a small amount remaining near 12 km and at a SZA of 92◦ the SCDs do not
differ significantly from zero. At sunrise there is insufficient signal to obtain SCDs at a SZA of 97◦. During sunset there is essentially no NO
3 until a SZA of 94◦, where it
begins to form after the sun has set in the lower stratosphere. The peak SCD in the sunset data occurs lower than for sunrise, consistent with the model results in Fig.1.
15
In both sunrise and sunset there appears to be a small negative bias, −1×1014cm−2,
at the smallest SZAs. This was determined to be an effect of using the wider fitting window that includes the peak in the ozone absorption at 603 nm. That is, increasing the short wavelength end of the fitting window to, e.g., 610 nm, eliminates this feature. The precise reason for this behaviour is not known.
20
Note that significant SCDs exist at tangent heights in which the Sun is below the local horizon. For example, at 22 km sunset/sunrise occurs at a SZA of about 95◦. This
absorption signal arises from light scattered into the LOS on the far side of the tangent point where the SZAs are smaller (and hence experience direct illumination) that then traverses the NO3-abundant air on the near side of the tangent point. It is the range of
25
SZAs along a LOS that effectively smoothes the variation of SCD with tangent height, even when the local terminator is crossed.
ACPD
8, 5901–5917, 2008 OSIRIS observations of stratospheric NO3 C. A. McLinden and C. S. Haley Title Page Abstract Introduction Conclusions References Tables Figures ◭ ◮ ◭ ◮ Back CloseFull Screen / Esc
Printer-friendly Version Interactive Discussion
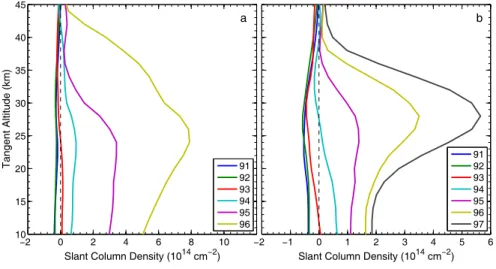
3 Modelling of NO3Slant Column Densities
While the observations presented in Fig. 3 appear to be qualitatively consistent with our knowledge of NO3, the question remains: are they quantitatively consistent? To address this, NO3 SCDs are forward-modelled using the VECTOR (Vector
Order-of-scattering Radiative Transfer) model (McLinden et al.,2002a,2006). VECTOR is
cou-5
pled to the UCI box model and takes into account the so-called diurnal effect (or, the variation of a diurnally varying species such as NO3along the line-of-sight with SZA)
(McLinden et al.,2006). The box model used a climatological atmosphere for the spec-ified month and latitude (McLinden et al.,2000) and reaction rate data from the JPL 2006 compendium (Sander et al.,2006). In order to adequately capture the rapid
vari-10
ation of NO3 with SZA the vertical grid in VECTOR was set to 0.5 km. Spectra were
generated at 0.1 nm resolution, smoothed to OSIRIS resolution, and then a spectral fit was applied, analogous to how the OSIRIS spectra were analysed. In this way syn-thetic SCDs are generated representative of the two periods: 15 December, 35◦N at
sunrise and 15 June, 0◦N at sunset. Each set of calculations was performed using a 15
range of SZAs and the observed mean scattering angle for that period and latitude. Note that neither VECTOR nor the photochemical model account for refraction. For a geometric tangent height of 30 km and SZA of 94◦, refraction reduces the tangent
height by about 2 km (e.g.,Uhl and Reddmann,2004).
Results from these simulations are presented in Fig.4for sunrise and sunset and are
20
analogous to the observations plotted in Fig.3. Overall, the magnitude and behaviour with SZA is very consistent between the modeled and observed SCDs. However, there appear to be some differences in the growth of NO3 after sunset (panel b), with
mod-eled SCDs lagging the observations by about 0–0.5◦. Likewise, the model calculations
seem to be systematically smaller during sunrise (panel a), and lead the observations
25
by 0.5–1◦. Possible reasons for this inconsistency include neglecting refraction in the
model, an inconsistent atmosphere (particularly ozone and temperature), or erroneous rate constants. Consistent with the observations, the modelled SCDs are slightly
neg-ACPD
8, 5901–5917, 2008 OSIRIS observations of stratospheric NO3 C. A. McLinden and C. S. Haley Title Page Abstract Introduction Conclusions References Tables Figures ◭ ◮ ◭ ◮ Back CloseFull Screen / Esc
Printer-friendly Version Interactive Discussion ative at SZAs of 92–93◦, again due to the inclusion of the peak in ozone absorption.
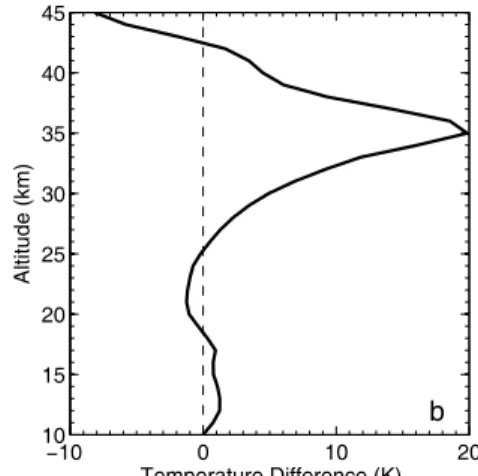
4 Case study: successive orbits on 7 December 2003
Scans from successive orbits on 7 December 2003 are examined in greater detail. SCDs from these orbits differ dramatically, sometimes by a factor of 3 or more. Two scans, one from each orbit, are shown in Fig.5 (panel a) along with their
uncertain-5
ties. Note the uncertainty, as determined by the spectral fitting, is ∼1×1014cm−2and is
much smaller than the signals. These two scans were taken at nearly identical latitudes (40◦N) and SZAs (95.5◦) and separated in longitude by 24◦. Scan 1 (orbit 15179, scan
021) SCDs are ∼10×1014cm−2larger than scan 2 (orbit 15180, scan 021) below 35 km,
but smaller above 38 km. The primary cause of this is thought to be the difference in
lo-10
cal temperature at the location of each scan. The temperature difference, from ECMWF reanalysis, is shown in Fig.5(panel b) where, between 30 and 40 km, scan 1 temper-atures are >5 K warmer, reaching a maximum of 20 K. As Reactions (R1) and (R3) are very temperature dependent, with warmer temperature favouring increased NO3,
the temperature profile is consistent with the SCDs. A 15 K increase in temperature
15
amounts to a factor of 2 increase in the rate coefficient for Reaction (R1) (Sander et al.,
2006). Likely adding to the differences are the ∼20% larger ozone SCDs in scan 1 (not shown) via Reaction (R1). The fact that the difference in SCD remains constant into the lower stratosphere reflects the fact that much of the absorption occurs in the upper stratosphere even at lower tangent heights. Above 42 km scan 1 is colder, roughly
cor-20
responding to the the altitudes where scan 1 displays smaller SCDs. Of course it must be kept in mind that temperature is a local quantity while SCDs, while heavily weighted towards their tangent point, are non-local.
The relatively small uncertainties and the overall consistent picture from these scans suggest that individual scans possess sufficient signal-to-noise that co-adding of
spec-25
tra is not necessary. Furthermore, the strong temperature dependence suggests the potential to derive atmospheric temperature information as has been successfully
car-ACPD
8, 5901–5917, 2008 OSIRIS observations of stratospheric NO3 C. A. McLinden and C. S. Haley Title Page Abstract Introduction Conclusions References Tables Figures ◭ ◮ ◭ ◮ Back CloseFull Screen / Esc
Printer-friendly Version Interactive Discussion ried out using GOMOS data (Marchand et al.,2007).
5 Conclusions
The nitrate radical (NO3) has been detected in visible limb-scattered spectra measured by the Optical Spectrograph and InfraRed Imager System (OSIRIS) on-board the Odin satellite when observing through sunrise and sunset in the stratosphere. Apparent
5
slant column densities of NO3 as a function of tangent height are derived via spectral fitting in the 590–680 nm window. Using observations from multiple scans spanning SZAs of 91–97◦ the rapid evolution of NO
3 through sunrise and sunset can be traced.
The derived slant column densities are consistent with those simulated using a radiative transfer model with coupled photochemistry. These results indicate that OSIRIS
pos-10
sesses signal-to-noise sufficient to make useful measurements of scattered sunlight out to SZAs of 96–97◦ and furthermore suggests the possibility of retrieving vertical
profiles of NO3density and other absorbers at these large SZAs by using the VECTOR
radiative transfer model coupled with the UCI photochemical box model in the inver-sion. The temperature dependence displayed by the SCDs also appears consistent
15
with the current theoretical understanding.
A logical next step is to test the consistency of OSIRIS NO3by finding coincidences
with SCIAMACHY, GOMOS, and/or SAGE III occultation measurements.
Acknowledgements. The author acknowledges the comments and insight of C. Sioris. Odin
is a Swedish-led satellite project funded jointly by Sweden (SNSB), Canada (CSA), France 20
(CNES) and Finland (Tekes). Odin is parially founded as a European Space Agency Third Party Mission.
References
Aliwell, S. R. and Jones, R. L.: Measurement of atmospheric NO31. Improved removal of water vapour absorption features in the analysis for NO , Geophys. Res. Lett., 23(19), 2585–2588,
ACPD
8, 5901–5917, 2008 OSIRIS observations of stratospheric NO3 C. A. McLinden and C. S. Haley Title Page Abstract Introduction Conclusions References Tables Figures ◭ ◮ ◭ ◮ Back CloseFull Screen / Esc
Printer-friendly Version Interactive Discussion
doi:10.1029/96GL02473, 1996. 5905
Amekudzi, L. K., Sinnhuber, B.-M., Sheode, N. V., Meyer, J., Rozanov, A., Lamsal, L. N., Bovensmann, H., and Burrows, J. P.: Retrieval of stratospheric NO3 vertical profiles from SCIAMACHY lunar occultation measurement over the Antarctic, J. Geophys. Res., 110, D20304, doi:10.1029/2004JD005748, 2005. 5903
5
Bogumil, K., Orphal, J., Homann, T., Voigt, S., Spietz, P., Fleischmann, O. C., Vogel, A., Hart-mann, M., Kromminga, H., BovensHart-mann, H., Frerick, J., and Burrows, J. P.: Measurements of molecular absorption spectra with the SCIAMACHY pre-flight model: Instrument charac-terization and reference data for atmospheric remote-sensing in the 230–2380 nm region, J. Photochem. Photobiol. A: Chem, 157(2–3), 167–184, doi:10.1016/S1010-6030(03)00062-5, 10
2003. 5905
Haley, C. S., Brohede, S. M., Sioris, C. E., Griffioen, E., Murtagh, D. P., McDade, I. C., Eriksson, P., Llewellyn, E. J., Bazureau, A., and Goutail, F.: Retrieval of stratospheric O3 and NO2 profiles from Odin/OSIRIS limb-scattered sunlight measurements, J. Geophys. Res., 109, D16303, doi:10.1029/2004JD004588, 2004. 5904
15
Llewellyn, E. J., Lloyd, N. D., Degenstein, D. A., Gattinger, R. L., Petelina, S. V., Bourassa, A. E., Wiensz, J. T., Ivanov, E. V., McDade, I. C., Solheim, B. H., McConnell, J. C., Haley, C. S., von Savigny, C., Sioris, C. E., McLinden, C. A., Griffioen, E., Kaminski, J., Evans, W. F. J., Puckrin, E., Strong, K., Wehrle, V., Hum, R. H., Kendall, D. J. W., Matsushita, J., Murtagh, D. P., Brohede, S., Stegman, J., Witt, G., Barnes, G., Payne, W. F., Pich ´e, L., Smith, 20
K., Warshaw, G., Deslauniers, D.-L., Marchand, P., Richardson, E. H., King, R. A., Wevers, I., McCreath, W., Kyr ¨ol ¨a, E., Oikarinen, L., Leppelmeier, G. W., Auvinen, H., M ´egie, G., Hauchecorne, A., Lef `evre, F., de La N ¨oe, J., Ricaud, P., Frisk, U., Sjoberg, F., von Sch ´eele, F., and Nordh, L.: The OSIRIS instrument on the Odin satellite, Can. J. Phys., 82(6), 411– 422, doi:10.1139/P04-005, 2004.5904
25
Marchand, M., Bekki, S., Hauchecorne, A., and Bertaux, J. L.: Validation of the self consistency of GOMOS NO3, NO2 and O3 data using chemical data assimilation, Geophys. Res. Lett., 31, L10107, doi:10.1029/2004GL019631, 2004. 5903
Marchand, M., Bekki, S., and Hauchecorne, A.: Temperature retrieval from stratospheric O3 and NO3 GOMOS data, Geophys. Res. Lett., 34, L24809, doi:10.1029/2007GL030280, 30
2007. 5909
McLinden, C. A., Olsen, S. C., Hannegan, B., Wild, O., Prather, M. J., and Sundet, J.: Strato-spheric ozone in 3-D models: A simple chemistry and the cross-tropopause flux, J. Geophys.
ACPD
8, 5901–5917, 2008 OSIRIS observations of stratospheric NO3 C. A. McLinden and C. S. Haley Title Page Abstract Introduction Conclusions References Tables Figures ◭ ◮ ◭ ◮ Back CloseFull Screen / Esc
Printer-friendly Version Interactive Discussion
Res., 105(D11), 14 653–14 665, 2000. 5903,5907
McLinden, C. A., McConnell, J. C., Griffioen, E., and McElroy, C. T.: A vector radiative transfer model for the Odin/OSIRIS project, Can. J. Phys., 80(4), 375–393, doi:10.1139/p01-156, 2002a.5907
McLinden, C. A., McConnell, J. C., Strong, K., McDade, I. C., Gattinger, R. L., King, R., Solheim, 5
B., Llewellyn, E. J., and Evans, W. F. J.: The impact of the OSIRIS grating efficiency on total radiance and trace-gas retrievals, Can. J. Phys., 80(4), 469–481, doi:10.1139/p01-151, 2002b. 5905
McLinden, C. A., Haley, C. S., and Sioris, C. E.: Diurnal effects in limb scatter observations, J. Geophys. Res., 111, D14302, doi:10.1029/2005JD006628, 2006. 5907
10
Noxon, J. F., Norton, R. B., and, Henderson, W. R.: Observation of atmospheric NO3, Geophys. Res. Lett., 5(8), 675–678, 1978.5903
Orphal, J., Fellows, C. E., and Flaud, P.-M.: The visible absorption spectrum of NO3 mea-sured by high-resolution Fourier Transform spectroscopy, J. Geophys. Res., 108(D3), 4077, doi:10.1029/2002JD002489, 2003. 5905
15
Prather, M.: Catastrophic loss of stratospheric ozone in dense volcanic clouds, J. Geophys. Res., 97(D9), 10 187–10 191, doi:10.1029/92JD00845, 1992. 5903
Renard, J.-B., Taupin, F. G., Rivi `ere, E. D., Pirre, M., Huret, N., Berthet, G., Robert, C., Chartier, M., Pepe, F., and George, M.: Measurements and simulation of stratospheric NO3 at mid and high latitudes in the Northern Hemisphere, J. Geophys. Res., 106(D3), 32 387–32 400, 20
doi:10.1029/2001JD000361, 2001. 5903
Renard, J.-B., Chipperfield, M. P., Berthet, G., Goffinont-Taupin, F., Robert, C., Chartier, M., Roscoe, H., Feng, W., Rivi `ere, E., and Pirre, M.: NO3 vertical profile measurements from remote sensing balloon-borne spectrometers and comparison with model calculations, J. Atmos. Chem., 51, 65–78, doi:10.1007/s10874-005-5983-8, 2005. 5903
25
Sander, S. P., Friedl, R. R., Ravishankara, A. R., Golden, D. M., Kolb, C. E., Kurylo, M. J., Molina, M. J., Moortgat, G. K., Keller-Rudek, H., Finlayson-Pitts, B. J., Wine, P. H., Huie, R. E., and Orkin, V. L.: JPL 2006: Chemical kinetics and photochemical data for use in atmospheric studies – Evaluation 15, Jet Propul. Lab., Pasadena, Calif., JPL Publ. 06-2, 2006. 5907,5908
30
Sioris, C. E., Haley, C. S., McLinden, C. A., von Savigny, C., McDade, I. C., McConnell, J. C., Evans, W. F. J., Lloyd, N. D., Llewellyn, E. J., Chance, K. V., Kurosu, T. P., Murtagh, D. P., Frisk, U., Pfeilsticker, K., B ¨osch, H., Weidner, F., Strong, K., Stegman,
ACPD
8, 5901–5917, 2008 OSIRIS observations of stratospheric NO3 C. A. McLinden and C. S. Haley Title Page Abstract Introduction Conclusions References Tables Figures ◭ ◮ ◭ ◮ Back CloseFull Screen / Esc
Printer-friendly Version Interactive Discussion
J., and M ´egie, G.: Stratospheric profiles of nitrogen dioxide observed by Optical Spectro-graph and Infrared Imager System on the Odin satellite, J. Geophys. Res., 108(D7), 4215, doi:10.1029/2002JD002672, 2003. 5905
Uhl, R. and Reddmann, T.: Divergence of sun-rays by atmospheric refraction at large solar zenith angles, Atmos. Chem. Phys., 4, 1399–1405, 2004,
5
http://www.atmos-chem-phys.net/4/1399/2004/. 5907
Vandaele, A., Hermans, C., Simon, P. C., Carleer, M., Colin, R., Fally, S., M ´erienne, M. F., Jenouvrier, A., and Coquart, B.: Measurements of the NO2 absorption cross-section from 42,000 cm−1 to 10,000 cm−1 (238–1000 nm) at 220 K and 294 K, J. Quant. Spectrosc. Ra.,
59(3–5), 171–184, doi:10.1016/S0022-4073(97)00168-4, 1998. 5905
10
Wagner, T., Otten, C., Pfeilsticker, K., Pundt, I., and Platt, U.: DOAS moonlight observa-tion of atmospheric NO3 in the Arctic winter, Geophys. Res. Lett., 27(21), 3441–3444, doi:10.1029/1999GL011153, 2000. 5903
Weaver, A.: Atmospheric NO35. Off-axis measurements at sunrise: Estimates of tropospheric NO3 at 40◦N, J. Geophys. Res., 101(D13), 18 605–18 612, doi:10.1029/96JD01537, 1996.
15
ACPD
8, 5901–5917, 2008 OSIRIS observations of stratospheric NO3 C. A. McLinden and C. S. Haley Title Page Abstract Introduction Conclusions References Tables Figures ◭ ◮ ◭ ◮ Back CloseFull Screen / Esc
Printer-friendly Version Interactive Discussion 0 5 10 15 20 10 15 20 25 30 35 40 45 Number Density (106 cm−3) Al ti tu d e (km) (a) 91 92 93 94 95 96 97 0 2 4 6 8 10 12 Number Density (106 cm−3) (b) 91 92 93 94 95 96 97 −
Fig. 1. Diurnal variation of NO3as calculated in the photochemical box model: (a) sunrise on 15 December at 35◦N and (b) sunset on 15 June at 0◦N. At a SZA of 95.5◦ altitudes above
∼25 km are directly illuminated (neglecting refraction).
ACPD
8, 5901–5917, 2008 OSIRIS observations of stratospheric NO3 C. A. McLinden and C. S. Haley Title Page Abstract Introduction Conclusions References Tables Figures ◭ ◮ ◭ ◮ Back CloseFull Screen / Esc
Printer-friendly Version Interactive Discussion − − 590 600 610 620 630 640 650 660 670 680 −5 0 5 10 15x 10 −3 Wavelength (nm) O p ti ca l D e p th Fit+Residual Fit
Fig. 2. Results of a spectral fit. Shown are the fitted NO3 optical depth spectra and the fitted NO3plus the residual of the fit for scan 15179021 (7 December 2003; tangent height=39 km; latitude=40◦N; longitude=47◦E; SZA=95.4◦). The fitted SCD is 7.2×1014cm−2 and the
RMS-residual (over wavelength) is 0.0027. Regions near 608 nm and 630 nm are not included in the fit (see text).
ACPD
8, 5901–5917, 2008 OSIRIS observations of stratospheric NO3 C. A. McLinden and C. S. Haley Title Page Abstract Introduction Conclusions References Tables Figures ◭ ◮ ◭ ◮ Back CloseFull Screen / Esc
Printer-friendly Version Interactive Discussion
−2 0 2 4 6
Slant Column Density (1014 cm−2)
b 91 92 93 94 95 96 97 −2 0 2 4 6 8 10 10 15 20 25 30 35 40 45
Slant Column Density (1014 cm−2)
T a n g e n t Al ti tu d e (km) a 91 92 93 94 95 96
Fig. 3. Mean OSIRIS NO3 apparent slant column densities as a function of tangent altitude for (a) sunrise in the stratosphere over 1–21 December 2003 (20–45◦N) and (b) sunset in the
stratosphere over 6 June–3 July 2004 (5◦S–10◦N).
ACPD
8, 5901–5917, 2008 OSIRIS observations of stratospheric NO3 C. A. McLinden and C. S. Haley Title Page Abstract Introduction Conclusions References Tables Figures ◭ ◮ ◭ ◮ Back CloseFull Screen / Esc
Printer-friendly Version Interactive Discussion − − − − −2 0 2 4 6 8 10 10 15 20 25 30 35 40 45
Slant Column Density (1014 cm−2)
T a n g e n t Al ti tu d e (km) a 91 92 93 94 95 96 −2 −1 0 1 2 3 4 5 6
Slant Column Density (1014 cm−2)
b 91 92 93 94 95 96 97
Fig. 4. Modelled NO3apparent slant column densities as a function of tangent altitude for (a) sunrise in the stratosphere on 15 December (35◦N) and (b) sunset in the stratosphere on 15
ACPD
8, 5901–5917, 2008 OSIRIS observations of stratospheric NO3 C. A. McLinden and C. S. Haley Title Page Abstract Introduction Conclusions References Tables Figures ◭ ◮ ◭ ◮ Back CloseFull Screen / Esc
Printer-friendly Version Interactive Discussion 0 5 10 15 20 10 15 20 25 30 35 40 45
Slant Column Density (1014 cm−2)
T a n g e n t H e ig h t (km) a Scan 1 Scan 2 −10 0 10 20 10 15 20 25 30 35 40 45 Temperature Difference (K) Al ti tu d e (km) b
Fig. 5. Comparison of two scans on consecutive orbits (scan 1: scan 15179021 at latitude 39.9◦N and SZA of 95.5◦; scan 2: scan 15180021 at latitude 40.0◦N and SZA of 95.6◦): (a)
NO3 slant column densities (SCDs), including their uncertainty from the spectral fit, (b) the difference between the scan 1 and scan 2 ECMWF temperature profiles, T (scan 1)–T (scan 2).


![[PDF] Apprendre la programmation Android avec base de données - Free PDF Download](data:image/gif;base64,R0lGODlhAQABAIAAAP///wAAACH5BAEAAAAALAAAAAABAAEAAAICRAEAOw==)