HAL Id: hal-03242536
https://hal.archives-ouvertes.fr/hal-03242536
Submitted on 2 Jun 2021
HAL is a multi-disciplinary open access
archive for the deposit and dissemination of
sci-entific research documents, whether they are
pub-lished or not. The documents may come from
teaching and research institutions in France or
abroad, or from public or private research centers.
L’archive ouverte pluridisciplinaire HAL, est
destinée au dépôt et à la diffusion de documents
scientifiques de niveau recherche, publiés ou non,
émanant des établissements d’enseignement et de
recherche français ou étrangers, des laboratoires
publics ou privés.
Systematics and accuracy of VLBI astrometry: A
comparison with Gaia Data Release 2
N. Liu, S. Lambert, Z. Zhu, J.-C. Liu
To cite this version:
N. Liu, S. Lambert, Z. Zhu, J.-C. Liu. Systematics and accuracy of VLBI astrometry: A comparison
with Gaia Data Release 2. Astronomy and Astrophysics - A&A, EDP Sciences, 2020, 634, pp.A28.
�10.1051/0004-6361/201936996�. �hal-03242536�
A&A 634, A28 (2020) https://doi.org/10.1051/0004-6361/201936996 c ESO 2020
Astronomy
&
Astrophysics
Systematics and accuracy of VLBI astrometry: A comparison with
Gaia Data Release 2
N. Liu
1,2(
刘牛), S. B. Lambert
2, Z. Zhu
1(
朱紫), and J.-C. Liu
1(
刘佳成)
1 School of Astronomy and Space Science, Key Laboratory of Modern Astronomy and Astrophysics (Ministry of Education),
Nanjing University, 163 Xianlin Avenue, 210023 Nanjing, PR China e-mail: [email protected]; [email protected]
2 SYRTE, Observatoire de Paris, Université PSL, CNRS, Sorbonne Université, LNE, Paris, France
e-mail: [email protected]
Received 25 October 2019/ Accepted 13 December 2019
ABSTRACT
Context.The third generation of the ICRF – ICRF3 – was published in 2018. This new fundamental catalog provides radio source positions measured independently at three bands: S /X, K, and X/Ka, representing three independent radio celestial frames which altogether constitute a multi-frequency ICRF.
Aims.We aim to investigate the overall properties of the ICRF3 with the help of the Gaia Data Release 2 (Gaia DR2). This could serve as an external check of the quality of the ICRF3.
Methods.The radio source positions of the ICRF3 catalog were compared with the Gaia DR2 positions of their optical counterparts at G < 18.7. Their properties were analyzed in terms of the dependency of the quoted error on the number of observations, on the declination, and the global difference, the latter revealed by means of expansions in the vector spherical harmonics.
Results.The ICRF3 S /X-band catalog shows a more smooth dependency on the number of observations than the ICRF1 and ICRF2, while the K and X/Ka-band yield a dependency discrepancy at the number of observations of ∼50. The rotation of all ICRF catalogs show consistent results, except for the X-component of the X/Ka-band which arises from the positional error in the non-defining sources. No significant glides were found between the ICRF3 S /X-band component and Gaia DR2. However, the K- and X/Ka-band frames show a dipolar deformation in Y-component of+50 µas and several quadrupolar terms of 50 µas in an absolute sense. A significant glide along Z-axis exceeding 200 µas in the X/Ka-band was also reported. These systematics in the ICRF catalog are shown to be less dependent on the limiting magnitude of the Gaia sample when the number of common sources is sufficient (>100).
Conclusions.The ICRF3 S /X-band catalog shows improved accuracy and systematics at the level of noise floor. But the zonal errors in the X/Ka-band should be noted, especially in the context of comparisons of multi-frequency positions for individual sources.
Key words. techniques: interferometric – astrometry – reference systems
1. Introduction
The celestial reference frame (CRF) is a cornerstone of several scientific domains connected to astrometry and geosciences. In its current realization by very long baseline interferome-try (VLBI), the third generation of the International Celestial Reference Frame (ICRF3) is represented by precise positions of thousands of extragalactic radio sources (Charlot 2019). In contrast to its predecessors, which are the ICRF1 (Ma et al. 1998) and ICRF2 (Fey et al. 2015) achieved only at the S/X-band, the ICRF3 contains radio source positions at three bands: S /X, K, and X/Ka. An accurate CRF opens the doors to millimeter-level geodetic measurements (e.g., Earth rotation), insights into the Earth internal structure (e.g., Mathews et al. 2002), and testing of General Relativity and alternative the-ories with VLBI (Le Poncin-Lafitte et al. 2016, and refer-ences therein). The arrival of the Gaia Celestial Reference Frame (Gaia-CRF2, Gaia Collaboration 2016, 2018a) – the first time that one can compare two independent CRF realiza-tions with similar high accuracies – also allows comparisons between the positions of the common objects at several fre-quencies, bringing insights into the physics of quasars (e.g.,
Kovalev et al. 2017), reference frames (e.g., Lambert 2014),
and complex structures made of one or several black holes (e.g., Roland et al. 2015).
Geodetic VLBI measures positions of thousands of radio sources since 1979.Fey et al.(2015) determined an internal pre-cision of the ICRF2 and claimed a noise floor (best positional accuracy) of 40 µas and remarked that the stability of the ICRF axes is close to 10 µas.Charlot(2019) claimed the noise floor of the ICRF3 to be of 30 µas, which was later validated in
Liu et al.(2018a). However, no other detailed information has
been revealed yet.
The ICRF3 started to serve as the fundamental catalogs for astrometry, geodesy, and navigation since the beginning of 2019. This situation will remain consistent over the next several years until the release of the next generation of the ICRF. It is, there-fore, necessary to study its overall properties carefully, espe-cially the consistence between CRFs at different wavelengths. Such work would also provide hints on the link between ICRF and Gaia-CRF in the next data release of the Gaia mission.
This work aims to study the overall properties of the ICRF3 with the help of the Gaia Data Release 2 (Gaia DR2,
Gaia Collaboration 2018b). It could serve as an external check
of the quality of the ICRF3 to validate the improvements of the S/X-band frame and reveal possible systematic errors if there
Table 1. Statistics of the ICRFs.
Noise floor Axis stability All sources Defining sources
µas µas All South North All South North
ICRF1 250 20 608 266 342 212 58 154
ICRF2 40 10 3414 1383 2031 295 133 162
ICRF3 S /X 30 – 4536 1921 2625 303 154 149
ICRF3 K – – 824 373 451 193 99 94
ICRF3 X/Ka – – 678 361 317 176 89 87
Notes. A dash (“–”) means that the corresponding value is not given or documented yet. The last 6 columns give the number of sources in each group for all sources and defining sources only.
are any. The three components of the ICRF3 catalog represent realizations of the ICRF3 at three bands, that is, they make up the ICRF3 altogether. However in this work, we prefer to treat them as the independent CRFs. Another intention of this work is to check the consistencies amongst three CRFs.
2. Catalogs
In this work, we used the ICRF catalogs available at the Paris Observatory IERS ICRS Center1. Historical ICRF catalogs
ICRF1 and ICRF2 were included in the comparison in order to justify the improvements made at the S /X-band. Table1 summa-rizes the statistical information of ICRFs. The noise floor given in the first column represents the best position precision of individ-ual sources, which is claimed to be 30 µas for ICRF3 S /X-band frame but not clear for ICRF3 K- and X/Ka-band frames. The axis stability shown in the second column characterizes how sta-ble the orientation of each reference axis is. The last two columns give the number of defining sources in the northern and south-ern hemispheres, which are nearly the same for the ICRF3 cata-logs (all three parts). It indicates a better balance on the defining source number in the south and north of ICRF3 than ICRF2.
We used the gaiadr2.aux_iers_gdr2_cross_id sample from Gaia DR2 archive2as the reference catalog. This data set, might be called ICRF3-prototype subset, provides optical posi-tions for 2820 ICRF sources. It was used for aligning the Gaia-CRF2 onto a prototype solution of the ICRF3 (Gaia Collaboration
2018a). Even though more optical counterparts of ICRF sources
could be found by cross-matching radio catalogs with the full quasar sample or the main catalog in the Gaia DR2, we pre-ferred to use this carefully identified catalog to avoid additional errors introduced by the cross-match process. Since we were dealing with a global feature, we believed that adding a few more common objects in the comparison would not alter our results.
A good reference sample will benefit the catalog compari-son and help to clearly see the systematics in the ICRF catalogs. The accuracy of Gaia DR2 depends strongly on the magnitude, that is, brighter quasars tend to have positions with better formal uncertainties (Gaia Collaboration 2018a). However, if we limit the sample to the bright quasars only, the sample will surely become smaller. The trade-off between size and data quality is chosen to be at G < 18.7, where the sample size is 1288, about half of the ICRF3-prototype subset but the median positional uncertainty is twice better than the full population. In the rest of this paper, for brevity, we will use the term “Gaia DR2” to
1 http://hpiers.obspm.fr/icrs-pc/newwww/index.php
2 http://gea.esac.esa.int/archive/
represent this subset, although it is a small fraction of the whole GaiaDR2 catalog. The influence of the reference sample selec-tion on the results is discussed in Sect.3.4.
In the compiling process of the ICRF3 catalog, the Galac-tic aberration effect has been modeled as a dipolar proper motion field toward the Galactic center with an amplitude of 5.8 µas yr−1. As a result, the ICRF3 position is referred to the epoch J2015.0. This is a new feature of the ICRF3. The refer-ence epoch for the Gaia DR2 position is J2015.5, 0.5 yr later than the ICRF3. The positional offset introduced by the Galac-tic aberration effect accumulated in half a year is about 3 µas, insignificant relative to the position formal errors of the Gaia DR2 and ICRF3. This small positional difference will be, there-fore, ignored in the following analysis.
When considering the Galactic aberration effect, the source position in the ICRF1 and ICRF2 catalogs should be actually referred to their mean observing epoch. The direct comparison of the ICRF1/ICRF2 position with the Gaia DR2 would be influ-enced by the position offset resulted from the Galactic aber-ration effect accumulated in the time span between the mean observing epoch of individual source and J2015.5. This issue could be solved by propagating the ICRF1/ICRF2 positions from their mean observing epoch to J2015.5 using the Galactic aber-ration induced proper motion, or by propagating the Gaia DR2 position to the mean observing epoch for each source in the ICRF1/ICRF2 via their Gaia DR2 proper motion. We decided to keep the radio source position in the ICRF1/ICRF2 catalogs unchanged and directly compared it with the Gaia DR2 one. It could preserve the origin features of the ICRF1 and ICRF2 and avoid possible errors propagated from the proper motion system of the Gaia DR2.
3. Results and discussion
3.1. Positional error
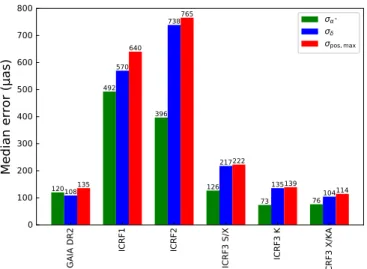
The positional errors for ICRF catalogs and Gaia DR2 subset were characterized by median formal uncertainties in the right ascension (times cosine declination), declination, and along the major axis of error ellipse. The semi-major axis of error ellipse, denoted as σpos,max as done in Gaia Collaboration (2018a) to characterize the overall positional error, was calculated with inclusion the correlation between the right ascension and dec-lination. Figure 1 depicts these three quantities for the Gaia DR2 sample and ICRF catalogs. For the Gaia DR2 sample, the median formal uncertainty is at the same level for right ascen-sion and declination, which is of about 100 µas. In contrast, all the ICRF catalogs present a better precision in the right ascen-sion than in the declination; it is nearly twice better for the ICRF2, ICRF3 S /X-band, and K-band. This is a typical feature
N. Liu et al.: Systematics and accuracy of ICRF GA IA DR 2 ICR F1 ICR F2 ICR F3 S/ X ICR F3 K ICR F3 X/ KA 0 100 200 300 400 500 600 700 800
Me
dia
e
rro
r (
μa
sμ
120 492 396 126 73 76 108 570 738 217 135 104 135 640 765 222 139 114 σα* σδ σpos,maxFig. 1.Formal errors of 1288 ICRF sources at G < 18.7 in Gaia DR2
and all sources in ICRF catalogs. The formal error in the right ascension is calculated as σα∗= σαcos δ.
of the VLBI measurements. The median formal error of ICRF2 declination is even larger than the ICRF1, possibly due to the inclusion of the so-called Very Long Baseline Array (VLBA) Calibrator sources (VCS sources) that were observed usually less than 100 times. If we removed all VCS sources from the ICRF2 catalog, the median error for the remained sources would be reduced to 130 µas for right ascension and 194 µas for dec-lination. Thanks to the re-observations of these VCS sources (VCS-II;Gordon et al. 2016) which greatly improved the posi-tion precisions, the formal uncertainty of the ICRF3 S /X is nearly three times better than the ICRF2. The ICRF3 S /X posi-tion shows a comparable (formal) uncertainty to the Gaia DR2 in the right ascension but nearly twice worse in the declination. Another feature is that the VLBI position precision improves as the observing frequency goes higher. The X/Ka-band catalog could be the most precise catalog in terms of the median formal error.
The diagram in Fig.2presents the distribution of the posi-tional uncertainty as a function of the number of observations for the ICRFs and Gaia DR2 sample. Sources in the ICRF cat-alogs are labeled by their category specified in each catalog. The number of observations is represented by counting the num-ber of used group delays, denoted as Ndelay, in the ICRF cat-alog compilation and the along-scan individual CCD measure-ments (column “astrometric_n_obs_al” in the Gaia archive) in the Gaia DR2. We can find that the Gaia observes quasars uniformly, at a frequency of about 100–400 times, which is attributed to its well-designed scanning law. As a result, the posi-tional errors of ICRF sources in the Gaia DR2 are at a simi-lar level of several tenths of mas. On the contrary, the VLBI observation (delay) count ranges from single digit to over half a million at the S /X-band, leading to a less uniform accuracy. The maximum observation per source is ∼4000 at K-band and ∼300 at X/Ka-band, at least two orders smaller than that at the S/X-band (∼400 000). However, the best achieved (least) formal uncertainty at K-band and X/Ka-band is better than S /X-band. This result justifies again the strength of observing at high fre-quencies. The typical number of observations per source is about 100–400 for S /X-band, 400–600 for K-band, and 100–150 for X/Ka-band.
For ideal measurements, the formal error will fall down fol-lowing a trend of 1/√Nobs, where Nobsis the number of
observa-tions, as Nobsincreases. However, it is not the case for datasets shown in Fig.2. All the ICRF catalogs show a non-Gaussian distribution at the rich-observation end. This non-Gaussianity is caused by (i) correlated errors that become dominant as the thermal error (1/N2
obs) becomes lower for large Nobs, and (ii) the inflation of the formal error. The horizontal tail of the ICRF1, ICRF2, and ICRF3 S /X catalogs results from adjustment of a noise floor that is 250 µas, 40 µas, and 30 µas, respectively (Ma et al. 1998;Fey et al. 2015;Charlot 2019).
There are two features that need to be pointed out. One is that some well-observed sources deviate from the main trend and yield bad positional precisions in the ICRF1 (“Other” source) and ICRF2 (“Non-VCS” sources, mostly known as 39 special-handling sources). But such an inconsistency disappears in the ICRF3 S /X-band catalog which yields a smooth relation. It could be regarded as an improvement of the ICRF3 S /X-band besides the reduce of the noise floor. Another feature is that a clear dependency break is found in the ICRF3 K- and X/Ka-band, which happens at the number of observations of ∼50 for K-band and ∼40 for X/Ka-band. This discrepancy leads to a formal uncertainty “jump” and the dependency of the formal uncertainty could be better represented by two power-law slopes. Examination of the data reveals that sources at Ndelay < 50 mostly fall in the region of δ < −40◦, where the dominated network at K-band, the VLBA network, cannot cover. There-fore, it demonstrates a clear effect of K-band observing network geometry. Similar results can be found for X/Ka-band, where the bulk of sources with a number of observations less than 40 locates in the far-southern hemisphere and is hard to be observed by the two main baselines, from Goldstone (California) to Rob-ledo (Spain) and from Goldstone to Tidbinbilla (Australia), in the X/Ka-band. As a result, observations in the south at K-and X/Ka-bK-and should be strengthened for the sake of reduc-ing the north-south asymmetry in observations. With more uni-form observations, the K-band and X/Ka-band will surely be improved, regarding the case of S /X-band.
3.2. Declination-dependent error
As mentioned in Sect. 3.1, the south-north asymmetry in the formal uncertainty is a typical VLBI feature. Thus we investi-gated the dependency of the position formal uncertainty in the ICRF and Gaia data on the declination. The sources were sorted according to the declination from south to north and binned by every certain number of sources. Figure3 demonstrates the median formal errors in each bin as a function of declination. The bin size was set as 20 for the ICRF1, ICRF3 K-band, and X/Ka-band, along with 50 for other catalogs. The Gaia DR2 formal errors are generally homogeneous over the declination, of about 100 µas in both the right ascension and declination, except small increases near the equator. On the other hand, all the ICRF catalogs show a similar declination-dependency: a bump (worst precision) appears at about −45◦ and the formal error decreases as going north until 30◦ then increases slightly. This feature is more clear as seen from the formal error in the decli-nation. The decreasing dependency shown in the ICRF1/ICRF2 becomes smoother in the three catalogs of ICRF3, especially in the right ascension. For sources at δ > −15◦ in the ICRF3 catalogs at all frequencies, there is generally no declination dependency of the formal uncertainty in the right ascension component. However, declination formal error of ICRF3 cata-logs still show a decreasing trend on the declination, with an exception of ICRF3 X/Ka showing a smooth dependency in the north of −45◦. This deficiency of ICRF3 three components, A28, page 3 of10
Fig. 2.Positional errors as a function of the number of observations for 1288 ICRF sources at G < 18.7 in Gaia DR2 and all sources in ICRF catalogs. The positional error is computed as the semi-major axis of error ellipse using Eq. (1) inGaia Collaboration(2018a). Sources in the ICRF catalogs are labeled by their category specified in each catalog. The black solid line indicates the power-slope from a Gaussian distribution. The number of observation is represented by the column astrometric_n_obs_al in the Gaia DR2 and the number of delays in the ICRF catalogs.
again, reflects the weakness of the VLBI network geometry in the south.
In principle, the Gaia scanning-law is not expected to gener-ate a declination-dependent error or declination systematic error. Figure3 already demonstrates that Gaia error is homogeneous over the declination. If only looking at the sources in each ICRF catalog in common with Gaia sample, we find similar relations
of positional uncertainty on the declination for ICRF and Gaia samples shown in Fig.3. As a result, we can compare the ICRF positions with respect to the Gaia DR2 positions in order to reveal possible declination-dependent (zonal) errors in the ICRF catalogs.
Figure4illustrates the median differences in the right ascen-sion and declination of ICRF catalogs with respect to the Gaia
N. Liu et al.: Systematics and accuracy of ICRF 102 103 σα * ( μa sμ Gaia DR2 ICRF1 ICRF2 ICRF3 S/X ICRF3 K ICRF3 X/Ka 90 60 30 0 30 60 90 Declination (∘μ 102 103 σδ ( μa sμ Gaia DR2 ICRF1 ICRF2 ICRF3 S/X ICRF3 K ICRF3 X/Ka
Fig. 3.Formal errors in the right ascension (times cosine declination,
top) and declination (bottom) as a function of declination for the ICRF sources at G < 18.7 in Gaia DR2 and all sources in ICRF catalogs. In the right ascension the formal error is calculated as σα∗= σαcos δ. The
shown formal error is the median of bins by every certain number of sources for the sake of clarity. The bin size was chosen to be 20 for the ICRF1, ICRF3 K-, and X/Ka-band, along with 50 for other catalogs.
DR2 sample for common sources. Sources were sorted and binned by the same way as in Fig.3, but different bin size was chosen; it was set to be 10 for the ICRF1, ICRF3 K-band, and X/Ka-band, along with 25 for other catalogs. Some data points of ICRF1 and ICRF2 are beyond the frame but all less than 1 mas. On the right ascension, all the ICRF catalogs show consis-tent results within 200 µas with the Gaia DR2 except the ICRF3 X/Ka-band; it yields a sinusoidal-like pattern with an amplitude of approximately 200 µas. On the contrary, the ICRF declina-tions vary a lot. A positive bias can be found in the ICRF1 and ICRF2 catalogs in the southern hemisphere, as reported in previous studies (e.g., Mignard et al. 2016;Liu et al. 2018b;
Frouard et al. 2018). The agreement between the ICRF3 S /X
and Gaia DR2 declinations is about 200 µas but no pattern could be found. The ICRF3 K-band catalog also presents a nearly ran-dom difference with respect to Gaia solution. These high con-sistencies amongst Gaia DR2, ICRF3 S /X-band, and K-band are satisfactory and justify the quality of all these three datasets. However, the most obvious deviation from the Gaia DR2 comes from the ICRF3 X/Ka-band catalog; it shows a negative offset as large as about ∼600 µas at the regions around δ = −45◦and δ = −15◦. This anomalous behavior is possibly due to the weak southern geometry of the X/Ka-band network, indicating con-spicuous zonal errors in the ICRF3 X/Ka-band frame. There-fore, it is necessary to use a more detailed numerical analysis to quantify this systematics.
−600 −400 −200 0 200 400 600 Δ α *Δ( a sμ ICRF1 ICRF2 ICRF3ΔS/X ICRF3ΔK ICRF3ΔX/Ka −90 −60 −30 0 30 60 90 DeclinationΔ(∘μ −600 −400 −200 0 200 400 600 Δ δΔ ( asμ ICRF1 ICRF2 ICRF3ΔS/X ICRF3ΔK ICRF3ΔX/Ka
Fig. 4. Differences in the right ascension (times cosine declination,
top) and declination (bottom) as a function of declination for common sources between the Gaia DR2 subset and ICRF catalogs. The right ascension difference is calculated as ∆α∗= ∆α cos δ. The shown
differ-ence is the median of bins by every certain number of sources for the sake of clarity. The bin size was chosen to be 10 for the ICRF1, ICRF3 K-, and X/Ka-band, along with 25 for other catalogs.
3.3. Systematics
The systematical difference shown in Fig.4can be modeled by a set of vector spherical harmonics (VSH;Mignard & Klioner 2012). Here we use the VSH of the first two orders to represent the global systematical differences, as described by the following equations:
∆α∗ = −R
1cos α sin δ − R2sin α sin δ+ R3cos δ −D1sin α+ D2cos α
+M2,0sin 2δ
− cos 2δ (MRe2,1cos α − MIm2,1sin α) + sin δ (ERe 2,1sin α+ E Im 2,1cos α) − sin 2δ (MRe 2,2cos 2α − M Im 2,2sin 2α) −2 cos δ (ERe 2,2sin 2α+ E Im 2,2cos 2α), ∆δ = +R1sin α − R2cos α
−D1cos α sin δ − D2sin α sin δ+ D3cos δ +E2,0sin 2δ
− sin δ (MRe2,1sin α+ M2,1Imcos α) − cos 2δ (E2,1Recos α − EIm2,1sin α) +2 cos δ (MRe 2,2sin 2α+ M Im 2,2cos 2α) − sin 2δ (ERe 2,2cos 2α − E Im 2,2sin 2α), (1)
where ∆α∗ = ∆α cos δ. The first degree harmonics consists of a rotation vector R = (R1, R2, R3)T and a glide vector A28, page 5 of10
101 103 105 ρ (μ asμ ICRF1 Candidate Other Defining 101 103 105 ρ (μ asμ ICRF2 VCS-only Non-VCS Defining 101 103 105 ρ (μ asμ ICRF3 S/X Other Defining 101 103 105 ρ (μ asμ ICRF3 K Other Defining 10−2 10−1 100 101 102
Normalized se eration
X 101 103 105 ρ (μ as) ICRF3μX/Ka Other DefiningFig. 5.Angular separation and normalized separation between the Gaia
DR2 and ICRF catalogs for common sources at G < 18.7. The hor-izontal gray line and vertical one indicates the upper limit of 10 mas on the angular separation and of X0 on the normalized separation,
respectively.
D= (D1, D2, D3)T. The rotation vector R characterizes the ori-entation between celestial frames, that is, how well these frames share the same reference axes. The glide vector D, on the other hand, reveals the dipolar deformation or zonal errors in the celes-tial frame. As for the second degree, E and M stands for the VSH functions of electric and magnetic types, respectively. These terms, also called quadrupole terms, are usually associated with the zonal errors in the catalog.
Before addressing the systematics, we needed to remove outliers, say, the radio sources with a significant position o ff-set between VLBI and Gaia that cannot be explained by its formal error. These large discrepancies could result from the underestimated formal errors, misidentification, or genuine core-shift effect (e.g.,Makarov et al. 2019; Kovalev et al. 2017). To remove these sources, we used the angular separation ρ and X-statistics inMignard et al.(2016). X-statistic is a normalized separation considering not only the formal errors in the right ascension and declination but also the covariance between them in both catalogs. The distribution of these two separation
quan-Table 2. Statistics of the least-square fit.
N X0 N0 Pre-fit χ2 Post-fit χ2 ICRF1 326 3.40 298 0.77 0.67 ICRF2 1052 3.73 876 1.41 1.35 ICRF3 S /X 1288 3.78 871 1.82 1.80 ICRF3 K 326 3.40 255 1.47 1.38 ICRF3 X/Ka 286 3.36 168 2.17 1.31
Notes. N stands for the number of common sources between ICRF cat-alogs and Gaia sample while N0
is the size of clean sample. X0is
com-puted as X0=
√
2 ln N. The last two columns give the pre- and post-fit reduced-χ2.
tities is presented in Fig.5. For an ideally Gaussian noise, X is supposed to follow a Rayleigh distribution. The number of out-liers for a sample of N sources exceeds one when X is greater than X0, where X0 =
√
2 ln N. An additional cut-off threshold of 10 mas was imposed on the angular separation. The selection criteria can be summarized by the following equation as
X ≤ X0, ρ ≤ 10 mas. (2)
Finally, we obtained a “clean” sample, upon which we deter-mined the coefficients of the VSH via a least square fit. Table2
provides the value of X0and number of common sources as well as the size of the clean sample between ICRF catalogs and Gaia sample. The full covariance information for each source was used in the fit process, as done inLiu et al.(2018b). These out-liers are of interest of radio-optical offset studies and we address them in the Sect.3.5.
The rotation components between the Gaia DR2 and ICRF catalogs, demonstrated in Fig. 6, are generally at a level of 30–40 µas. This result is consistent with the claimed align-ment accuracy of the Gaia-CRF2 (Gaia Collaboration 2018a). Amongst ICRF catalogs, the rotation parameters are consis-tent within their formal errors, except for the R1 of the ICRF3 X/Ka-band. It means that the axial direction of the X/Ka-band frame deviates from that of S /X- and K-band frames at an angle of about 30 µas, which significantly exceeds the axial sta-bility of ICRF (10 µas for the ICRF2). However, if we com-pared directly the ICRF3 X/Ka-band catalog with the ICRF3 S/X-band catalog using exclusively the ICRF3 defining sources, the rotation angle around the X-axis would be smaller than 10 µas. This result gives us a hint that such an inconsistency would come from positional errors of the non-defining sources in the ICRF3 X/Ka-band catalog and should not be omitted in the comparison between the VLBI X/Ka-band and Gaia positions.
Contrary to the rotation, the glide terms are significant rel-ative to their formal errors, except for the X-component. With respect to the Gaia DR2, the ICRF1 shows the largest discrep-ancy, exceeding 100 µas, while the ICRF3 S /X frame shows the smallest. The glide between the Gaia DR2 and the ICRF3 S /X-band is consistent within the formal error. This result shows that the Gaia-CRF2 and the ICRF3 S /X band frame are highly consistent. Assuming that the Gaia-CRF2 is nearly free of declination-dependent systematics, it indicates that the dipolar deformation previously found in the ICRF2 has decreased signif-icantly. This achievement should be credited to the recent efforts to enhance the observations in the south (Jacobs et al. 2014), re-observations of the VCS-sources (Gordon et al. 2016), and the modeling of the Galactic aberration effect. The significant
N. Liu et al.: Systematics and accuracy of ICRF R1 R2 R3 R −60 −40 −20 0 20 40 60 80 R ot at io n (μ asμ ICRF1 ICRF2 ICRF3 S/X ICRF3 K ICRF3 X/Ka
Fig. 6.Rotation parameters of the ICRF positions with respect to the
GaiaDR2 position using common sources at G < 18.7. R is the module of rotation vector R calculated as R=
q R2 1+ R 2 2+ R 2
3. The black cross
indicates the estimate from the fit while the bar marks the confidence interval of 1-σ.
glide in the ICRF1 and ICRF2 partly results from the zonal errors (e.g.,Frouard et al. 2018) and partly due to the unmodeled Galactic aberration effect (Charlot 2019), both leading to the frame deformation. A noticeable glide component over ∼200 µas along the Z-axis appears in the ICRF3 X/Ka-band, revealing obvious zonal errors in the X/Ka-band frame as found in the Fig. 4. The K- and X/Ka-band frames also present a similar dipolar deformation of ∼50 µas along the Y-axis.
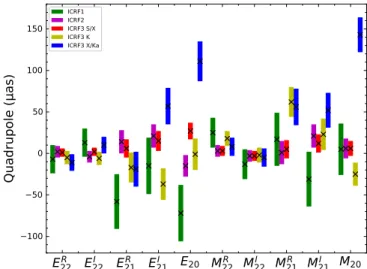
In terms of the quadrupolar parameters, the ICRF catalogs and the Gaia DR2 agree on the level of ∼50 µas, especially for the ICRF3 S /X-band with all coefficients below 20 µas except for the E20. Again, the ICRF3 X/Ka-band is an exception. Two terms, E20and M20, exceed 100 µas and should be interpreted as zonal errors in the X/Ka-band frame. Special attentions should also be given to terms that are above 50 µas, such as EI
21, M R 21, and M21I for the X/Ka-band, and M21R for the K-band frame. These terms should be examined carefully in the next release of the K- and X/Ka-band frames.
Based on the analysis of VSH technique, we found that the global agreement between ICRF3 S /X-band subset and Gaia sample is at the level of 30 µas, and it is around 50 µas for ICRF3 K-band frame. These satisfactory results indicate that these three realizations of the International Celestial Reference System (ICRS) agree well with the others. However, the signif-icant dipolar and quadruploar terms found in the ICRF3 X/Ka-band datum with referred to the Gaia solution suggest severe zonal errors in the X/Ka-band frame.Charlot(2019) pointed out these zonal errors in X/Ka-band frame using S /X-band frame as the reference, which is similar to our results. These zonal errors are likely due to (i) the small number of sources and also small number of observations for each sources; (ii) the weak geome-try (four antennas) of the X/Ka-band network. Due to limited data on the baseline from Argentina to California, the X/Ka-band frame is vulnerable to the declination-dependent zonal errors. At this stage, this emergent network has not reached its maturity. Several plans to correct this deficiency were proposed
inde Witt et al.(2018). Likely, the accuracy of the X/Ka-band
frame will become better as comparable to the S /X- and K-band frames when the network has a better coverage and accumulates more observations. D1 D2 D3 D −250 −200 −150 −100 −50 0 50 100 150 200 250 300 G lid e (μ asμ ICRF1 ICRF2 ICRF3 S/X ICRF3 K ICRF3 X/Ka
Fig. 7.Glide parameters of the ICRF positions with respect to the Gaia
DR2 position using common sources at G < 18.7. D is the module of glide vector D calculated as D=
q D2 1+ D 2 2+ D 2
3. The black cross
indicates the estimate from the fit while the bar marks the confidence interval of 1-σ. ER 22 EI22 E21R E21I E20 MR22 MI22 M21R M21I M20 −100 −50 0 50 100 150 Q ua dr up ol e (μ asμ ICRF1 ICRF2 ICRF3 S/X ICRF3 K ICRF3 X/Ka
Fig. 8.Quadrupole parameters of the ICRF positions with respect to the
GaiaDR2 position using common sources at G < 18.7. The black cross indicates the estimate from the fit while the bar marks the confidence interval of 1-σ.
3.4. Influence of limiting magnitude of Gaia sample
As mentioned in Sect. 2, the formal uncertainty of Gaia data depends strongly on the magnitude. As a result, we used only the bright sources (G < 18.7) in the Gaia DR2 ICRF3-prototype subset. To investigate the effect of limiting magnitude on the comparison, we used Gaia subsets with different limiting G-magnitudes, labeled as Gmax, and determined the VSH param-eters between ICRF and Gaia positions for common sources. We chose a set of value in the range of 17.5–21.0 with a step of 0.5 for Gmaxand kept exclusively sources brighter than Gmaxin the sample. The starting point was set as 17.5 in order to permit at least 100 common sources between ICRF catalogs and Gaia sample. The VSH parameters were obtained following the same procedures in the Sect.3.3. Figure 9depicts the distribution of number of common sources and used sources in the fit as a func-tion of the limiting G-magnitude.
102 103 NO . c om mo n so urc es ICRF1 ICRF2 ICRF3 S/X ICRF3 K ICRF3 X/Ka 17.5 18.0 18.5 19.0 19.5 20.0 20.5 21.0 Gmax (mag) 102 103 NO . u se d so urc es
Fig. 9.Distribution of numbers of all common sources between ICRF
catalogs and the Gaia DR2 ICRF3-prototype subset (top) and used sources in the fit (bottom) as a function of the limiting G-magnitude of Gaia sample.
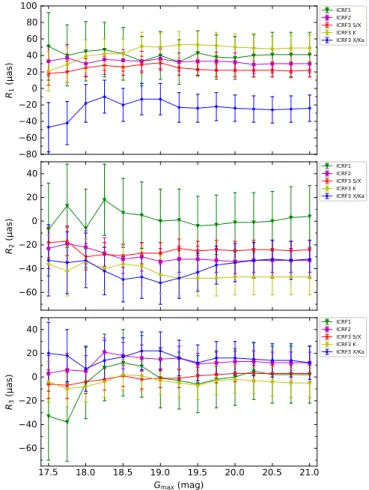
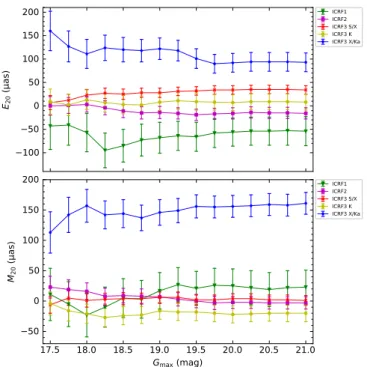
The estimation of rotation, glide, and quadrupole parame-ters are presented in Figs.10–12, respectively. Only the deter-mination of E20 and M20 are shown; the other quadrupole parameters yield a similar trend to E20 and M20 and there-fore not plotted for brevity. The ICRF3 S /X- and K-band cat-alogs yield a stable estimation of VSH parameters across the limiting G-magnitude, while for other ICRF catalogs, these parameters stabilize at Gmax > 18.7. The obvious variation in VSH parameters for the ICRF3 X/K-band seen in the region of Gmax < 18.7 is likely due to the small number of used sources in the fit. In general, all the VSH parameters of ICRF catalogs with referred to Gaia subsets agree with their for-mal uncertainties (1-σ), regardless of different limits imposed on the G-magnitude of the Gaia sample. This result hints that the precision of Gaia data gets worse as one moves toward the faint end but not necessarily the accuracy in terms of systematics.
3.5. Radio-to-optical offset
In this section, we investigated the radio-to-optical offset. We adjusted the VSH parameters determined in Sect. 3.3 to the ICRF positions in order to align the radio frame to the Gaia-CRF2 and recalculated the angular separation and normal-ized separation. The distribution of normalnormal-ized separation after adjustments of VSH parameters together with pre-fit normalized separation is shown in Fig.13. The full sample of 2820 sources in the Gaia DR2 ICRF3-prototype subset was used rather than limited to bright sources (G < 18.7). Clearly, the distribution of both pre- and post-fit X deviates from the Rayleigh dis-tribution. The ICRF1 does not show a large tail but is gen-erally smaller than the prediction from Rayleigh distribution. It possibly results from the large formal errors in the ICRF1 position. The ICRF2 fits the Rayleigh distribution well while surprisingly the ICRF3 S /X shows a large outlier rate, the later being similar to the results between Gaia DR2 and the prototype solution of ICRF3 (Gaia Collaboration 2018a). Even though the formal error of the ICRF3 has been inflated compared with the prototype solution, it still could not fully explain the radio-to-optic offset. Comparing the distributions of X for the S/X-, K-, and X/Ka-band, we found that they all deviate from the Rayleigh distribution. The difference in the shape between pre-and post-fit normalized separation for X/Ka-bpre-and is distinct,
−80 −60 −40 −200 20 40 60 80 100 R1 (μ asμ ICRF1 ICRF2 ICRF3 S/X ICRF3 K ICRF3 X/Ka −60 −40 −20 0 20 40 R2 (μ asμ ICRF1 ICRF2 ICRF3 S/X ICRF3 K ICRF3 X/Ka 17.5 18.0 18.5 19.0 19.5 20.0 20.5 21.0 Gmax (magμ −60 −40 −20 0 20 40 R3 (μ asμ ICRF1 ICRF2 ICRF3 S/X ICRF3 K ICRF3 X/Ka
Fig. 10.Rotation parameters of the ICRF positions with respect to the
GaiaDR2 position as a function of the limiting G-magnitude of Gaia sample. The error bar indicates the confidence interval of 1-σ.
underlining that the systematics in the X/Ka-band frame will bias the distribution of X, which is not seen in other ICRF cat-alogs. It suggests that current X/Ka-band position is not reli-able enough for statistically studying the radio-to-optical offset unless the systematical deformation in the X/Ka-band frame is corrected.
We further compared the post-fit angular separation and nor-malized separation of the ICRF2 and ICRF3 S /X with respect to the Gaia DR2 (Fig. 14). The angular separation between the ICRF2 and Gaia DR2 is generally larger than between the ICRF3 S /X and Gaia DR2 but the normalized separation is less. It indicates that some sources with a genuine radio-to-optical off-set that was hidden by the large ICRF2 formal error (which leads to a small value of X), come out as the precision of the VLBI S/X-band positions improves. Detailed analysis of these indi-vidual radio-to-optical distances, however, is beyond the scope of this work.
4. Conclusion
In this work, we compared the ICRF catalogs of three genera-tions with the Gaia DR2 in order to validate the VLBI astrom-etry. The new version of the ICRF3 at S /X-band closely agrees with Gaia DR2 in terms of the global differences and is nearly zonal (declination-dependent) error-free. This result supports the high quality of both the ICRF3 and Gaia-CRF2. Compared with its predecessors (the ICRF1 and ICRF2), the ICRF3 S /X-band frame presents a more consistent dependence on the number of
N. Liu et al.: Systematics and accuracy of ICRF −100 −80 −60 −40 −20 0 20 D1 (μ asμ ICRF1 ICRF2 ICRF3 S/X ICRF3 K ICRF3 X/Ka 0 50 100 150 200 D2 (μ asμ ICRF1 ICRF2 ICRF3 S/X ICRF3 K ICRF3 X/Ka 17.5 18.0 18.5 19.0 19.5 20.0 20.5 21.0 Gmax (magμ −200 −100 0 100 200 300 D3 (μ asμ ICRF1 ICRF2 ICRF3 S/X ICRF3 K ICRF3 X/Ka
Fig. 11.Glide parameters of the ICRF positions with respect to the Gaia
DR2 position as a function of the limiting G-magnitude of Gaia sample. The error bar indicates the confidence interval of 1-σ.
−100 −50 0 50 100 150 200 E20 (μ asμ ICRF1 ICRF2 ICRF3 S/X ICRF3 K ICRF3 X/Ka 17.5 18.0 18.5 19.0 19.5 20.0 20.5 21.0 Gmax (magμ −50 0 50 100 150 200 M20 (μ asμ ICRF1 ICRF2 ICRF3 S/X ICRF3 K ICRF3 X/Ka
Fig. 12.Quadrupole parameters E20(top) and M20(bottom) of the ICRF
positions with respect to the Gaia DR2 position as a function of the limiting G-magnitude of Gaia sample. The error bar indicates the con-fidence interval of 1-σ. 0 5 10 15
%
in
bin
ICRF1
pre-fit post-fit 0 5 10 15%
in
bin
ICRF2
pre-fit post-fit 0 5 10 15%
in
bin
ICRF3 S/X
pre-fit post-fit 0 5 10 15%
in
bin
ICRF3 K
pre-fit post-fit 0 2 4 6 8 10Normalized seperation
X 0 5 10 15%
in
bin
ICRF3 X/Ka
pre-fitpost-fit
Fig. 13.Distribution of normalized separation between the Gaia DR2
and ICRF catalogs before (in blue) and after (in red) adding the adjust-ments of VSH parameters. The green dashed curve indicates a shape of standard Rayleigh distribution.
observation and a more smooth dependence on the declination, even though one could still find some south-north asymmetry in the positional precision.
The ICRF3 K- and X/Ka-band catalogs show the strength of observations at high frequency. Even though the number of observation per source is two or three orders smaller than that of S /X-band, the observed positions present a better precision. However, the possible zonal errors shown in the Sect.3.3, espe-cially dipolar deformation of ∼−200 µas for the X/Ka-band, is most likely due to the weak geometry of the observing net-work and therefore should be investigated carefully in the future X/Ka-band solution. Since the observed radio position precision improves rapidly with the number of observations, the K- and X/Ka-band frame could be updated or extended more frequently than the S /X-band frame.
With the improved accuracy of the ICRF3 S /X position, we can see more clearly the radio-to-optical offsets at sub-mas level. This would benefit the studies of the core-shift effect, but we call the attention for the possible zonal error in the X/Ka-band catalog which should not be omitted.
101 102 103 104 105 ρICRF2 (μasμ 101 102 103 104 105 ρIC R F3 S/X ( μa sμ 10−2 10−1 100 101 102 XICRF2 10−2 10−1 100 101 102 XIC R F3 S/X
Fig. 14. Angular separation and normalized separation between the
GaiaDR2 and ICRF3 S /X catalog for common sources versus those between the Gaia DR2 and ICRF2 catalog after adjusting VSH param-eters to ICRF positions.
Acknowledgements. The authors are grateful to François Mignard for his use-ful comments and suggestions which improve greatly the manuscript. The work of N.L. has been supported by China Scholarship Council (CSC) for the joint doctor training program at Department SYRTE (Systèmes de Référence Temps-Espace) of the Paris Observatory (File No. 201706190125). N.L. is also funded by the National Natural Science Foundation of China (NSFC) under grant No. 11833004. N.L. is grateful to Nan Jiang for her careful check of the lan-guage. This work has made use of data from the European Space Agency (ESA) mission Gaia (https://www.cosmos.esa.int/gaia), processed by the Gaia Data Processing and Analysis Consortium (DPAC,https://www. cosmos.esa.int/web/gaia/dpac/consortium). Funding for the DPAC has been provided by national institutions, in particular the institutions partici-pating in the Gaia Multilateral Agreement. This research has made use of NASA’s Astrophysics Data System. This research also made use of Matplotlib, an open-source 2D graphics package for Python (Hunter 2007) and Astropy (http://www.astropy.org), a community-developed core Python package for Astronomy (Astropy Collaboration 2013,2018).
References
Astropy Collaboration (Robitaille, T. P., et al.) 2013,A&A, 558, A33 Astropy Collaboration (Price-Whelan, A. M., et al.) 2018,AJ, 156, 123 Charlot, P. 2019, in30th IAU General Assembly
de Witt, A., Gordon, D., & Jacobs, C. S. 2018, inProceedings of the 10th IVS General Meeting, E1
Fey, A. L., Gordon, D., Jacobs, C. S., et al. 2015,AJ, 150, 58
Frouard, J., Johnson, M. C., Fey, A., Makarov, V. V., & Dorland, B. N. 2018,AJ, 155, 229
Gaia Collaboration (Prusti, T., et al.) 2016,A&A, 595, A1 Gaia Collaboration (Mignard, F., et al.) 2018a,A&A, 616, A14 Gaia Collaboration (Brown, A. G. A., et al.) 2018b,A&A, 616, A1 Gordon, D., Jacobs, C., Beasley, A., et al. 2016,AJ, 151, 154 Hunter, J. D. 2007,Comput. Sci. Eng., 9, 90
Jacobs, C. S., Arias, F., & Boboltz, D. 2014, in8th IVS General Meeting, 1 Kovalev, Y. Y., Petrov, L., & Plavin, A. V. 2017,A&A, 598, L1
Lambert, S. 2014,A&A, 570, A108
Le Poncin-Lafitte, C., Hees, A., & Lambert, S. 2016, Phys. Rev. D, 94, 125030
Liu, N., Lambert, S. B., & Zhu, Z. 2018a,A&A, 620, A160 Liu, N., Zhu, Z., & Liu, J. C. 2018b,A&A, 609, A19 Ma, C., Arias, E. F., Eubanks, T. M., et al. 1998,AJ, 116, 516
Makarov, V. V., Berghea, C. T., Frouard, J., Fey, A., & Schmitt, H. R. 2019,ApJ, 873, 132
Mathews, P. M., Herring, T. A., & Buffett, B. A. 2002,J. Geophys. Res. (Solid Earth), 107, 2068
Mignard, F., & Klioner, S. 2012,A&A, 547, A59
Mignard, F., Klioner, S., Lindegren, L., et al. 2016,A&A, 595, A5 Roland, J., Britzen, S., Kun, E., et al. 2015,A&A, 578, A86