HAL Id: hal-00299105
https://hal.archives-ouvertes.fr/hal-00299105
Submitted on 16 Apr 2004
HAL is a multi-disciplinary open access
archive for the deposit and dissemination of
sci-entific research documents, whether they are
pub-lished or not. The documents may come from
teaching and research institutions in France or
abroad, or from public or private research centers.
L’archive ouverte pluridisciplinaire HAL, est
destinée au dépôt et à la diffusion de documents
scientifiques de niveau recherche, publiés ou non,
émanant des établissements d’enseignement et de
recherche français ou étrangers, des laboratoires
publics ou privés.
Social and economic factors of the natural risk
increasing: estimation of the Russian regions
E. Petrova
To cite this version:
E. Petrova. Social and economic factors of the natural risk increasing: estimation of the Russian
re-gions. Natural Hazards and Earth System Science, Copernicus Publications on behalf of the European
Geosciences Union, 2004, 4 (2), pp.243-248. �hal-00299105�
Natural Hazards and Earth System Sciences (2004) 4: 243–248 SRef-ID: 1684-9981/nhess/2004-4-243
© European Geosciences Union 2004
Natural Hazards
and Earth
System Sciences
Social and economic factors of the natural risk increasing:
estimation of the Russian regions
E. Petrova
Faculty of Geography, Research Laboratory of Snow Avalanches and Debris-flow, Lomonosov Moscow State University, Moscow, Russia
Received: 19 September 2003 – Revised: 29 December 2003 – Accepted: 28 January 2004 – Published: 16 April 2004 Part of Special Issue “Multidisciplinary approaches in natural hazards”
Abstract. This study is an attempt to assess quantitatively
social and economic factors that determine vulnerability of Russian regions to natural risk, to trace the space differences of the considered factors, and to group the regions by their similarity. In order to indicate the regional differences in so-cial and economic development, equipment condition, dan-gerous substances accumulation, and social trouble four the most suitable parameters were estimated, including the per capita production of Gross Regional Product (GRP), capital consumption, volume of total toxic waste, and crime rate. Increase of the first parameter causes vulnerability reducing, the increase of the last three causes its increasing. Using multidimensional cluster analysis five types of regions were found for Russia according to similarity of the considered parameters. These types are characterized with higher value of a single (rarely two) chosen parameter, which seems to be sufficient enough to affect natural risks increasing in these re-gions in near future. Only few rere-gions belonging to the fifth type proved to have rather high value of GRP and relatively low values of the other parameters. The negative correlation was found between a number of natural disasters (ND) and the per capita GRP in case when some parameters reached anomalously high value. The distinctions between regions by prevailing different parameters, which result in natural risk increasing, help risk management to find directions where to focus on.
1 Introduction
The past decade witnessed an exponential growth in the oc-currence of natural disasters (ND). There were more than 3 400 large-scale ND resulting in death of approximately 800 000 people and causing economic losses in excess of US$ 608 billion, which in fact reflects an annual increase of approximately 10% during the 1990s. Rapidity of increase
Correspondence to: E. Petrova
(epgeo@mail.ru)
of affected people is greater than the rapidity of increase of a number of events (United Nations World Disaster Reduction Campaign, 2001). More than 3 680 natural disaster events were recorded in Russia from 1990 to 2002. It gives an an-nual average number of 283 ND (in the 1980s it was from 110 to 130 ND) (Natural hazards and society, Natural haz-ards of Russia, 2002). In fact, 91 ND were registered in 1991, while there were 465 ND in 1998 (maximum) and 279 ND in 2002. The ND have killed more than 300 people and af-fected about 330 000 people in 2002 alone. Forest fires are the most often in Russia (about 30–40% of all ND). Meteo-rological phenomena, such as hurricanes, windstorms, high winds, and squall constitute is the second contributory factor (28%) and floods represent 19% (State reports of Emergency Ministry of Russia about Protecting Population and Territory of Russian Federation against Natural and Man-Caused ND in 1997–2001, 2002).
Literature dealing with natural hazards, disaster vulnera-bility, and risk assessment typically represents three cate-gories. Most researchers studied natural hazards in them-selves, their physical parameters, distribution, and etc. They identified natural hazards as the cause of vulnerability (sci-entific and technological approaches). The assumption has been that such events, as acts of nature, cannot be prevented. However, vulnerability could be reduced by avoiding danger-ous areas (Natural disasters and vulnerability analysis, 1979). The second group of researchers (economic approach) fo-cuses on the analysis of economic impacts of ND, direct and indirect costs, as well as secondary effects. It attempts to develop economically rational criteria for reducing vul-nerability (Anderson, 1990). The third group of investiga-tions (since White, 1973) recognizes the differential charac-ter of vulnerability and the central role of the human (or so-ciety as a whole) in creating vulnerability (social approach). Economic poverty, social and political marginalization, lack of options, as well as lack of resources, and other social, economic, and political indicators are included (Anderson, 1995).
244 E. Petrova: Social and economic factors of the natural risk increasing in Russia
Fig. 1. Types of the Russian regions with similar values of the parameters.
More recent studies propose an integrated approach to natural risk assessment. Disaster is seen as social and economic phenomenon rather than geophysical and techni-cal one (Global Change, 1991). So Myagkov and Kozlov (1993) ranked among the natural risks factors, such as social and psychological aspects, land-use experience, population density, technological complexity of production and commu-nication, concentration of industrial capacities, especially, of hazardous plants. Myagkov (2001) emphasized ethnic and cultural features of population, such as inclination to risk, at-titude to fate (as controlled or unavoidable), individual risk assessment, and response. According to (Natural Disasters in the World, Statistical Trend on Natural Disasters, 1994), interdependence between per capita Gross Domestic Prod-uct (GDP) and a number of ND for countries all over the world was found. In a framework for assessing vulnerability Anderson (1995) suggested including the four steps: 1) iden-tifying hazards, 2) ideniden-tifying exposure, 3) ideniden-tifying the complex sources of the hazard, and 4) time and space di-mensions. Weichselgartner and Bertens (2000) propose to synthesize both the physical and social factors. Along with hazard and exposure, in their concept such factors as pparedness, prevention, and response are considered. The re-sult is a vulnerability map, where not only degree but also causes of vulnerability are given (hazard-of-place approach). We believe (Petrova, 2002) that vulnerability also depends on economy type (industrial or agricultural), on region struc-ture and dimensions, as well as on activity of economic rela-tions between regions. The uniqueness of the objects within any region as well as the uniqueness of the region itself (residence areas of small and indigenous nations, areas with
unique natural environment, and others) increases its vulner-ability.
This study is an attempt to assess quantitatively social and economic factors that determine vulnerability of Russian re-gions to natural risk, to trace space differences of the consid-ered factors, and to group the regions by their similarity.
2 Research region and methods
The level of administrative units of the Russian Federa-tion (RF) was chosen for the research because comparable statistical data for the administrative units are available for assessment. The first step of the study was a selection of parameters for assessing social and economic conditions of the Russian regions, which affect vulnerability to ND. We have taken only four parameters that could better indicate the regional differences in social and economic development, equipment condition, dangerous substances accumulation, and social troubles. In our choice we were restricted by avail-ability of official statistical data.
• The per capita production of Gross Regional Prod-uct (GRP) is the most informative economic parameter describing differences of the social and economic con-ditions of the regions, which in turn determine available material resources for vulnerability reducing.
• Wear and tear of equipment as well as social and indus-trial infrastructure including travel facilities essentially increases vulnerability. A statistical parameter for de-preciation of assets (capital consumption) was taken for appropriate calculation.
E. Petrova: Social and economic factors of the natural risk increasing in Russia 245
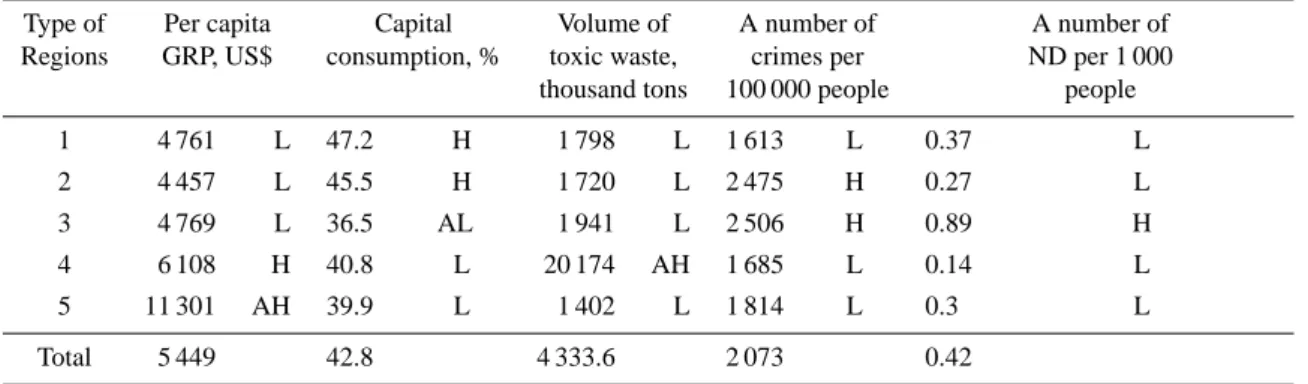
Table 1. Average values of the parameters and a number of ND for the region types.
Type of Per capita Capital Volume of A number of A number of Regions GRP, US$ consumption, % toxic waste, crimes per ND per 1 000
thousand tons 100 000 people people 1 4 761 L 47.2 H 1 798 L 1 613 L 0.37 L 2 4 457 L 45.5 H 1 720 L 2 475 H 0.27 L 3 4 769 L 36.5 AL 1 941 L 2 506 H 0.89 H 4 6 108 H 40.8 L 20 174 AH 1 685 L 0.14 L 5 11 301 AH 39.9 L 1 402 L 1 814 L 0.3 L Total 5 449 42.8 4 333.6 2 073 0.42
The parameters in Table 1 are ranked as follows: AL – anomalously low, L – low, H – high, AH – anomalously high.
• The highest risk results from destruction probability by natural hazards for radiation-dangerous units and stor-age of toxic and radioactive waste. Since the data of ra-dioactive waste accumulation are not available, volume of toxic waste was taken.
• The regions with unfavorable social situation are more vulnerable. Criminality level was taken as an indicator of social troubles.
Data concerning the above-mentioned parameters were taken from the statistical yearbook Regions of Russia, 2001.
As the second step, average values and standard devia-tions of every taken parameter were calculated for all the re-gions. Then the values of each parameter in all the regions were classified in comparison with average ones. The val-ues, which are higher (lower) than the average ones, were considered as high (low). The results differed from average values for more than the standard deviation were considered as anomalous ones.
The third step of the study was multidimensional clus-ter analysis (software package Gold-Geochemist) for all the 89 Russian regions by all taken parameters. This method permits us to group objects (regions) with similar values of the parameters. Afterwards the average values of every taken parameter were calculated for each group.
Finally the correlation analysis for relations between an-nual average number of ND (per 1000 people) and the per capita production of GRP was done. Data concerning a num-ber of ND were taken from the State Reports of the Emer-gency Ministry of the Russian Federation. For the adminis-trative units such data are available only for 1997–2002. The coefficient of correlation was calculated for the totality of re-gions as well as for the groups with anomalously high values of the parameters.
3 Results
Majority regions of Russia (51 of 79 for whom the State Statistic Committee calculated this parameter) are
charac-terized with the per capita GRP lower than the average one (US$ 5 449 if to take into account purchasing-power parity). Three regions among these 51 (Tyva, Ingushetia, and Dages-tan Republics) have anomalously low value of the parame-ter (less than US$ 2 251). 23 regions have high value. Five regions only (Tyumen Region, Moscow, Krasnoyarsk Terri-tory, and the Republics of Tatarstan and Komi) have anoma-lously high per capita GRP (more than US$ 9 500).
In 50 regions the capital consumption exceeds 42.8% (av-erage value). Moreover, it is more than 48.4% (anoma-lously high) in Novosibirsk, Penza, Kirov, Postov, Kursk, Yaroslavl, Samara, Volgograd Regions, and in the Repub-lic of Ingushetia. Equipment aging is the most catastrophic in case of chemical, petrochemical, and oil-processing in-dustry, including gas and oil pipelines. Capital consumption reached in Russia 70% for the oil refineries, from 70 to 80% for railway facilities, 72% for pipelines, and 75% for hous-ing utilities and services (State reports of Emergency Min-istry of Russia about Protecting Population and Territory of Russian Federation against Natural and Man-Caused ND in 1997–2001, 2002).
Storing and processing toxic waste are under statistical ob-servation in Russia since 1994. We estimated toxic waste stored in the regions from 1994 to 1999. Anomalously high volumes of toxic waste (more than 13 million tons) were accumulated during this period in Republic Bashkartostan (Bashkiria), Orenburg, Chelyabinsk, Kemerovo, Vologda Regions, and Krasnoyarsk Territiory. 12 regions have high values of the parameter (more than 4333.6 tons). The more toxic waste is in a region, the higher is disaster probability with fatal consequences in case of natural hazard impact on such waste stores.
Anomalously high criminality level (more than 2600 reg-istered crimes per 100 000 people) was marked in Kurgan, Perm, Leningrad, Novosibirsk, Tyumen, Irkutsk, and Mag-adan Regions, as well as in Buryatia, Jewish Autonomous Area, and Khabarovsk Territory. 29 regions have high val-ues of the parameter (more than 2073). Of course, negative social conditions do not influence directly on occurrence of natural hazards. Nevertheless, strengthening social troubles
246 E. Petrova: Social and economic factors of the natural risk increasing in Russia 25 30 35 40 45 50 55 60 65 0 5000 10000 15000 20000 25000 30000
per capita GRP, US$
capital consumption, % -10000 -5000 0 5000 10000 15000 20000 25000 30000 35000 40000 45000 0 5000 10000 15000 20000 25000 30000
per capita GRP, US$
toxic waste, thousand tons
25 30 35 40 45 50 55 60 65 0 5000 10000 15000 20000 25000 30000
per capita GRP, US$
capital consumption, % -10000 -5000 0 5000 10000 15000 20000 25000 30000 35000 40000 45000 0 5000 10000 15000 20000 25000 30000
per capita GRP, US$
toxic waste, thousand tons
0 500 1000 1500 2000 2500 3000 3500 4000 4500 0 5000 10000 15000 20000 25000 30000
per capita GRP, US$
crimes per 100,000 people
type 1 type 2 type 3 type 4 type 5
Fig. 2. Relation of the social and economic parameters for different types of regions. 0 0,5 1 1,5 2 2,5 3 3,5 4 4,5 0 5000 10000 15000 20000 25000 30000 per capita GRP, $ N D
number per 1000 people
The background regions
The regions with anomalously high ND number The regions with anomalously high per capita GRP
Fig. 3. Dependence between the per capita production of GRP and a number of ND per 1000 people.
lead to increasing both disaster seriousness and so called “hu-man factor”, possibility of “hu-man-caused disasters (due to un-premeditated actions, sabotage, or acts of terrorism).
Using multidimensional cluster analysis five types of re-gions were found for RF according to the similarity of the above-mentioned parameters that permitted us to create a map (Fig. 1). The difference between these types is distinctly shown on the graphs (Figs. 2a–c). The main characteristics of the types are shown in Table 1. These types are character-ized with higher value of a single (rarely two) parameter.
• The first type of regions (22 regions) is generally char-acterized with high and anomalously high capital con-sumption and low per capita GRP.
• The second type includes 21 regions and is character-ized with both high capital consumption and high crim-inality level, and low per capita GRP.
• The third type is marked with the highest criminality level and low per capita GRP. 18 regions of this type have also the highest quantity of ND per 1000 people.
• 11 regions of the forth type are characterized with high volumes of toxic waste and per capita GRP.
• 7 regions of the fifth type are the most successful from all points of view. They are characterized with both high per capita GRP and relatively low values of all parame-ters increasing natural risk.
E. Petrova: Social and economic factors of the natural risk increasing in Russia 247 Table 1 also shows data concerning an annual average
number of ND per 1000 people. Analyzing the table one can note inverse relation between the per capita GRP and a number of ND for three region types. For example, high (the forth type) and anomalously high (the fifth type) per capita GRP corresponds to a low ND number. One of the types (the third one) has low per capita GRP value and simultaneously high ND quantity. At the same time the first and the second types have low values of both per capita GRP and a number of ND. It shows rather a complex character of the relation. In general, there is a trend to ND number reducing if per capita GRP increases (Fig. 3). In principle, this dependence is similar with that between per capita GDP and a number of ND on the international level (Natural Disasters in the World, Statistical Trend on Natural Disasters, 1994). However, the coefficient of correlation for the totality of regions is too low (–0.21). That is why we tried to find out more precise struc-ture of this correlation.
As the Fig. 3 shows this interdependence is watched more distinctly in those regions, where either per capita GRP or a number of ND are anomalously high. In the first case the coefficient of correlation is –0.69 and in the second case it is –0.61. The rest of the regions have the coefficient of correla-tion –0.27. Anomalously high annual average number of ND is marked in the Republics of Karachai-Cherkess, Adygei (the Northern Caucasus), and Altai (the West Siberia), in Chukchi, Koryak, and Jewish Autonomous Areas, as well as in Amour and Sakhalin Regions and Khabarovsk Territory (the Far East). The relatively small increase of the per capita GRP corresponds to sharp reducing a number of ND in this group. The above-mentioned regions with anomalously high values of the per capita GRP have simultaneously low and anomalously low ND number. One can assume that this re-lationship is a result of reducing vulnerability after the per capita GRP has exceeded a certain level.
4 Discussion and perspectives
In generally the results of the presented study corroborate the assumption that the social and economic factors have a certain influence on natural risks increasing (or decreasing). More distinctly it is shown in the negative correlation be-tween the per capita production of GRP and a number of ND. However, we have found this interdependence to have more complex structure. So this relation is more intimate in those regions, where either per capita GRP or a number of ND are anomalously high. Of course, the analysis will be continued. For instance, it needs to be extended for longer period of ND observation. The background group of regions, which is het-erogeneous in regard to this correlation, requires the special attention. The other parameters could be also taken into ac-count.
Using multidimensional cluster analysis five types of Rus-sian regions were found by the similarity of the taken param-eters. It is interesting that every group is characterized with a single (rarely two) prevailing factor resulting in nature risk
increasing: high or anomalously high values of capital con-sumption, toxic waste, and crime rate with simultaneously low values of GRP. It seems to be sufficient enough to affect increase of a number and seriousness of ND in these regions in near future. Only few regions belonging to the fifth type proved to have relatively low values of the three parameters and rather high values of GRP. The analysis permitted us to create a map that shows differences in prevailing risk fac-tor for the region types, which help risk management to find directions where to focus on. That is the main difference between the proposed approach and the approach based on calculation of an average indicator of vulnerability (Weich-selgartner and Bertens, 2000). In future the distinctions of the both methods should be taken into account for problem statement. For example, it is interesting to compare the both approaches by creating maps for the same area.
This study is the first attempt of such an analysis for the Russian regions. In future contribution of the other social and economic factors as well as nature peculiarities should be investigated. The seriousness of disasters, the various types of natural hazards should be considered.
Acknowledgements. The author would like to express special
thanks to Y. Mironov for help in multidimensional cluster analysis and important remarks that were accepted. Thanks go also to O. Trapeznikova for help in paper translation into English. Edited by: T. Glade
Reviewed by: two referees
References
Anderson, M. B.: Analyzing the costs and benefits of natural disas-ter responses in the context of development, Environment Work-ing Paper, 29, WB, WashWork-ington, D.C., 1990.
Anderson, M. B.: Vulnerability to disaster and sustainable develop-ment: a general framework for assessing vulnerability, edited by Munasinghe, M., Clarke, C.: Disaster prevention for sustainable development, A report from the Yokohama World Conference on Natural Disaster Reduction, May 23–27, 1994, Washington, D.C., 1995.
Global Change, Geographical Approaches, Nucson, Univ. of Ari-zona Press, 1991.
Myagkov, S. M.: Social Ecology, Ethnic and cultural foundations for sustainable development, (in Russian), Moscow, 2001. Myagkov, S. M. and Kozlov, K. A.: The extent of technogenous and
natural hazards in Russia, (in Russian), Herald of the Moscow State Univ., Series 5, Geography, 5, 3–11, 1993.
Natural disasters and vulnerability analysis, Report of the Expert Group Meeting, 9–12 July, UNDRO, Geneva, 1979.
Natural Disasters in the World, Statistical Trend on Natural Disas-ters, National Land Agency: Japan, IDNDR, Promotion Office, 1994.
Natural hazards and society, (in Russian), Natural hazards of Rus-sia, 1, edited by Vladimirov, V. A., Vorob’ev, Yu. L., Os-ipov, V. I., Moscow, 2002.
Petrova, E. G.: The Aggravation of Socio-Ecological Risks in the Russian Regions, Russia and the Contemporary World, (in Rus-sian), 4 (37), 75–82, 2002.
248 E. Petrova: Social and economic factors of the natural risk increasing in Russia
Regions of Russia 2000, (in Russian), Statistical Yearbook, State Statistical Committee of Russia, Moscow, 2001.
State reports of Emergency Ministry of Russia about Protecting Population and Territory of Russian Federation against Natu-ral and Man-Caused ND in 1997–2001, (in Russian), Moscow, Emergency Ministry of Russia 1998–2002, 2002.
United Nations World Disaster Reduction Campaign: Countering Disasters, Targeting Vulnerability, Geneva, UN Secretariat for the International Strategy for Disaster Reduction, 2001.
Weichselgartner, J. and Bertens, J.: Natural disasters: acts of God, nature or society? – On the social relation to natural haz-ards, Risk Analysis II, edited by Brebbia, C. A., WIT Press, Southampton, 3–12, 2000.
White, G.: Natural Hazards Research, in: Directions in Geography, edited by Chorley, R. J., London, 1973.