HAL Id: hal-01349835
https://hal.archives-ouvertes.fr/hal-01349835
Submitted on 4 Aug 2016
HAL is a multi-disciplinary open access
archive for the deposit and dissemination of
sci-entific research documents, whether they are
pub-lished or not. The documents may come from
teaching and research institutions in France or
abroad, or from public or private research centers.
L’archive ouverte pluridisciplinaire HAL, est
destinée au dépôt et à la diffusion de documents
scientifiques de niveau recherche, publiés ou non,
émanant des établissements d’enseignement et de
recherche français ou étrangers, des laboratoires
publics ou privés.
To cite this version:
Sébastien Gadal, Walid Ouerghemmi. Morpho-Spectral Recognition of Dense Urban Objects by
Hy-perspectral Imagery. International Archives of the Photogrammetry, Remote Sensing and Spatial
Information Sciences, Copernicus GmbH (Copernicus Publications), 2015, XL-3/W3, pp.433-438.
�hal-01349835�
MORPHO-SPECTRAL RECOGNITION OF DENSE URBAN OBJECTS BY
HYPERSPECTRAL IMAGERY
S. Gadal a, W. Ouerghemmi a, *
a
Aix-Marseille Université, CNRS ESPACE UMR 7300, Aix-en-Provence, France - [email protected], [email protected]
KEY WORDS: Morpho-spectral database, Feature Extraction, mophometry, morphological attributes, spectral attributes, vector
mapping, build-up, hyperspectral remote sensing.
ABSTRACT:
This paper presents a methodology for recognizing, identifying and classifying built objects in dense urban areas, using a morpho-spectral approach applied to VNIR/SWIR hypermorpho-spectral image (HySpex). This methodologycontainsseveral image processing steps: Principal Components Analysis and Laplacian enhancement, Feature Extraction of segmented build-up objects, and supervised classification from a morpho-spectral database (i.e. spectral and morphometric attributes). The Feature Extraction toolbox automatically generates a vector map of segmented buildings and an urban object-oriented morphometric database which is merged with an independent spectral database of urban objects. Each build-up object is spectrally identified and morphologically characterized thanks to the built-in morpho-spectral database.
1. INTRODUCTION
Urban areas are characterized by a large variety of geographic objects and spatial forms: communication infrastructures such as roads, highways, ports and airports, agricultural areas, industrial or commercial zones, collective or individual housing, green areas, etc. All these objects, which structure urban territories, generate a spatial and spectral heterogeneity characterized by a large panel of forms, textures, geometries and spectral signatures that are recovered by the remote sensing techniques. In urban context, the complexity of spectral signatures is due to the heterogeneity of roofing materials, built areas, density, open spaces, tree cover, gardens, building height, type of architecture, etc. The spatial and spectral heterogeneity in urban context makes the recognition of urban objects even more complex.
For many years, the recognition and identification of buildings as housing was often difficult using spectral classification due to the limited spectral resolution of the sensors (e.g. Herold et al., 2002; Kärdi, 2007; Herold and Roberts, 2010), but with the emergence of the hyperspectral sensors many studies exposed the efficiency of these type of sensors in the urban materials recognition (e.g. Heiden et al., 2001; Heiden et al., 2007; Heldens et al., 2011). Moreover, the use of texture characters into urban objects can improves the level of recognition, extraction and identification of build-up areas (e.g. Ober et al., 1997; Myint et al., 2006; Plaza et al., 2007). In this study we wanted to take advantage of both spectral and morphological aspect of remote sensing objects to better identify and characterize them in a dense urban context. For this purpose a HySpex hyperspectral image of
408 spectral bands and a spatial resolution of 1.6m is used, the study zone is located in France (city center of Toulouse). The use of spectral attributes (e.g. Chein-I Chang, 2000; Behling et al., 2015) in addition to morphometric ones (Gadal, 2011) or to morphological operators (e.g. Shaban and Diskshit, 1999; Longley and Mesev, 2000) makes it possible to recognize, differentiate and identify accurately discrete buildings. The methodology presented here is based on two major process; 1) objects identification using a spectral library and 2) objects identification using a morphological library. The morphological library could be generated by intermediate symbolic representation (ISR) (e.g. Gauthier, 1999; Mohan Kumar and Nagendraswamy, 2011) or using morphological toolbox (i.e. Feature Extraction, ENVI exelisvis 2008). In this study the Feature Extraction toolbox is used to generate the morphological attributes, the method as applied to the recognition and identification of build-up land makes it possible to generate two object-oriented databases: (1) a vector database of each recognized object, and (2) a geometric attributes database (i.e. morphometric database) in which, to each recognized built object are associated a number of geometric measurements such as texture, compactness, connectedness, voids, surface area, number of edges, boundaries, etc. The morphometric database (Gadal, 2012) will be enriched with a spectral one containing a variety of urban objects spectral attributes (e.g. spectral resolution/rate, temporal resolution, ground sample distance).
2. Method
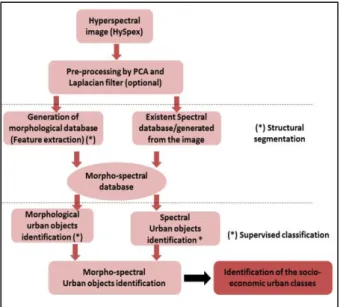
The goal of this novel image processing approach is to propose an accurate identification and characterization of urban objects in dense urban context using a morpho-spectral database (Figure 1). The first sequence of image processing
consists in enhancing the visual recognition of the build-up areas by a pre-processing step (optional), the second step consists in generating a morpho-spectral database, the third sequence consists in identifying urban objects by morphological and spectral classification. The fourth step consists in merging the 2 objects identification methods to have an efficient characterization of the socio-economic urban classes.
Figure 1. Image processing sequence
3. Morphological objects identification
3.1. Structural segmentation
We have used structural segmentation, to divide the image into polygons of connected pixels; each polygon can be affected to a certain class or a certain material.
The segmentation algorithm (Jin, 2012) consists in: computing the gradient of the image, computing a cumulative distribution from the generated map, modifying the map using a scale level option and segmenting the map using a watershed transform (Roerdink and Meijster 2001). In a second step we have applied a merge algorithm to improve the delineation of the segments boundaries using the Full Lambda-Schedule algorithm (Crisp et al, 2012).
Before applying the structural segmentation method, a pre-processing step of the images is done (i.e. only when classifying the image using spatial attributes). The purpose of the pre-processing sequence is to obtain a sharper discrimination of build-up objects by using statistical operators (orthogonal transformation and convolution). Pre-processing increases the differentiation between non-built/buildings, and between built-up areas. Their extraction during structural segmentation, more particularly in dense areas, is thus facilitated. The methodology is based on the application of a Principal Component Analysis (PCA) first, then a convolution Laplacian filter (5x5 windows) positioned on the first principal component of the HySpex image (Figure 2).
Figure 2. HySpex filtered hyperspectral data (Enhancement by PCA and Laplacian convolution filter)
After the image enhancement step, the pixels of the image are grouped into segments using a structural segmentation algorithm, with a possibility to control the scale and merge level (Figure 3). The segmentation step permits to classify pixels into polygons, each polygon is characterized by its own attributes.
Figure 3. Segmented HySpex image
3.2. Morphological attributes
The second sequence of image processing consists in: (1) generating a morphometric measure of each building, and (2) producing an urban building object-oriented database. The measure of their geometries and morphologies, and the generation of the urban object-oriented database are processed by the Feature Extraction toolbox proposed by ENVI (i.e. generation of a morphological attributes of each segmented polygon.
These attributes are classified into 3 classes (radiometric, spatial and textural attributes). The segmented image could be classified using the extracted attributes. The radiometric
attributes are calculated for each spectral band (i.e. radiometric attributes of each polygon), concerning the spatial and textural cases, the attributes are calculated directly from the segmented polygons and the spectral dimension is not required. For each selected attribute, the histogram of the attribute values is generated and the classification is done using a data range threshold.
3.3. Morphological classification
To identify the built-up area any class of attributes can be used, we have tested the 3 classes of attributes: radiometric, spatial and textural. Concerning the radiometric attributes, we have selected the spectral mean attribute which is the reflectance mean of each calculated polygon; it’s possible to choose any spectral band to process the classification. We have used the band 414 nm, where the urban materials are well identified visually and not much correlated spectrally with other materials.
Concerning the textural attributes we have used the textural mean at band 414 nm, the textural attributes are calculated by the application of pre-defined kernels, the textural mean correspond to the pixels mean inside the kernel. The urban objects are well identified according to their textural attributes (Figure 4). For special textural features the data range must be modified, big social structure (e.g. shopping mall, parking, theater) could be identified using textural attributes (Figure 4).
Figure 4. Urban objects identification using textural attribute (texture mean)
Concerning the spatial attributes, we have used the length attribute. The length is a measure of the boundary of the segmented polygons, other attributes can be cited; the area, the roundness, convexity, compactness, elongation, rectangular fit. These attributes have to be chosen carefully, following the forms and objects to be identified. In an urban context several forms could be found, and the use of these spatial attributes could be useful for the urban objects recognition. Concerning our test zone, the length zone seemed well suited to recognize the different boundary of the urban objects. The boundary identification differs according to the chosen data range threshold (Figure 5). The data range has to be tuned depending on the object surface (i.e. big object, small objects).
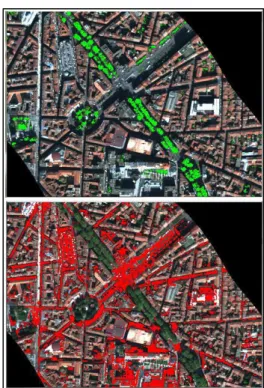
Figure 5. Urban objects identification using spatial attribute (length) with 2 different data range thresholds To identify vegetation we have used the textural attributes and calculated the textural range of the pixels identified in each polygon, the processing was done using band 414 nm. The vegetation emissivity is not elevated in this band in contrary to urban materials and roads, but it has a particular texture and could be recognized using textural data range (Figure 6, in green).
To identify roads we have used the spectral mean radiometric attribute at band 414nm. The asphalt emissivity is enough elevated in this band; the recognition could be done using a specific range of spectral values, we have also filtered the vegetation using the textural range attribute, due its correlation with roads at band 414 nm. The roads are well recognized using the spectral mean (Figure 6, in red). The efficiency of the morphological classification results could depends on many factors; the level of adjustment of the used attributes, the concordance of the attribute to the objects of interest, the combination of several attributes. The attributes must be chosen and combined carefully regarding the objects of interest.
Figure 6. Vegetation (green) and roads (red) classes identified by textural classification
4. Spectral objects identification
4.1 Spectral database
In parallel of the morphological database, a spectral one was generated directly from the HySpex image, by extracting the major pure classes and their relative spectra, which are: roads, shadowed roads, vegetation, roofs, shadowed roofs, high emittance roofs. Each class was composed of at least 4 training spectra to perform the supervised spectral classification. The method is planned to incorporate an autonomous spectral database of laboratory and field campaigns urban objects.
4.2. Supervised classification
To identify the build-up areas we have used two classical classification methods; Minimum Distance (Richards and Jia, 1999) and Spectral Angle Mapper (SAM) (Kruse et al, 1993). The first classification is a supervised one based on the selection of Regions of interest (ROI) and combined with the minimum distance algorithm. In a second steps we wanted to take advantage of the high spectral resolution of the HySpex image, so we used a spectral classification based on the SAM algorithm to recognize the built-up areas regarding their spectral attributes. To do that, we have used the spectral database as an input of the SAM method. We have in a second step merged the results of the two classification methods, below, the final classification result (Figure 7).
Figure 7. Generation of vector map of buildings (i.e. object sets) identified by supervised classification.
To recognize vegetation and roads, we have used the SAM method. Vegetation is well identified using 4 reference spectra extracted from the HySpex hyperspectral image (Figure 8, in green). Roads are also well identified as long as we take enough representative spectra (Figure 8, in red), because road spectra are not homogeneous and can be particularly affected by shadow in certain area. In this example we have taken only 5 reference spectra in shadowed and non-shadowed areas.
Figure 8. Vegetation (green) and roads (red) classes identified by supervised classification
4. Classification by morpho-spectral database
The last sequence of image processing concerns the classification and categorization of buildings according to their spectral, statistical and geometrical attributes (i.e. characters) registered in the morpho-spectral built-up spectral and object-oriented database. A hierarchical ascendant classification method combined with a spectral identification method was applied for calculating clusters and generating a typology of the shapes of buildings. The goal is to take advantage of both spectral and morphological attributes of urban objects (Figure 9).
Figure 9. Classification of building types regarding their morphometric and spectral attributes
5. Socio-economic urban classes’ identification
The example below (Figure 10), illustrates a typology of the attended morpho-spectral classification of urban objects. The morpho-spectral database will be very useful in the urban objects identification process, the objects will be identified and characterized regarding their spectral and morphometric attributes. In our example we have made a global identification of the urban materials by spectral classification (Figure 10, in yellow), then we have extracted 2 sub-classes by morphological classification (Figure 10, in magenta and blue), these sub-classes were recognized by textural attributes (texture mean) at bands 414 nm for the magenta class (i.e. complex and large forms) and 741 nm for the blue class (i.e compact forms). The urban classes map (Figure 10) was generated by superposing the 2 urban sub-classes to the global urban map. We can divide the recognized urban objects into three classes; big structures with complex form (e.g. shopping mall, big parking, commercial activities, university campus) (Figure 10, in magenta), big enough structures with classical architecture (e.g. library/covered swimming pool, opera, theatre, museum, religious building, administrative building) (Figure 10, in yellow), mean structure with simple form and long shape (e.g. residential/professional building, shops/services) (Figure 10, in blue). The test zone is a part of an image acquired over the city center of Toulouse in France, the method will be applied later on the complete image set and other classes are excepted to be identified using our method; airports, train stations, industrial sites, etc.
Figure 10. Identification of the socio-economic functions of buildings based on their morpho-spectral attributes: shopping
mall/parking's (magenta), cultural/religious/administrative building (yellow), residential/professional building (blue)
4. Conclusion
This paper present an original method based on the use of a morpho-spectral database to classify the objects in a dense urban context. The use of morphological approach to classify object is an interesting concept that take advantage of the objects geometry. The concept could be enhanced and optimized by introducing some spectral attributes in addition to the geometry; the objects could be identified and characterized more accurately. The use of ontological object
characters (i.e. attributes) such as statistics and geometry for recognition, mapping, identification and categorization involves applications in the fields of urban climatology (e.g. Su et al, 2008), geomorphology and hydrology (e.g. Dragut and Blaschke, 2006; Anders et al., 2011), and, at times, urban geography for the characterization of the attributes of buildings (Carneiro et al, 2010).The spectral attributes have been used in environmental contexts; recognition of asbestos-cement roofing (Bassani et al., 2007), recognition of hazardous materials (Cavalli et al., 2009), and for urban characterization; classification of urban materials (Kotthaus et al., 2014). Morphological approaches make it possible to reduce the spatio-temporal and seasonal variability found in the spectral responses of objects (Nichol, 1996) and spectral approaches permits to go beyond the form recognition and give us the possibility to recognize the object nature. The use of a morpho-spectral approach could be very useful in the identification and characterization of urban objects due to the complexity of the urban context. These aspects can serve as a basis for developing reproducible analytical methodologies for urban territories, and for recognizing one major socio-economic indicator: urban built objects (Gadal, 2002). The methodology is expected to be updated and enhanced and is planned to be applied to dense urban areas in France (Toulouse and Amiens) and Lithuania (Kaunas) using different sensors types in addition to HySpex (Sentinel - 2 and PLEIADES and ThemisVision VNIR 400T).
AKNOWLEDGEMENTS
This research was supported by the French National Research Agency (ANR) through the Hyep project (ANR-14-CE22-0016).
REFERENCES
Anders, N. S., Seijmonsbergen, A. C., and Bouten, W., 2011. Segmentation optimization and stratified object-based analysis for semi-automated geomorphological mapping.
Remote Sensing of Environment, 115(12), pp. 2976-2985.
Bassani, C., Cavalli, R. M., Cavalcante, F., Cuomo, V., Palombo, A., Pascucci, S. and Pignatti, S., Aug. 2007. Deterioration status of asbestos-cement roofing sheets assessed by analyzing hyperspectral data. Remote Sensing of
Environment, 109(3), pp. 361–378.
Behling, R., Bochow, M., Foerster, S., Roessner, S., and Kaufmann, H., Jan. 2015. Automated GIS-based derivation of urban ecological indicators using hyperspectral remote sensing and height information. Ecological Indicators, vol. 48(0), pp. 218–234.
Cavalli, R.M., Pascucci, S., and Pignatti, S., Aug. 2009. Hyperspectral remote sensing data to map hazardous materials in a rural and industrial district: The Podgorica dwellings case studies. In Hyperspectral Image and Signal Processing:
Evolution in Remote Sensing, 2009. WHISPERS '09. First
Workshop on (pp.1,4), Grenoble, France.
Carneiro, C., Morello, E., Voegtle, T., and Golay, F. 2010. Digital Urban Morphometrics: Automatic Extraction and Assessment of Morphological Properties of Buildings.
Chein-I Chang, Aug 2000. An information-theoretic approach to spectral variability, similarity, and discrimination for hyperspectral image analysis. Information Theory, IEEE
Transactions on , 46(5), pp.1927,1932.
Dragut, L. and Blaschke, T., 2006. Automated Classification of Landform Elements using Object-Based Image Analysis.
Geomorphology, 81(3-4), pp. 330-344.
Gadal, S., 2002. L’interprétation d’image dans l’explication géographique. Géopoint 2000, vol. 13, pp. 129-132.
Gadal, S., 2011. Métropolisations, territoires émergents et
systèmes géographiques d’informations et de modélisation
territoriale. Habilitation memory, vol. 1, University of Paris
Diderot Paris 7.
Gadal, S., Oct.2012. Generation of an urban object oriented morphometry database by the remote sensing of SPOT 5 panchromatic images. Proceeding of ESA-EUSC-JRC 8th
Conference on Image Information Mining, Oberpfaffenhofen,
Germany.
Gauthier, G., 1999. Une approche alternative en traitement d’image: la représentation par objet, ADCIS report.
Heldens, W., Heiden, U., Esch, T., Stein, E., and Müller, A., 2011. Can the Future EnMAP Mission Contribute to Urban Applications? A Literature Survey. Remote Sensing, 3(9), pp. 1817–1846.
Heiden, U.; Roessner, S.; Segl, K.; Kaufmann, H., 2001. Analysis of spectral signatures of urban surfaces for their identification using hyperspectral HyMap data. Remote
Sensing and Data Fusion over Urban Areas, IEEE/ISPRS
Joint Workshop 2001, pp.173,177, Rome, Italy.
Heiden, U., Segl, K., Roessner, S., and Kaufmann, H., Dec. 2007. Determination of robust spectral features for identification of urban surface materials in hyperspectral remote sensing data. Remote Sensing of Environment, 111(4), pp. 537–552.
Herold, M., Gardner, M., Hadley, B., and Roberts, D. A., June 2002. The Spectral Dimension in Urban Land Cover Mapping from High Resolution Optical Remote Sensing Data.
Proceedings of the 3rd Symposium on Remote Sensing of
Urban Areas. Istanbul, Turkey.
Herold M. and Roberts D. A., 2010. The Spectral Dimension in Urban Remote Sensing. Remote Sensing and Digital Image
Processing, 10(1), pp. 47-65.
Jin, X., filed Nov. 14, 2007, and issued Sept. 4, 2012. Segmentation-based image processing system. U.S. Patent 8,260,048.
Kärdi, T., 2007. Remote sensing of urban areas: linear spectral unmixing of Landsat Thematic Mapper images acquired over Tartu (Estonia). Proceedings of the Estonian
Academy of Sciences, Biology and Ecology, 56(1), pp. 19-32.
Kotthaus, S., Smith, T. E. L., Wooster, M. J., and Grimmond, C. S. B., Aug. 2014. Derivation of an urban materials spectral
library through emittance and reflectance spectroscopy. ISPRS
Journal of Photogrammetry and Remote Sensing, 94(0), pp.
194–212.
Kruse, F. A., A. B. Lefkoff, J. B. Boardman, K. B. Heidebrecht, A. T. Shapiro, P. J. Barloon, and A. F. H. Goetz, 1993. The Spectral Image Processing System (SIPS) - Interactive Visualization and Analysis of Imaging spectrometer Data.Remote Sensing of Environment, 44(2-3), p. 145 - 163.
Longley, P.A. and Mesev, V., 2000. Measuring Urban Morphology using Remotely-Sensed Imagery. in: J. P. Donnay, M. J. Barnsley, and P. A. Longley, (eds.) Remote
Sensing and Urban Analysis: Volume 1. CRC Press - Taylor
& Francis: London, UK, pp. 148-168.
Mohan Kumar, H. P. and Nagendraswamy, H. S., 2011. GAIT recognition based on symbolic representation. International
Journal of Machine Intelligence, 3(4), pp. 295-301.
Myint, S. W., Mesev, V., and Lam N., 2006. Urban Textural Analysis from Remote Sensor Data: LacunarityMeasurements Based on the Differential Box Counting Method.
Geographical Analysis, 38(4), pp. 371-390, 2006.
Nichol, J. E., 1996. Visualization of urban surface temperatures derived from satellite images. International
Journal of Remote Sensing, 19(9), pp. 1639-1649.
Ober, G., Tomasoni, R. and Cella, F., 27 July - 1 August 1997. Urban Texture Analysis. Proceedings of the
International Symposium on Optical Science Engineering and
Instrumentation, San Diego, USA.
Plaza J., Plaza A., Gamba P., and Trianni G., 11-13 April 2007. Efficient Multi-Band Texture Analysis for Remotely Sensed Data Interpretation in Urban Areas. Proceedings of the
Urban Remote Sensing Joint Event 2007, Paris, France.
Richards, J. A. and Jia, X., 1999. Remote Sensing Digital Image Analysis: An Introduction. 3rd ed. Secaucus, NJ, USA: Springer-Verlag New York, Inc.
Roerdink, J. and Meijster, A., 2001. The Watershed Transform: Definitions, Algorithms and Parallelization Strategies. Fundamenta Informaticae, 41(1-2), pp.187-228. Shaban, M.A. and Diskshit, O., 1999. Land Use Classification for Urban Areas using Spatial Properties. In Proceedings of
the International Geoscience and Remote Sensing Symposium
99, IGARSS 99, 2(0), Hamburg, Germany.
Su, J. G., Brauer, M., and Buzzelli, M., 2008. Estimating Urban Morphometry at the Neighborhood Scale for Improvement in Modeling Long-Term Average Air Pollution Concentrations. Atmospheric Environment, 42(34), pp. 7884-7893.
Xiaoying, J. 2009. Segmentation-based image processing
system. US Patent 20090123070, filed Nov. 14, 2007, and