HAL Id: insu-01187270
https://hal-insu.archives-ouvertes.fr/insu-01187270
Submitted on 23 Jan 2016
HAL is a multi-disciplinary open access
archive for the deposit and dissemination of
sci-entific research documents, whether they are
pub-lished or not. The documents may come from
teaching and research institutions in France or
abroad, or from public or private research centers.
L’archive ouverte pluridisciplinaire HAL, est
destinée au dépôt et à la diffusion de documents
scientifiques de niveau recherche, publiés ou non,
émanant des établissements d’enseignement et de
recherche français ou étrangers, des laboratoires
publics ou privés.
Upper stratospheric (30–50 km) lidar observations of
the ozone vertical distribution
Jacques Pelon, Sophie Godin, Gérard Mégie
To cite this version:
Jacques Pelon, Sophie Godin, Gérard Mégie. Upper stratospheric (30–50 km) lidar observations of
the ozone vertical distribution. Journal of Geophysical Research: Atmospheres, American Geophysical
Union, 1986, 91 (D8), pp.8667-8671. �10.1029/JD091iD08p08667�. �insu-01187270�
JOURNAL OF GEOPHYSICAL RESEARCH, VOL. 91, NO. D8, PAGES 8667-8671, JULY 20. 1996
Upper Stratospheric (30-50 km) Lidar Observations
of the Ozone Vertical
Distribution
J. PELON, S. GODIN, AND G. M•,GIE
Service d'A•ronomie du Centre National de la Recherche Scientifique, Verridres le Buisson, France
A maximum reduction of 20% of the ozone content in the altitude range 35-45 km is presently expected within the next 50 years. Early detection of trends is thus of particular importance to confirm such extrapolations. An active lidar system, which uses a powerful exciplex laser as the emitting source at 308 nm, has been operated at the Observatoire de Haute Provence to probe the upper stratospheric ozone distribution. A description of the lidar system and results of the measurements are given and compared with those obtained simultaneously by already proven techniques such as Brewer-Mast sondes and Umkehr spectroscopic measurements. A general agreement within the uncertainties of the various methods is found. The data are further analyzed to determine a total error budget and to extrapolate the potentiality of lidar systems, using up-to-date laser sources to reach a precison better than 3% in the considered altitude range.
1. INTRODUCTION
Anthropogenic emissions of nitrogen and chlorine source species (N20 , chlorofluormethanes) have been shown to repre- sent a potential threat to the atmospheric ozone layer, leading
to modifications in the radiative and chemical balance of the
earth's environment. Whereas at the present time the calcu- lated total content variation in the ozone column stays below 5%, large modifications of the ozone vertical distribution are expected to occur [National Academy of Sciences, 1982]: at
altitudes between 35 and 45 km a maximum reduction of 20%
is presently extrapolated as a result of chlorine-activated de- struction cycles. On the other hand, an increase of •20% is expected below 15 km because of NOx emissions. Because of the radiative properties of ozone, both in the UV and IR
wavelength ranges, such variations will greatly modify the thermal budget of the coupled troposphere-stratosphere
system and directly influence the earth's climate. Detection of
ozone trends is thus of particular importance to confirm the present day theories; it presently relies on both ground-based (Dobson spectrophotometer using the Umkehr technique) and
satellite-borne passive experiments such as backscattered
ultraviolet and solar backscattered ultraviolet experiments [World Meteorological Organization (WMO) 1982]. Such sys- tems, however, have been recently shown to have intrinsic limitations, mainly due to calibration problems inherent to
passive sensors [Fleig et al, 1980].
Consequently, during the last few years, active lidar profil- ing of the ozone vertical distribution by the differential ab- sorption laser (DIAL) technique in the UV wavelength range has been developed using two different type of laser sources:
(I) Nd3+: Yag pumped
dye lasers
which
enable
a large tuning
range of the UV-emitted wavelengths from 280 to 305 nm,
thus allowing measurements both in the troposphere and
stratosphere up to altitude levels between 35 and 40 km
[Pelon and M•gie, 1982a, b]; and (2) exciplex laser sources using xenon chloride (XeC1) as an active medium and emitting at 308 nm, the off-wavelength being usually generated by
Raman-shifting
techniques
[Uchino
et al., 1983;'Werner
et al.,
1983].
Copyright 1986 by the American Geophysical Union.
Paper number 6D0201. 0148-0227/86/006D-0201 $05.00
Such systems have proven their ability to study the ozone number density variations in the troposphere and stratosphere
associated with mesoscale dynamic processes [Pelon and
M•gie, 1985] and short-scale processes taking place within tropopause fold events occurring in the mid-latitude regions [Vernin and Pelon, 1985]. However, the rapid decrease both in atmospheric total density, which provides the support for light backscattering, and in ozone number density, which relates to the local optical thickness to be measured, makes measure- ments above 35 km very difficult without greatly increasing the laser-emitted power. The purpose of this paper is to de- scribe the potentiality of lidar systems using a powerful exci- plex laser source as the emitter to actively probe the upper stratospheric ozone distribution (30-50 km). Following the de- scription of the experimental setup and related parameters, results of a first experiment will be presented, which will be used as a comprehensive basis for further extrapolation of the system accuracy with respect to the early detection of ozone concentration trends density in the upper stratosphere.
2. EXPERIMENTAL SYSTEM
The lidar system used for ozone measurements at the Ob- servatoire de Haute Provence (44øN,5øE) since 1981, and the principle of the DIAL method have already been presented in
detail by Pelon and M•gie [1982a]. In September 1983 an
exciplex laser source was added to the system to probe the ozone vertical distribution in the upper atmosphere. The characteristics of the experimental setup are given in Table I.
The emitter was an XeC1 exciplex laser provided by the SOPRA Company under contract with the Centre National d'Etudes Spatiales (CNES) in France. At the time of the exper-
iment this system was in its first phase of development, and its emitting characteristics were therefore limited as far as the emitted energy is concerned. It included a single-oscillator cavity in a two-plane mirror configuration. The active medium was a gas mixture of Ar/He/Xe/HC1. Because of the large divergence of the system in this multimode configuration (5 mrad), the output energy had to be reduced from its nominal value (200 mJ) by spatial filtering to a value of 70 mJ, compat- ible with a 1-mrad maximum divergence adapted to the lidar
receiver field of view. The pulse repetition rate was 20 Hz. No spectral selection was made in the oscillator cavity, so that the emitted spectrum included three laser lines, at 307.71, 307.96, 8667
8668 eELON ET ,AL.' OZONE VERTICAL DISTRIBUTIONS
TABLE 1. Characteristics of Lidar System Used at the Observa- toire de Haute Provence in September 1985
Parameter Value Emitted energy Ex 70 mJ (308 nm) E 2 60 mJ (355 nm) Repetition rate r• 20 Hz (308 nm) r 2 10 Hz (355 nm) Telescope area 0.5 m 2 Optical yield •/• 6% (308 nm) r/2 3% (355 nm)
and 308.21 nm, as recorded by a high-resolution spectrometer (Figure 1). The relative energy emitted in each of these lines had been measured and corresponded respectively to 2, 63, and 35%. Having characterized the laser spectral emission, it was then possible to compute the effective integrated absorp- tion cross section of ozone over the laser lines; the resulting
value was 1.20 x 10 -19 cm 2 at 243 K. The absolute ozone
cross-section values in this wavelength interval (307-309 nm) in the Huggins bands were taken from the recent results of Bass and Paur [1985] and correspond to a total relative vari- ation over the laser-emitted spectral range of less than 3% (Figure 1) (see section 4 for a discussion of the related error on the ozone determination).
The off wavelength required for the DIAL measurement
corresponded
to the third harmonic
of a Nd 3 +: Yag laser
(355
nm) already available at the lidar facility. The wavelength interval of 47 nm between the two emitted wavelengths is very
similar to the one obtained by Raman shifting in an hydrogen
cell [Loree et al., 1979]. Its large value precluded any
measurement at an altitude level below 25 km, since during September 1983 the aerosol load in the stratosphere following
the March 1982 eruption of E1 Chichon was still very high.
The off wavelength of the DIAL measurement (355 nm) was thus used to monitor simultaneously the atmospheric back-
scattering coefficient between 15 and 50 km.
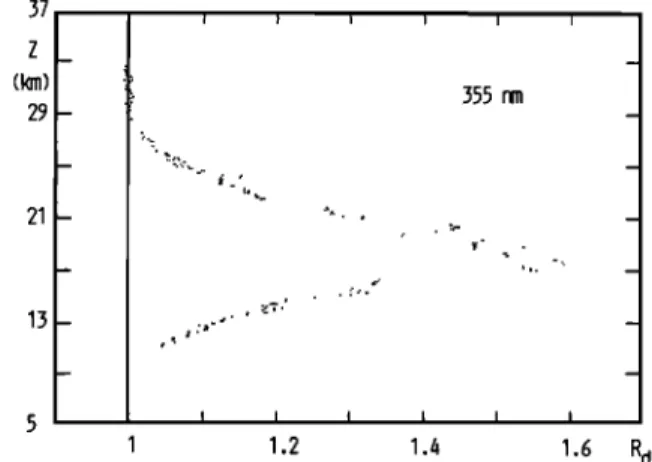
Two types of information can then be derived from this measurement: (1) The aerosol scattering ratio at 355 nm can be determined by comparing the lidar data with the atmo- spheric density profile measured by a meteorological rawin- sonde at the same location. Scattering ratios up to 1.6 have
E(X) (a.u.) 400 200 100 40 20 10 I I I 307.75 308. O0 308.25 x (rim)
J
(1019
003
cm
2)
1 0.5 - 0Fig. 1. Recorded spectrum of the emitted XeCI laser impulsion (solid line) as compared to the variation of the ozone absorption cross section near 308 nm (dotted line).
37
..
'
"7.:
't
:"
I I I
z (k•) 29 ß ... 13 .5 I I 1 1.2 i I 355 nm I I I I 1.4 1.6Fig. 2. Typical aerosol-scattenng ratio recorded by lidar sound- ing at 355 nm in mid-September 1983 at the Observatoire de Haute
Provence.
been observed around 20 km, whereas no aerosol layer was detected above 30 km (Figure 2). This result was further con- firmed by lidar observations performed at 532 nm during the same time period. (2) Assuming thus that pure molecular scat- tering is only present above 30 km, the atmospheric density profile up to 50 km is determined by normalizing the lidar
signal to the density values obtained from the rawinsonde
data between 30 and 35 km. This allows the calculation of the
Rayleigh extinction used to correct the ozone concentration profile [Pelon and M•gie, 1982a] and the determination of the ozone mixing ratio distribution, which will be used for further
comparisons with in situ measurements (see section 3). Finally, the temperature profile in the same altitude range can be de- termined, assuming hydrostatic equilibrium and a pressure boundary condition [McCormick et al., 1967; Hauchecorne et
al., 1980].
For the high-altitude measurements considered here, the
backscattered signals are time sampled at 0.5 MHz, using the photon-counting mode. The data reduction used to derive the
ozone number density is similar to the one described by Pelon and M•gie [1982a].
3. RESULTS
The above-described system was operated during 5 nights in September 1983 at the Observatoire de Haute Provence. These measurements were performed within the framework of the Middle Atmosphere Program (MAP) Global Budget of Stratospheric Trace Constituents (GLOBUS) International Campaign [Offermann, 1984], allowing comparisons with other measuring techniques.
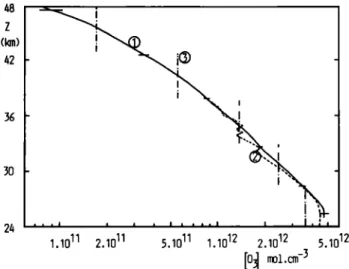
Figure 3 shows the average profile of the ozone distribution between 25 km (above the ozone maximum) and 48 km, inte- grated over 5 nights between September 17 and September 24,
1983.
The total integration
time of 4 hours corresponds
to l0 s
laser shots sequentially emitted on each wavelength. The alti- tude resolution is determined by the smoothing filter applied to the rough data and ranges from 0.6 km at the lower alti- tudes to 7.2 km at the uppermost level. The error bars plotted
on this profile correspond only to the statistical error com-
puted from the variances of the individual signals [Pelon and
M•gie, 1982a]. Up to 30 km this error stays below 2%; it
increases rapidly above this altitude and reaches 18% at 45 km. Figure 4 shows the ozone mixing ratio distribution deter- mined from the lidar-measured atmospheric density profile, as indicated in section 2.
PELON ET AL..' OZONE VERTICAL DISTRIBUTIONS 8669
48
!
(km)
i
62 - 362/; '' ''
,
, . , ....
,
i
. I.:,
1.10
TM 2.10
TM
5.1011 1.1012 2.1012 5.1012
Fig. 3. Lidar averaged ozone profile (cume 1, solid line) during 5 nights between Septembe• 17 and September 24, 1983, compared to t•e a•erage balloon-home Brewer-Mast sondes profile (cur•e 2, dotted li•e) a•d to t•e a•e•ase Umke• p•o•le (cu•e 3, •ertical dotted line) obtained during t•e same period of time.
During the course of the MAP-GLOBUS campaign several
other techniques were used to measure the ozone vertical dis-
tribution, including ground-based UV, IR, and microwave spectrophotometers and balloon-borne ozonosondes. At the Observatoire de Haute Provence, two systems were operated routinely: the Dobson spectrophotometer (number 85) automated for Umkehr measurements [Komhyr et al., 1985] and balloon-borne Brewer-Mast ozonosondes. A comparison of the results of these two instruments (averaged between Sep- tember 17 and September 24) with the lidar measurements is given in Figure 3. At lower altitudes the sonde data can still be considered as reliable, whereas some scattering in the measurements above 30 km can already be detected due to pump efficiency problems. Below 30 km, as already demon- strated in the case of the dye laser emitter rPelon and M•gie, 1982b], good agreement is obtained within the accuracies of the two instruments. Considering the Umkher data, the con- version from partial pressure to ozone number density has been made using a combination of radiosonde data and lidar data to calculate the vertical temperature distribution, as de- scribed previously. The temperature effectively used in the computation is then the temperature measured at the pressure level corresponding to the mean altitude of the Umkehr layer. As represented in Figure 3, taking into account the difference in altitude resolution of the two systems, the comparison leads again to a rather good agreement. The differences for layers 7 to 9 (32 to 48 km) are lower than 3%, for example, within the error bars of the measurements, including the uncertainties
due to the calculation of the ozone concentration from
Umkehr measurements and the accuracy on the ozone ab-
sorption cross sections. In layers 5 (23.5 to 28 km) and 6 (28 to
32 km), Umkehr values are lower by 20 and 8% respectively. This difference can most likely be attributed to the presence of aerosols at lower altitudes (cf. Figure 2) [DeLuisi, 1979].
Whereas these measurements already give a fair evaluation of
the lidar system accuracy for ozone measurements above 40 km, a definitive answer with respect to the potentiality of this system for ozone trends monitoring will be given only after
completion of numerous measurements allowing a statistical
analysis of the system performances. However, these prelimi- nary measurements can be used to evaluate the measurement
precision which will be obtained with up-to-date exciplex lidars as presently achievable, taking into account both statis-
tical and systematic errors.
4. DISCUSSION
As pointed out previously, one of the major goals in the
monitoring of the stratosphere is the early detection of any
ozone depletion at the 40-km altitude level. In this respect the main advantage of an active system such as the lidar is the operator control of the source, which leads to autocalibration of each system at any time and thus its independence within a given network. This is due to the fact that the ozone number density is directly derived by ratioing the signals themselves
for two altitude levels and two wavelengths each. The only
assumption to be made is then the constant time response of the system, in microseconds range, which corresponds to the height resolution.
Two types of errors have to be considered, as already ana- lyzed by Pelon and M•gie r1982a-I: (1) the statistical error related to the signal to noise ratio and to the local ozone absorption to be measured (this error is dependent on the choice of the emitted wavelengths and on the system parame- ters), and (2) systematic errors related to the accuracy of the measured effective ozone absorption cross section and its tem- perature dependence as well as to potential interferent extinc- tion and absorption processes.
The optimization of range-resolved DIAL measurements in terms of operating wavelength depends in principle on three different parameters [M•gie and Menzies, 1980]: (1) the ef-
ficiency
p of the scattering
process,
which varies
as •-4 if one
considers Rayleigh scattering to be the dominant process, (2) the integrated on-line optical thickness z between the emitter and the scattered volume, and (3) the local optical thickness At, to be measured within the height resolution of the lidar system. Neglecting temperature variations of the absorption cross section with height, Az can be considered to the first order, as far as wavelength dependence is concerned, as di-
rectly proportionnal to z.
Over a 20-nm wavelength interval between 290 and 310 nm,
p only varies by 25%, whereas the variation of r, which is directly related to the wavelength dependence of the ozone
5O z (kin) 4O 3O ! i o lO I I I • I I I 2 6 6 8
r03
( ppmv
)
Fig. 4. Same lidar average ozone profile as Figure 4 but calcu- late. d in terms of mixing ratio, using the atmospheric density values deduced from the off-wavelength measurements.
8670 PELON ET AL.' OZONE VERTICAL DISTRIBUTIONS Z E = 2• (km) •0 3O 1200 m 20
10
2
10
3
10
6
t 1 (s)
Fig. 5. Integration time t i necessary to achieve a 2% accuracy for the lidar ozone measurements as a function of height for different height resolutions (simultaneous emission and detection at both wavelengths).
absorption, varies by a factor of 12. The integrated optical thickness is thus the relevant parameter to be optimized by the choice of the operating on-line wavelength; its optimum
value is then shown to be 1.1 [M•gie and Menzies, 1980].
Considering an average ozone altitude distribution for mid-
latitude regions [Krueger and Minzner, 1976] and the ozone
absorption cross sections as given by Bass and Paur !-1985], the optimum wavelength for measurements between 35 and 50
km at mid-latitudes for ground-based measurements is then
308 nm, corresponding exactly to the XeC1 exciplex laser
output wavelength.
The statistical error on the measurements can then be com- puted from the usual lidar equation, which relates the back- scattered signal P(•, Z) at a given wavelength as a function of
the altitude Z, to the lidar system parameters, and the atmo-
spheric scattering process !-Schotland, 1974]: A
P(,•,
Z) = r/E(,•)
•2 [/•rn(/•'
Z) q-
/•p(/•,
Z)]
ß exp - {2(Zo,
+ z,, + %)(,•,
Z)}
(1)
where r/ is the receiver optical efficiency; E(,•) the emitted
energy
at the wavelength
4; A the telescope
area; fl,• and fly
the molecular and particular backscattering coefficients, re-
spectively;
and Zo3,
z,•, and zv the optical thicknesses
due to
ozone absorption, molecular, and particular extinction, respec- tively.
The accuracy e on the measurements of the ozone number
density no3(Z) for a vertical resolution
AZ and a number of
laser shots N is then given, in the absence of background noise, by
e = 2A{7o3(g)rto3(g)
AZ(N1/2)
i,j:l ]5('•i,
gj)
(2)
where Aao3(Z
) is the differential
ozone absorption
cross sec-
tion between the two emitted wavelengths ,• and '•2, and P(,•i,
Zj) is the backscattered
signal
averaged
on N laser shots
and
filtered to obtain an altitude resolution AZ at the wavelengths
,•i (i- 1, 2) and for the altitudes
Zj = Z + (j- •) AZ (j = 1,
2).
Such an expression will allow us to scale different systems or to perform a tradeoff between the relevant parameters of a given lidar system as it gives the dependence of the accuracy e
on the emitted laser energy E, the receiver efficiency r/, the receiving telescope diameter D, the integration time ti, and the
height resolution AZ;
e oct
i - •/2AZ- 3/2(Er/)-
1/2D- 1
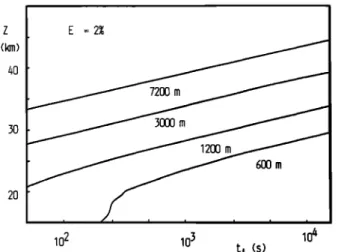
(3)Taking into account the present status of development of exci-
plex lasers, the experimental results obtained in September 1983 have been extrapolated, assuming an on-line output energy of 250 mJ (20-Hz pulse repetition frequency) and an
off-line output energy of 60 mJ (20-Hz pulse repetition fre-
quency) for a respective receiver optical efficiency of 6 and 3%
and a 0.5 m 2 area telescope.
The results
are shown
on Figure 5
representing, as a function of altitude, the integration time required for a 2% accuracy on the measurement, considering nighttime conditions. Possible tradeoffs, as given by (3), will have also to be taken into account with respect to the scientif- ic objectives of the measurements. Whereas long integration times, over a whole night, are possible for trend studies, short- er integration times are requested for studies of shorter-scale ozone fluctuations, leading to tentative correlations with tem- perature variations.
Besides the signal statistical errors, systematic errors of various types have also to be considered.
The absolute values of the ozone cross sections seem to be
presently known in the Huggins bands below 320 nm with a _+ 3% accuracy !-Malicet et al., 1985]. However, the relative precision over the same spectral range is better, of the order of 1-2% [Paur and Bass, 1985]. Only the latter has to be con- sidered here, as ozone number densities can always be recom- puted from the lidar data, taking into account the latest deter- minations. Of particular importance is the temperature depen-
dence of the cross sections in this wavelength range, which at
40 km, might introduce an error of about 0.2% per degree in the difference between the assumed and the true temperature
profiles. However, using a combination of radiosonde and
lidar data to derive the vertical temperature profile as men- tioned previously, this error can be reduced to 0.5%, consider- ing absolute temperature accuracies of about 1-2%.
Also to be considered is the influence of the laser line width
and emitted wavelength fluctuations on the effective absorp-
tion cross-section determination. The natural emission width
of the XeCI laser is of the order of •0.1 nm and corresponds to two to four different lines, depending on the operating pres- sure [Tellinghuisen et al., 1976]. In calculating the effective cross section, one has thus to take into account both the line
positions and their relative intensity (cf. Figure 1) which
should be checked during the experiment to maintain the sys-
tematic error below 0.2%.
The differential Rayleigh extinction for a 47-nm wavelength separation between the on (308 nm) and off (355 nm) wave- lengths induces an error in the measured ozone concentration of the order of 3% at 40 km. It has thus to be accounted for, using either model average density profiles or radiosonde-
calibrated lidar data. Such a correction will drop the associ-
ated systematic error below 0.1% for the altitude levels above
25 km.
Mie scattering due to aerosol particles also introduces a differential extinction error. Here again as for temperature and density corrections, one can use the lidar off-line wavelength to monitor the aerosol scattering ratios in the altitude range of
the measurement. Under normal conditions the aerosol extinc-
tion coefficient above 30 km altitude is lower than 2 x 10 -½
PELON ET AL.' OZONE VERTICAL DISTRIBUTIONS 8671
error of 0.5%, thus requiring no correction. If high-aerosol content is present, a correction should be made, assuming a knowledge of the nature and shape of the aerosol particles from other measurements and using aerosol models to reduce the error to a similar value. In this case a third wavelength in the UV range has to be used, as the atmospheric molecular scattering profile cannot be derived with a single off wave- length. It is important to point out here that due to the range- resolved nature of the lidar soundings, the measurements at a given level are insensitive to the aerosol content at lower alti-
tudes.
Interferences due to absorptions by other. minor constit- uents such as SO2 and NO2 also must be considered. Whereas such interferences are of importance for ozone measurements at very low altitudes [Pelon and M•gie, 1982a] the very low concentration of such species relative to ozone at altitude
levels above 20 km reduces their values to less than 0.3%
under normal conditions (NO• at 40 km), leading to errors lower than 0.1% after correction using an averaged profile.
When considering the overall uncertainty resulting from both statistical and systematic errors, as analyzed here, lidar measurements using up-to-date commercially available laser sources will have the potentiality to probe the ozone distri- bution in the upper stratosphere with a precision compatible with the geophysical objectives: at 40 km for a 4-hour integra- tion time one can expect a global precision better than 3% for a 3.5-km altitude resolution, whereas the same precision will require an integration time of 6 hours and an altitude resolu-
tion of 7 km at 45 km.
CONCLUSION
The use of powerful ½xciplex laser sources directly emitting in the UV spectral range has allowed lidar monitoring of the ozone vertical distribution up to the 48-km altitude level. Ex- trapolations show that precisions better than 3% are within
the range of the expected performances of updated lidar sys-
tems. Such a station will be implemented at the Obscrvatoir½ de Haute Provence to determine, from a statistical analysis of experimental uncertainties and ozone short-term variations, the potentiality of the lidar system for network monitoring of ozone trends in the upper stratosphere.
Acknowledgments. This work was partly performed during the MAP/Globus 1983 campaign, coordinated by D. Offermann from the University of Wuppertal and has been supported by grants from
CNRS and the Minist•re de l'Environnement. The authors are in-
debted to J.P. Sage and Y. Aubry from the Centre National d'Etudes Spatiales and M. Stehle and G. Allochon of the SOPRA Company for the loan of the exciplex laser and their help in the system installation.
REFERENCES
Bass, A.M., and R. J. Paur, The ultraviolet cross sections of ozone, 1,
The measurements, Proceedings of the Quadrennial Ozone Sympo-
sium, Halkidiki, Greece, edited by C. S. Zerefos and A. Ghazi, p. 606, D. Reidel, Hingham, Mass., 1985.
DeLuisi, J. J., Umkehr vertical ozone profile errors caused by the presence of stratospheric aerosols, d. Geophys. Res., 84, 1766, 1979. Elterman, L., R. Wexler, and D. T. Chang, Features of tropospheric
and stratospheric dust, Appl. Opt., 8, 898, 1969.
Fleig, A. J., V. G. Kaveeshwar, K. F. Klenk, M. R. Hinman, P. I. Bhartia, and P.M. Smith, Characteristics of space and ground- based total ozone observing systems investigated by intercompari- son of Nimbus 7 backscattered ultraviolet (BUV) data with Dobson and M-83 results, Proceedings of the Quadrennial International
Ozone Symposium, Boulder, Colorado, edited by J. London, p. 9, National Center for Atmospheric Research, Boulder, Colo., 1980. Hauchecorne, A., and M. L. Chanin, Density and temperature profiles
obtained by lidar between 30 and 80 km, Geophys. Res. Lett., 7,
565, 1980.
Komhyr, W. O., R. D. Grasse, R. D. Evans, R. K. Leonard, and G. M. Semeniuk, Umkehr observations with automated Dobson spec- trometers, Proceedings of the Quadrennial Ozone Symposium, Halki- diki, Greece, edited by C. S. Zerefos and A. Ghazi, p. 317, D. Reidel, Hingham, Mass., 1985.
Krueger, A. J., and R. A. Minzner, A mid-latitude ozone model for the 1976 U.S. standard atmosphere, d. Geophys. Res., 81, 4477, 1976.
Loree, T. R., R. C. Sze, D. L. Baker, and P. B. Scott, New lines in the
UV: SRS of excimer laser wavelengths, IEEE d. Quantum Electron.
14, 337, 1979.
Malicet, J., J. Brion, and D. Daumont, New values of ozone absolute
cross sections in the ultraviolet spectral range at 298 and 228 K, by a method based upon pressure measurements at constant volume, Proceedings of the Quadrennial Ozone Symposium, Halkidiki, Greece, edited by C. S. Zerefos and A. Ghazi, p. 617, D. Reidel, Hingham,
Mass., 1985.
M•gie, G., and R. T. Menzies, Complementarity of UV and IR differ- ential absorption lidar for global measurements of atmospheric species, Appl. Opt., 19, 1173, 1980.
McCormick, P. D., E. C. Silverberg, S. K. Poultney, U. Van Wigh, C. O. Alley and R. T. Bettinger, Optical radar detections of back- scattering from the upper atmosphere, Nature, 215, 1262, 1967. National Academy of Sciences, Causes and Effkcts of Stratospheric
Ozone Reduction: An Update, National Academic Press, Wash- ington, D.C., 1982.
Offermann, D., The Map.Globus Campaign 1983, Handbook for MAP, vol. 11, edited by C. F. Sechrist, Jr., p. 37, Middle Atmo- sphere Program, Univ. of II1., Urbana, 1984.
Paur, R. J., and A.M. Bass, The ultraviolet cross sections of ozone, 2,
results and temperature dependence, Proceedings of the Quadrennial Ozone Symposium, Halkidiki, Greece, edited by C. S. Zerefos and A. Ghazi, p. 611, D. Reidel, Hingham, Mass., 1985.
Pelon, J., and G. M6gie, Ozone monitoring in the troposphere and lower stratosphere: evaluation and operation of a ground-based lidar station, d. Geophys. Res., 87, 4947, 1982a.
Pelon, J., and G. M•gie, Ozone vertical distribution and total content as monitored using a ground-based active remote sensing system,
Nature, 299, 137, 1982b.
Pelon, J., and G. M•gie, Lidar ozone measurements in the tropo- sphere and stratosphere at the Observatoire de Haute Provence, Proceedings of the Quadrennial Ozone Symposium, Halkidiki, Greece, edited by C. S. Zerefos and A. Ghazi, p. 325, D. Reidel, Hingham,
Mass., 1985.
Schotland, R. M., Errors in the lidar measurements of atmospheric gases by differential absorption, d. Appl. Meteorol., 13, 71, 1974. Tellinghuisen, J., J. M. Hoffman, G. C. Tisone, and A. K. Hays, Spec-
troscopic studies of diatomic noble gas: Analysis of spontaneous and stimulated emission from XeC1, d. Chem. Phys., 64, 2484, 1976. Uchino, O., M. Tokunaga, M. Maeda, and Y. Miyazoe, Differential
absorption lidar measurement of tropospheric ozone with excimer- Raman hybrid laser, Opt. Lett., 8, 347, 1983.
Vernin, J., and P. Pelon, Lidar description of a gravity wave and associated turbulence, Preliminary results, paper presented at Top- ical Meeting on Optical Remote Sensing of the Atmosphere, U.S. Army Res Off., Incline Village, Nev., Jan. 15-18, 1985.
Werner, J., K. W. Rothe, and H. Walther, Monitoring of the ozone layer by laser radar, Appl. Phys., Set. B, 32, 113, 1983.
World Meteorological Organization, The stratosphere 1981, Theory and measurements, Rep. 11, WMO Global Ozone Res. and Monit. Proj., Geneva, 1982.
S. Godin, G. M6gie, and J. Pelon, Service d'Aeronomie du Centre National de la Recherche Scientifique, 91371 Verrieres le Buisson,
Cedex France.
(Received January 6, 1986; accepted February 8, 1986.)