HAL Id: tel-01356200
https://hal.archives-ouvertes.fr/tel-01356200
Submitted on 25 Aug 2016
HAL is a multi-disciplinary open access
archive for the deposit and dissemination of sci-entific research documents, whether they are pub-lished or not. The documents may come from teaching and research institutions in France or abroad, or from public or private research centers.
L’archive ouverte pluridisciplinaire HAL, est destinée au dépôt et à la diffusion de documents scientifiques de niveau recherche, publiés ou non, émanant des établissements d’enseignement et de recherche français ou étrangers, des laboratoires publics ou privés.
Impact of 3D technologies and environment stimuli on
stereo vision perception
Di Zhang
To cite this version:
Di Zhang. Impact of 3D technologies and environment stimuli on stereo vision perception. Optics / Photonic. Télécom Bretagne; Université de Bretagne Occidentale, 2016. English. �tel-01356200�
1
N° d'ordre : 2016telb0389
Sous le sceau de l' Université Bretagne Loire
Télécom Bretagne
En accréditation conjointe avec l'Ecole Doctorale Sicma
Impact of 3D technologies and environment stimuli on
stereo vision perception
Thèse de Doctorat
Mention : Sciences et Technologies Information Communication Présentée par Di ZHANG
Département : Optique
Directeur de thèse : Jean-Louis de Bougrenet de la Tocnaye Soutenue le 13 janvier 2016
Jury :
M. Pascal Mamassian, Directeur de Recherche, Ecole Normale Supérieure (Rapporteur) Mme Emma Gowen, Senior Lecturer, Université de Manchester (Rapporteur)
M. Jean-Louis de Bougrenet de la Tocnaye, Professeur, Télécom Bretagne (Directeur de thèse) Mme Béatrice Cochener, Professeur, CHRU Brest (Examinateur)
M Xinzhu Sang, Professeur, BUPT Pékin, (Examinateur)
I
Acknowledgements
I have been thinking about the acknowledgements since I just started to write the dissertation. The PhD thesis is not only a research project, it is also my three years life. Every chapter I have written, there are stories and experience in it, with the people who were working with me or who had offered their disinterested help to me.
My first and the deepest gratitude belongs to my supervisor Professor Jean-Louis De Bougrenet De La Tocnaye, for the continuous guidance and support of my study and research, for his patience, encouragement, trust and immense knowledge. The characteristic I appreciate the most is his inspiration, it has been always a great pleasure to discuss with him, each time I feel better understanding for my research field and gain more confidence.
My sincere thanks also goes to my team members, specifically for Miss Yulia Fattakhova, Dr. Pascaline Neveu, Miss Stephanie Ferragut, Mr Luay Ahdab, Dr Vincent Nourrit. They have given me immense help when I just entered this new research field, they explained me the basic knowledge with great patience and made so much effort when I carried out my experiments. I am so grateful for my lovely colleagues in Optics department, every time I need voluntary guinea pigs and ask for your participations, I have never gotten a refusal. Suman, Stephen, Barbara, Ion, Maina, Samir, thank you for all your beautiful eyes and precious suggestions for my experiments! For our best secretary Miss Jennifer Romer, if I have to show my gratitude for your help and friendship in one short sentence, it will be: thank you for being one of the warmest parts in my France life.
I would like to express my thankful for my thesis reviewers Dr Emma Gowen-Senior lecture at Manchester University and Professor Pascal Mamassian – director of Laboratoire des Systèmes Perceptifs (UMR 8248 CNRS/ENS), I would not be able to finish my dissertation without your patience in correcting my thesis. I would like to thank Professor Sang Xinzhu from Beijing University of Posts and Telecommunications, for your recommendation of my PhD thesis and help during my stay at Beijing.
Last but not least, I appreciate the help and valuable discussions from professors, researchers and students at Telecom Bretagne, Manchester University, Beijing University of Posts and Telecommunications. I also thank my family and friends for their consistent support and encouragement during my study.
II
Abstract
Comfort viewing experience has been a permanent goal in stereoscopic research due to the development of 3D technologies. However, various parameters affect stereo vision perception. In this thesis, a series of physiological experiments have been carried out aiming at evaluating the 3D visual perception with respect to 3 of the most important factors: 3D display technology, viewing environments and motion-in-depth (MID) perception. First we measured vertical fusion amplitude (VFA) on 3D projectors and an autostereoscopic TV. VFA was chosen as an indicator for visual comfort due to our strong sensitivity to vertical disparity. Several factors have been tested (e.g. viewing distance, background luminance, crosstalk, viewing angle etc.). We compared observer performance on both 3D displays and concluded the tolerance for vertical disparity was better on 3D projector than on autostereoscopic TV. For the environment effect, we measured VFA on a 3D projector by varying the room lighting, 3D content complexity, disparity velocity. We assessed the interaction between central and peripheral fusion, by introducing a series of base-up prisms in front of one eye. We observed that the fusion balance of central and peripheral vision was broken when large peripheral disparities (>4 prism diopter) or stimulus sizes (central stimulus angle < 15°) were induced on the peripheral vision. Finally, we investigated the interaction between sensorial and oculomotor system for MID stimulation. Preliminary results indicated that the motion aftereffect generated by sensorial cue stimulus could be partially mitigated by oculomotor cue and that MID perception performance could be improved by specific trainings. We identified some critical factors for 3D content generation to enhance the MID perception, such as background texture, fixation object dot life time.
III
Résumé
Le confort de visualisation a été un objectif permanent dans la recherche stéréoscopique en raison du développement des technologies 3D. Cependant, divers paramètres affectent la perception de la vision stéréo. Dans cette thèse, une série d'expériences physiologiques ont été menées visant à évaluer la perception visuelle 3D par rapport à 3 des facteurs les plus importants: la technologie d'affichage 3D, les environnements de visualisation et de mouvement en profondeur (MID). Nous avons d'abord mesuré l'amplitude de fusion verticale (VFA) sur les projecteurs 3D et une télévision autostéréoscopique. Le VFA a été choisi comme un indicateur pour le confort visuel en raison de notre forte sensibilité à la disparité verticale. Plusieurs facteurs ont été testés (e.g. distance d'observation, la luminance du fond, la diaphonie, l’angle de vue, etc.). Nous avons comparé les performances d'observateur sur les deux écrans 3D et conclu que la tolérance pour la disparité verticale était meilleure sur le projecteur 3D que sur la télévision autostéréoscopique. Pour l'impact de l'environnement sur la perception stéréo, nous avons mesuré le VFA sur un projecteur 3D en fonction de l'éclairage de la pièce, de la complexité du contenu 3D, de la vitesse de disparité. Nous avons évalué l'interaction entre la fusion centrale et périphérique, en introduisant une série de prismes en face d'un œil. Nous avons observé que l'équilibre de la fusion entre vision centrale et périphérique était rompu quand de grandes disparités périphériques (> 4 dioptries prismatiques) ou tailles de stimuli (angle central du stimulus < 15 °) étaient induites sur la vision périphérique. Enfin, nous avons étudié l'interaction entre le système sensoriel et oculomoteur en stimulation MID. Les premiers résultats indiquent que les post-effets générés par stimulation sensorielle pouvaient être partiellement atténués par des stimulations oculomotrices. Nous avons en outre identifié certains facteurs critiques pour la génération de contenu 3D pour améliorer la perception MID, comme la texture de fond, le temps de fixation objet et la durée de vie des random dots.
IV
Contents
Acknowledgement ……… IV Abstract ……… II Résumé ………. III List of figures ………. IV List of tables …..……… IV Abbreviations ………. IV General introduction ……… 1 1. Chapter 1 Introduction ……….. 61.1. The eye & How we see……….. 8
1.2. Binocular vision……….. 12
1.3. Oculomotor function……….. 18
1.4. Sensory function ……….. 22
1.5. 3D perception stimulation cues……… 32
1.6. 3D display technologies………. 32
1.7. Conclusion ………. 38
2. Chapter 2 3D display technology effect on visual perception……….. 40
2.1. Introduction……… 42
2.2. Methods……… 44
2.3. Procedures……….. 49
2.4. Results and discussions……… 55
2.5. Conclusions ……… 61
3. Chapter 3 Environmental parameters impact on visual perception of 3D stereo objects……… 64
3.1. Introduction……….. 66
3.2. Methods……….. 68
3.3. Procedures………. 72
3.4. Results and discussions……….. 75
3.5. Conclusions……… 85
4. Chapter 4 Motion-in-depth perception……….. 86
4.1. Introduction ………. 88
4.2. Apparatus and subjects……….. 93
4.3. Investigation on sensory and oculomotor system interaction in motion-in-depth perception……….. 95
V
4.4. Corrected experiments for sensory and oculomotor system interaction
investigation in motion-in-depth perception ………. 106
4.5. Motion-in-depth perception training……… 108
4.6. How to design motion-in-depth stimulus……… 114
4.7. Conclusion………... 124
5. Chapter 5 Conclusion and perspectives………..……. 126
Bibliography ………... 131
Appendix A: questionnaire A ……….. 136
Appendix B: questionnaire B………. 137
Appendix C: statistics……….. 138
VI
List of figures
Figure 1. Effect factors for 3D visual perception ………... 2
Figure 1.1 Eye structure. ……… 8
Figure 1.2 Relationship between illuminance regimes and photoreceptor sensitivity. ………. 9
Figure 1.3 Distribution of cones and rods on the retina (Purves D et al, 2001). ………. 10
Figure 1.4 Visual pathways from the eyes to the primary visual cortex. ………. 11
Figure 1.5 The two routes of processing visual information in primate visual cortical area. … 11 Figure 1.6. The geometry of horizontal disparity. ……… 13
Figure 1.7 Diagram showing relative and absolute disparities of 2 points in different depth planes. ………. 14
Figure 1.8 a) Demonstration of vertical disparity generation using 3D stereo system. b) Geometry of vertical disparity calculation. ……….. 15
Figure 1.9 Schematic representation of Horopter. ……… 16
Figure 1.10 Schematic representations of Panum’s area and Panum’s space. ……….…… 17
Figure 1.11 Function of accommodative stimuli and accommodation response. ……….. 19
Figure 1.12 Block diagram of the phasic-tone control and A/V interaction. ……… 21
Figure 1.13 Static interactive dual-feedback model of the A/V system. ………. 22
Figure 1.14 Neuroanatomic functions for binocular vision in striate cortex (V1). …………..…… 23
Figure 1.15 Demonstration of crossed and uncrossed disparity. ……….. 23
Figure 1.16 The demonstration of clear single binocular vision zone. ……… 24
Figure 1.17 a). accommodation under natural viewing condition, b) Vergence-accommodation on stereoscopic display. ……….... 25
Figure 1.18 Schematic illustrations of motion in depth and the associated image motion. ……… 26
Figure 1.19 Illustration of the two mechanisms describing how binocular information is processed for MID perception……… 27
Figure 1.20. Motion cue stimulus conditions. ………. 27
Figure 1.21. A random dot kinematogram used to measure motion sensitivity. ………. 29
VII
Figure 1.23 Simplified classifications of 3D display technologies. ………. 34
Figure 1.24 Stereoscopic display demonstrations. ……….. 35
Figure 1.25 Demonstration of Multiview lenticular autostereoscopic display. ……….. 37
Figure 1.26. Examples of scales used to measure visual comfort of stereoscopic vision. ………. 37
Figure 1.27 Perspectives of the current thesis. ……….. 39
Figure 2.1 a) 3D display platform in experiment 1, b) Autostereoscopic TV in experiment 2. . 46
Figure 2.2 Multiview lenticular autostereoscopic TV in BUPT……… 47
Figure 2.3 Stimulus used for experiments 1 and 2. ……….. 48
Figure 2.4 Experimental setup for Experiment 1. ……….. 49
Figure 2.5 Protocol to measure vertical fusion amplitude. ……….. 50
Figure 2.6 Control test schematic. ……… 52
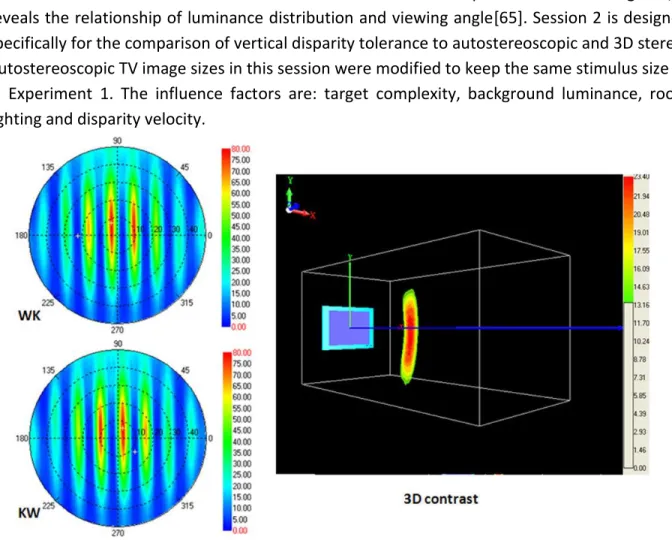
Figure 2.7 Optical characterization of autostereoscopic display……… 53
Figure 2.8 Averaged VFA on 3D projector. The comparison of stimulus size and viewing distance effect on VFA……… ……… 56
Figure 2.9 Averaged VFA on autostereoscopic TV for effect factor of a). Viewing distance, b). Viewing angle, c). Luminance. ………..………. 57
Figure 2.10 Averaged VFA on 3D projector and autostereoscopic TV when stimulus image is Fig. 2.3c. ……….. 59
Figure 2.11 Averaged VFA on 3D projector and autostereoscopic TV when stimulus image is Fig. 2.3c. ……….. 61
Figure 3.1 Images displayed on the screen. Inset zoom of the fixation point of image on up-right part. ……….. 68
Figure 3.2 a) Light refraction when it passes through the prism, b) The view is shifted upward when the eye look through a base-down prism. ……….. 69
Figure 3.3 a) The prism that are used in the current study, b) The prism is inserted in the right view of 3D glasses, thanks to a dedicated prism holder. ……….. 70
Figure 3.4 General experimental demonstrations. ………..… 72
VIII
Figure 3.6 Demonstration of control test, in this test, the right eye image is downward shifted. ……… 74 Figure 3.7 Averaged VFA for all subjects according to different parameters. ……….. 76 Figure 3.8 average VFA under different prism values when the room lighting is off. ………….. 77 Figure 3.9 Average VFA when different prisms were induced. ……….. 78 Figure 3.10 Vertical eye motion when 4 prisms were induced in peripheral retina: 0∆, 2∆, 4∆, 6∆.……….. 80 Figure 3.10 Averaged fusion ratios for all subjects as function of the viewing distance. ……… 81 Figure 3.12 Fitted functions for peripheral fusion effect as a function of stimulus size. ……… 81 Figure 3.13 Mean value of vertical fusion capability for the dominant eye effect (with different value of induced prisms). ………... 84 Figure 4.1 Research motivations for motion in depth perception. ……….. 91 Figure 4.2 view of the haploscope from IRBA in our laboratory. ……….. 93 Figure 4.3 a) 3D display platform and eye-tracker. b) The control software of the eye-tracker, the tracking accuracy and head motion are displayed in real time. ……… 94 Figure 4.4 Demonstrations for Experiment 1-3. ……….. 96 Figure 4.5 Demonstration of cross motion as a function of time. ………. 97 Figure 4.6 a) Stimulus for the binocular view; b) Side view of the stimulus when subject looks through the 3D glasses. ……….. 97 Figure 4.7 a) Example of 4s adaptation and 1s test stimulus during one trial. b) Adaptation session schedule in 1 trial. ………. 99 Figure 4.8 The relative disparity of cross and RDS during 4s adaptation. a) 4 relative positions in depth of the cross and RDS during 4s adaptation motion-toward. b) 4 relative positions in depth of the cross and RDS during 4s adaptation motion-away. ……… 100 Figure 4.9 a) Cross motion direction discrimination during the experiment; b-e) oculomotor system change between pre-stimulus and post-stimulus. ……….. 102
IX
Figure 4.10 MID direction sensitivity for the motion-toward and
motion-away. ……….. 103 Figure 4.11 Fitted psychometric functions (logistic functions) as a function of coherence of the test stimulus (x axis) and the toward answer percentage (y axis). Green curve corresponds to un-adapted test, blue for adaptation motion-toward, and red for motion-away. The point of subjective equality is fixed at a 0.5 threshold. ………. 104 Figure 4.12 Fitted psychometric functions for the un-adapted tests in experiment 2 and 3. The green curve is the fitted logistic function for stable cross. The red curve corresponds to the fitted logistic function in case of cross motion away. The blue curve represents the fitted logistic function for cross moving toward. ……… 105 Figure 4.13 Fitted psychometric functions in experiment 3, the data is an average of the case of cross motion-toward and motion-away. ……….. 106 Figure 4.14 Fitted psychometric functions for the case of un-adapted test, adaptation toward
test and adaptation toward test + cross moving away during 1s test
stimulus. ……… 108 Figure 4.15 Psychometric functions for pre-and post-training session performance for all subjects. ………. 111 Figure 4.16 Psychometric functions for retesting on subject 3 and subject 6, two and nine months after post- training sessions. ………. 112 Figure 4.17 The improvement of MID perception accuracy of the original test and the control test. a) And b) present the data obtained from Subject 3, c) and d) present the result of subject 6. ………..………. 113 Figure 4.18 Stimulus images for the test parameters for background texture, fixation and contrast. ………. 115 Figure 4.19 Plan view of the stimulus when eye vergence effect is tested, a) the fixation cross and background is in the same postion with the screen in depth volume, b) the fixation cross and background is at the bottom of depth volume, c) the fixation cross and background is at the front of depth volume. ………. 116 Figure 4.20 Background Texture effect on MID perception. ……… 117
X
Figure 4.21 Fixation effect on MID perception. ……… 118 Figure 4.22 Stimulus contrast effect on MID perception. ………. 119 Figure 4.23 Relative disparity effects on MID perception. ……… 120 Figure 4.24 Gaze heat map comparison for static stimulus and dynamic stimulus. There are two subjects’ data presented in this figure. ……… 121 Figure 4.25 Eye gaze heat map when background texture and fixation are modified………. 122 Figure 4.26 Eye gaze heat map of one subject, who have great difficulty to discriminate MID during the experiment. ……… 123
XI
List of tables
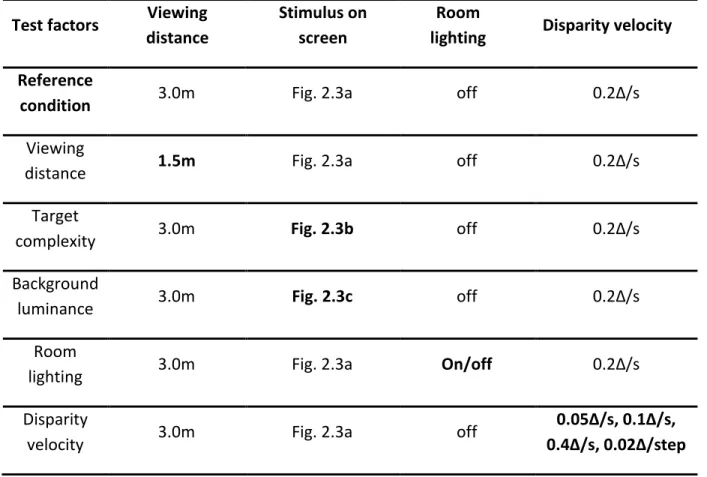
Table 2.1 The main parameters of autostereoscopic TV ………..………..… 47 Table 2.2 Test parameters in experiment 1. Bold in column identifies the paired parameters with reference condition. ………. 51 Table 2.3 Test parameters in experiment 2. Bold identifies the paired parameters. The test factors with* indicate that the test image is depicted on the whole autostereoscopic TV. The test factors without* mean that the depicted image size is modified to maintain the same stimulus size with experiment 1. ……….. 54 Table 2.4 Crosstalk and illuminance measurements at four viewing angles. Crosstalk is calculated by conventional method with adaption to eye perception. ……….…….. 57 Table 2.5 Recommended viewing environment configurations based on the experimental results……… 61 Table 3.1 Lighting conditions a) with room light, b) without room light. ……….……. 70 Table 3.2 Viewing angles at different distances…………..……….. 74 Table 3.3 Comparison of vertical fusion amplitude with induced peripheral disparity………….. 76 Table 4.1 Statistical analysis of MID perception for the effect of background texture effect… 115 Table 4.2 Statistical analysis of MID perception for the effect of background texture effect… 116 Table 4.3 Statistical analysis of MID perception for the effect of background texture effect… 117 Table 4.4 statistical analysis of MID perception for the effect of background texture effect… 118
XII
Abbreviations
AD: absolute disparity
AC/A ratio: accommodative convergence / accommodation ratio
A/V conflict: accommodation and vergence conflict
CA/C ratio: convergence accommodation to convergence ratio
CD: changing disparity
IOVD: intraocular velocity difference
MAE: motion aftereffect
MID: motion-in-depth
PF: Psychometric Function
RD: relative disparity
1
General introduction
3D technology has been an important approach to present to human visual system binocular parallax information for inducing the perception of the third dimensional depth since late 19th century. The depth perception which is generated by binocular disparity is more compelling and robust than depth perception stimulated by monocular cues [1, 2]. A number of 3D technology applications have been widely implemented in scientific visualization and measurement, medical imaging, telepresence, gaming, as well as movies and televisions.
A correct and appropriate perception for stereoscopic information is fundamental requirement of comfort and healthy viewing experience. However, the stereoscopic perception is affected by various aspects, and the classification of the factors is divided into many categories, as is shown in Fig. 1. On the aspect of 3D display technology, the visual perception is not the same with autostereoscopic displays, volumetric displays and holographic displays [3]. If we consider the effect of 3D content, the factors include disparity distribution, binocular mismatches, intraocular crosstalk, depth inconsistencies etc. what’s more, the parameters of human vision will lead to different perception of stereoscopic, such as perceptual and cognitive Inconsistencies, the conflict of convergence and accommodation, intraocular difference in luminance and contrast, visual acuity, stereo acuity, ages etc [4, 5, 6, 7]. Even the method to evaluate visual perception experience could be objective or subjective, the measurement could be visual fatigue or discomfort. When visual fatigue is assessed, it is usually refers to a decrease in performance of the visual system presented by a physiological change. Therefore, visual fatigue could be measured with physiological response, such as changes in accommodation response [8], pupillary diameter, and eye movement characteristics [9], Visual discomfort on the other hand refers to the subjective sensation of discomfort that accompanies the physiological change. Thus, visual comfort can be measured by the means of viewers’ to report the level of perceived visual comfort. Disparity is a fundamental cue for stereoscopic perception creation, it has two types: horizontal disparity and vertical disparity. Horizontal disparity is the main component to stimulate stereo vision, different visual perception could be achieved by modifying horizontal disparity characters. Various attempts have been made to explore the factors that will affect 3D visual perception, which could be grouped into four aspects: 3D display technology, 3D viewing environment, 3D content and binocular visual system characters.
2
Figure 1 Effect factors for 3D visual perception.
Motivations
In the current thesis, we measured the physiological response of observer to certain stimulation to evaluate the visual perception. We chose the aspects that are most related with a perceptual process when 3D technology is applied in practice. First of all, a 3D display platform is required when we need to present some media, different display technology will result in different viewing experience. Second, a certain environment configuration is essential for any occasion, a targeted arrangement of environmental setup will significantly improve visual perception, such as how to decide the size of the screen, where is the best viewing distance, how to control the luminance of the show room, etc. Last but not the least, the introduction of an appropriate 3D content to the observers is fundamental for a successful perception, which is related to the 3D stimulus creation, including the range of depth, the velocity of motion-in-depth, and the criteria of human vision parameters should be also considered because observers’ visual parameters vary widely.
Our work focus on the following three aspects:
3D display platform, nowadays, the two most popular technologies are stereoscopic display and autostereoscopic display, determined by the theoretical differences, the effects that are presented to the observers are different. For stereoscopic display, special glasses are required to deliver different images to left eye and right eye for observers in order to perceive 3D, the
3
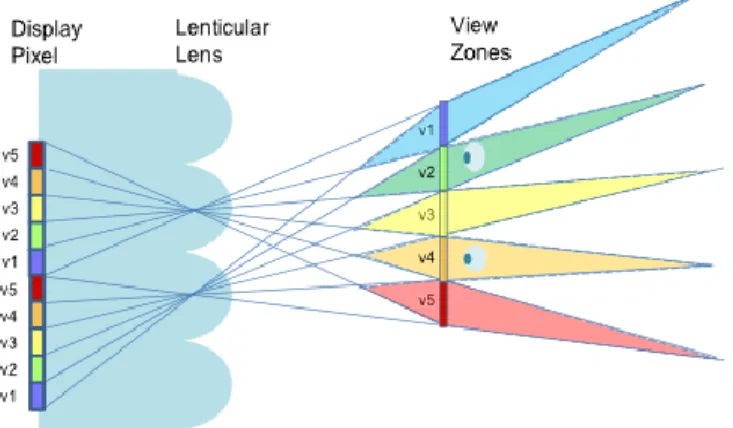
synchronization of screen and glasses allowed a flexible viewing experience, which means observers could watch the screen at different viewing distances and viewing angles. For the autostereoscopic display, it is usually a lenticular lens or parallax barrier that separates the 3D source and thus images with disparity are delivered to different eyes. Due to the limitation of number of views and the structure of light splitting devices, an optimal viewing distance is fixed and the viewing experience will be largely decreased if observer are too close or too far from the screen. What’s more, the crosstalk between neighbored views has always been an issue to be compensated. Given the different characters of the two display technologies, it is necessary to consider visual comfort evaluation separately for stereoscopic display and autostereoscopic display based on their specific critical factors.
Environmental configuration, since all stereoscopic perception is conducted in a certain environment, the parameters in the cinema are quite different with those at home in daily life, such as room lighting, viewing distance, screen size etc., so it is necessary to clarify which environment parameter will affect 3D perception and how to optimize these critical factors to achieve the best visual perception according to specific viewing condition.
Reaction of binocular system for motion-in-depth is also important for stereo vision. Imagine observers sitting in a cinema could not perceive strong 3D motion or some motion appeared in the movie make them headache or dizzy, it will be a failure of the 3D content designer. According to the statistics, only 90% population could perceive depth information, and individual difference is significant among these people. When one object is moving in depth, it is even more difficult for observer to perceive the motion-in-depth, since it need certain amount of response time, the depth and motion-in-depth is proceed in different part of the brain, some people could not pass stereoscopic acuity test could perceive stereo motion! So it remains still miserable about the relationship of static stereo vision and motion-in-depth perception. More research effort should focus on how to create 3D content that is easy to perceive and more comfortable to see.
In the observers’ visual perception under different effect factors is generally evaluated by two parameters: vertical fusion amplitude and accuracy of motion-in-depth response. The goal of the thesis is to propose references which ensure a superior perception for stereoscopic information in real life, which could improve the 3D visual comfort.
4
Organization of the thesis
The following are the origination of the chapters:
The first chapter briefly reviews the history and developments of 3D display technology, binocular system and stereo vision. Some unexplored issues will also be identified in this chapter, i.e. the different effect factors of stereoscopic technology and autostereoscopic technology, the quantitative interaction of central and peripheral retina and the human response of motion-in-depth stimulation. These issues will be further explained in Chapter 2-4 by the mean of physiological experiments. In Chapter 5, the conclusion is made and suggestions for 3D content creation and 3D display configuration are proposed for practice application.
Thesis contribution
Design experiments to explore environment configuration effect on visual tolerance for vertical disparity, the factors include viewing distance, background luminance, room lighting, disparity velocity and central and peripheral fusion interaction during the fusion process.
Identify the critical environment factors that will affect visual tolerance, including viewing distance, background luminance and disparity.
Evaluate the role of central and peripheral retina during the fusion process, confirming the main role of central fusion, and propose a balance point of central and peripheral fusion interaction.
Design experiments and evaluate the visual tolerance of vertical disparity on 3D projector and lenticular autostereoscopic TV. Clarify the critical parameters that affect vertical disparity fusion on the two main 3D display technologies respectively.
Design experiments to explore how to improve visual motion-in-depth direction discrimination ability.
Identify that oculomotor cue can be used to mitigate motion aftereffect which is generated by sensorial cue stimulus.
5
Reference
[1] Patterson, Robert, and Wayne L. Martin. "Human stereopsis." Human factors (1992).
[2] Lambooij, Marc TM, Wijnand A. IJsselsteijn, and Ingrid Heynderickx. "Visual discomfort in stereoscopic displays: a review." Electronic Imaging 2007. International Society for Optics and Photonics, 2007.
[3] Benzie, Philip, et al. "A survey of 3DTV displays: techniques and technologies." Circuits and Systems for Video Technology, IEEE Transactions on 17.11 (2007): 1647-1658.
[4] Kooi, Frank L., and Alexander Toet. "Visual comfort of binocular and 3D displays." Displays 25.2 (2004): 99-108.
[5] Tam, Wa James, et al. "Stereoscopic 3D-TV: visual comfort." Broadcasting, IEEE Transactions on 57.2 (2011): 335-346.
[6] Pölönen, Monika, Toni Järvenpää, and Beatrice Bilcu. "Stereoscopic 3D entertainment and its effect on viewing comfort: Comparison of children and adults." Applied Ergonomics 44.1 (2013): 151-160.
[7] Patterson, Robert. "Review Paper: Human factors of stereo displays: An update." Journal of the Society for Information Display 17.12 (2009): 987-996.
[8] Yano, Sumio, et al. "A study of visual fatigue and visual comfort for 3D HDTV/HDTV images." Displays 23.4 (2002): 191-201.
[9] Ukai, Kazuhiko, and Peter A. Howarth. "Visual fatigue caused by viewing stereoscopic motion images: Background, theories, and observations." Displays 29.2 (2008): 106-116.
[10] Sexton, Ian, and Phil Surman. "Stereoscopic and autostereoscopic display systems." Signal Processing Magazine, IEEE 16.3 (1999): 85-99.
6
Chapter 1
Introduction
7
Table of contents 1. Introduction
1.1. The eye & How we see 1.1.1. The eye
1.1.1.1. Light path through the eye
1.1.1.2. The retina
1.1.2. Beyond the eye 1.2. Binocular vision
1.2.1. Significance of binocular vision 1.2.2. Binocular disparity 1.2.2.1. Horizontal disparity 1.2.2.2. Vertical disparity 1.2.3. Binocular fusion 1.2.3.1. Horopter 1.2.3.2. Panum’s area
1.2.3.3. Sensory fusion and motor fusion
1.2.3.4. Diplopia, binocular rivalry and suppression
1.3. Oculomotor function 1.3.1. Accommodation 1.3.2. Vergence
1.3.3. Models of the oculomotor system 1.4. Sensory function
1.4.1. Depth perception 1.4.2. Comfort zone
1.4.3. Motion-in-depth perception
1.4.4. Accuracy of binocular stereo motion perception 1.4.5. Motion aftereffect
1.4.6. The choice of this thesis for MID exploration 1.5. 3D perception stimulation cues
1.6. 3D display technologies
1.6.1. Stereoscopic technologies 1.6.2. Autostereoscopic technologies
1.6.3. 3D viewing experience evaluation and visual comfort 1.7. Conclusion
8
1.1. The eye & How we see
The eyes are our windows to the world, and the processes of human vision are pretty complex. Although the images projected on the retina are bio-dimensional, a 3D world is perceived, besides, we have a precise discrimination of object’s color, shape, location etc., we can follow a moving target while keeping a sharp focus and detect its motion direction. All these visual functions are accomplished by the cooperation of the eyes, neural system and brain.
1.1.1. The eye
Eyes are a complex optical system. They are made up of various components. They detect the light and convert it into electro-chemical impulses in neurons.
1.1.1.1. Light path through the eye
The human eyes are a complex optical structure which is sensitive to wavelength between 380 and 800 nm. As is shown in Fig. 1.1, the light entering the eye is refracted by the cornea, and then travels through the aqueous and pupil. The amount of light passing through is limited by the pupil aperture, due to constriction or expansion of the iris. The light is further refracted by the crystalline lens before reaching the retina, the crystalline lens is adjustable, it is connected with circular ring of ciliary muscles, and its thickness could be changed to achieve appropriate focal length for different observing distances. The crystalline lens and cornea are the main refractive components which work together to project the image onto the retina.
9
1.1.1.2. The retina
Retina is a light-sensitive layer at the back of the eye, light signal is transduced to electro-chemical impulses and sent to various visual centers of the brain through the fibers of the optic nerve, and real visual processing begins (Fig. 1.1 in the left part).
Retina is a layered structure interconnected by synapses, and light signal is transmitted by neurons called photoreceptor cells. There are mainly two types of photoreceptor cells: rods and cones. Rods work in dim light and support black-and-white vision (called scotopic vision), while cones work for daytime vision (also called photopic vision) and provide color perception. The illuminance in most cases falls between these two levels, and this intermediate illuminance range is called mesopic vision, both rods and cones are active at this illuminance level. Fig. 1.2 demonstrates the relationship of luminance regimes and sensitivity of rods and cones. The cones are spectral sensitive, for normal human vision, there are three subtypes of cones that respond to short, medium and long wavelengths respectively. The lack of one or more cone subtype will cause deficiencies in color vision or even color blindness.
Figure 1.2 Relationship between illuminance regimes and photoreceptor sensitivity. The cones and rods have different distributions on the retina. The fovea, which is about 1.5mm
wide, is located at the very center of the retina. It is responsible for sharp central vision, which
is important for activities such as reading and driving. The largest cone density is in
fovea(140000 cones per mm2), and the visual acuity here is also the best across the retina [1],
due to the lack of rods, fovea is less sensitive to dim light. The density of cones and rods is illustrated in Fig. 1.3. There is a blind spot located about 12°-15° from the fovea (i.e. nasal fovea), it is the place where the optic nerve passes through the optic disc, there are no
10
Figure 1.3 Distribution of cones and rods on the retina (Purves D et al, 2001).
The signal process in retina could be simplified into four steps: activation of the photoreceptors, transmission to bipolar cells, passing through retinal ganglion cells, the most useful information grouping into visual cortex through the optic nerve such as the color, shape, luminance etc.[2].
1.1.2. Beyond the eye
The electrical signals follow a path that crosses at the optic chiasma after they exit the retina through the optic nerve, they later reach the visual area of thalamus and then enter the primary visual cortex, as is shown in Fig. 1.4.
The lateral geniculate nucleus (LGN) is an important synaptic relay located in the dorsal part of the thalamus, it is the major target for each optic tract because 80% axons of the retina’s ganglion cells terminated in LGN. There are six layers in LGN for each side, the right LGN processes all the visual signals from the left visual field (vice versa for the left LGN). It receives axons from the left nasal retina (cell layers 1, 4, 6) and the right temporal retina (cell layers 2, 3, 5).
11
Figure 1.4 Visual pathways from the eyes to the primary visual cortex (Derrington, A., 2002). The3D perception of an object is achieved by the cooperation of different visual cortical areas. There are several models to describe the neural processing of vision, one widely accepted model is described in the paper of David Milner and Melvyn A. Goodale in 1992 [3, 4]. There are two major cortical systems for processing visual information: a ventral pathway and a dorsal visual pathway. The function of ventral visual pathway (known as “what” pathway) lets us consciously perceive, recognize and identify objects by perceiving the original visual properties such as shape and color. The function of dorsal visual pathway (known as “where” pathway) stimulates visual-motor system to allow us to know the spatial information of the object, such as the size or the position and orientation in space. The routes of the two parallel processing pathways are demonstrated in Fig. 1.5.
12
Generally, there are five visual cortical areas, although the functions of each area have been explored since long time ago, some aspects are still in debates. The V1 area is the largest of the visual areas and very important for vision, it has several layers which have different functions, some layers receive or send back information to lateral geniculate nucleus, and some layers send information to higher visual areas. The cells in V1 are selective for orientation, complexity and trigger features, so the basic recolonization of an object is achieved in V1. However, to perceive more specific characters of the retinal image, a cooperation of different cortex areas is needed. Generally, V1, V2 are involved in basic visual features, such as color, size etc.; V3 and (medium-temporal) MT/V5 deal with motion detection, spatial localization, shape perception, hand and eye motions; V4 turns to process intermediate complex information [5-7].
1.2.
Binocular vision
The binocular vision is the coordination of both eyes to achieve a simultaneous vision state, a single image is perceived by the binocular fusion of two slightly dissimilar images depicted in each eye.
1.2.1. Significance of binocular vision
The binocular vision allows a full perception of various angles of an object in the viewing field. Normal binocular vision could help to determine the target direction, speed and position in space. The binocular motor sensory system coordinates the movement of the eyes with the viewing distance or angles of the target, when the target is moving or stable, besides, the binocular system could also achieve an effective coordination of the accommodative system to keep a single, clear and comfortable perception. Binocular vision is superior to monocular vision, for instance, in the tasks of letter identification, color discrimination, needle threading etc. Besides, the visual field is enlarged by the overlap of view angle of left and right eye [8, 9]. The perception of stereopsis is the main point of binocular vision, it will be described in later sections.
1.2.2. Binocular disparity
Due to the horizontal separation of the two eyes, slightly different images of an object are seen by the left and right eye, which refers to binocular disparity. Although the images projected on the retina are two-dimension, the brain could use binocular disparity and the retinal images to perceive stereopsis. Due to the orientations of the disparity, there are two kinds of disparity: horizontal and vertical disparities.
13
1.2.2.1. Horizontal disparity
Definition
The horizontal disparity (P) of a given point in objects space(x) is defined as a function of the lateral separation of the eyes divided by object distance, Fig. 1.6a, and it is quantified in angular units:
𝑃 = 2 × arctan(
𝑎𝑑) × 𝑘
(1)Where a = half of the inter pupil distance (IPD) (65mm), d = the distance between the object and the nodal points of the eyes, k is a conversion factor that varies depending on the angular unites of P (e.g., degree, prism diopters) [10].
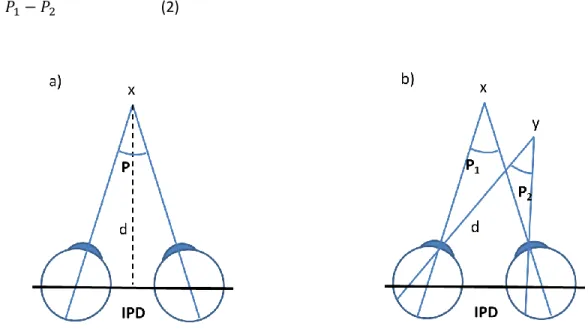
Stereopsis could only be perceived when there are two or more points in object space, this refers to relative disparity. The definition of relative disparity is the depth interval between two objects points with the measurement in angular units, as is shown in Fig. 1.6b. Horizontal relative disparity (D) is calculated as the difference of parallax angles (P1 and P2) subtended by two points (x and y) in object space:
𝐷 = 𝑃1− 𝑃2 (2)
Figure 1.6. The geometry of horizontal disparity. a) The definition of binocular disparity of object x; b) The definition of relative disparity of x and y.
Absolute disparity VS relative disparity
There are two types of signal for the stereo disparity systems in the brain: absolute and relative disparities. When both eyes are focusing at a particular location in space (X, as is shown in Fig. 1.7, is called the fixation point): the image of X falls on the fovea of each eye. Y is another
14
object in the space, and the image of Y is projected at different positions on the left and right retina with respect to the fovea. If we switch the gaze from X to Y, the eyes have to rotate by
different angles (A1 and A2). The difference of angles is called the absolute disparity of Y.
Relative disparity is another way to present the space relationship between objects. Regardless
of where the eyes are pointing, the relative disparity is calculated by P1-P2.
The absolute disparity is an estimation of object and surface in reference to where the eyes are fixating; the relative disparity is the location relationship between two different objects, it is independent of the fixation point. The absolute disparity connects the accommodation-convergence reflex and the 3D stereo perception [11].
Figure 1.7 Diagram showing relative and absolute disparities of 2 points in different depth planes. Relative disparity of X and Y is the angle difference of the two points in space
corresponding to the two eyes, thus P1 – P2. The absolute disparity is the angle difference for on
point between two eyes, with the fixation point as a reference, since the fixation in this figure is
X, the absolute disparity of Y is the angle difference of A1 and A2, A1 and A2 are the angle of X
and Y corresponding to certain eyes.
1.2.2.2. Vertical disparity
Vertical disparity can be defined as the difference of a vertical angle subtended at the right and
left eyes by a given object [12].
Since the normal human eyes are supposed to locate at the head without vertical displacement, the visual tolerance for vertical disparity is consequently much weaker than it is for horizontal disparity [13]. As is shown in Fig. 1.8a, a slight vertical disparity could be
15
fused by the visual system, but large vertical disparity will cause diplopia or rivalry. Vertical
disparity effect could also come from pathologies of patients suffering from verticality dysfunctions including alphabetical and V syndrome, strabismus in tropia. These effects cause an ocular compensation (ocular tropia or head movements to compensate), brain compensates or suppress to a given drop-out level.
The measurement of vertical disparity is illustrated in Fig. 1.8b, it is related with the viewing distance, the vertical displacement of the images. The unit is prism-diopter ∆, 1 prism diopter is defined as the deviation of light by 1 cm, observed at 1 m viewing distance.
Figure 1.8 a) Demonstration of vertical disparity generation using 3D stereo system. b) Geometry of vertical disparity calculation.
1.2.3. Binocular fusion
Binocular fusion is the unification of two ocular images with disparity. It could be achieved by two different processes: sensory fusion and motor fusion. When the disparity is too large, the fusion process will be stopped, observers will perceive diplopia or one image of the stereo pairs is ignored by the brain [9].
1.2.3.1. Horopter
Horopter is defined as the locus of all object points in space that are imaged on corresponding
two retinal elements at a given fixation distance. A single vision could be achieved with the objects locating along the line which makes the same angles at the two eyes with the fixation lines [14]. There are two descriptions for horopter, Fig. 1.9:
16
Geometric Vieth Muller Horopter: According to this model of horopter if corresponding
points have a regular horizontal distance from the retina the horopter would be a circle passing through the center of rotation of the two eyes and the fixation point. Thus the circle becomes smaller as the point of fixation gets nearer.
Empirical Horopter Curve: The empirical horopter curve is defined by singleness of vision, it
has larger area than the theoretical horopter. It is believed that any point in one retina might yield single vision with a circular region centered on the corresponding point in the other retina. The size of this curve is relative with the Panum’s fusional area.
Figure 1.9 Schematic representation of Horopter. With the eyes converged in point D, the theoretical/geometrical horopter is the circle, while the empirical horopter is the arc E.
1.2.3.2. Panum’s area
The range of horizontal disparities around the horopter within which the stimulus continue to be perceived as single is known as Panum’s space, this region in space corresponds to areas on the retina, called Panum’s area (no diplopia area), Fig. 1.10. Panum’s space is narrowed at the fixation point and expands in periphery, due to larger receptive fields and poorer visual acuity in the periphery. Because Panum's areas are large in the periphery, larger amounts of disparity are accepted before experiencing diplopia.
Panum’s area is narrowest at the fixation point and becomes broader in the periphery at a rate of 1-2 arc min per degree of visual field eccentricity. Because Panum's area has greater area in the periphery, larger amounts of disparity are accepted before experiencing diplopia. The
17
increase in the Panum’s area towards the periphery may be related to anatomic and physiologic differences known to exist between the monosynaptic foveal cone system and the rod and cone system of the periphery. The Panum’s area is smallest near the fovea, about 6-10 arc minutes on both sides of the horopter. Stereopsis begins about 2-10 arc seconds on both horopter sides, near the center of Panum’s space. Panum’s space expands peripherally to about 30-40 arc minutes at 12° from the fovea. In somecases, objects with up to 2-3° of disparity can be fused [15]. Panum’s area expands or contracts with the test conditions and methods, such as the stimuli size, sharpness, speed, luminance etc [16].
Figure 1.10 Schematic representations of Panum’s area and Panum’s space.
1.2.3.3. Sensory fusion and motor fusion
Sensory fusion and motor fusion are both central processes that take place in the visual cortex. Sensory fusion is the visual ability to interpret two similar images projected on the two eyes into a single visual image, the two retina images may not locate on the corresponding area, but the size, the brightness and sharpness need to reach enough threshold to allow the sensory fusion function, otherwise the fusion could be blocked. Motor fusion is the eye vergence to align the retina images to the corresponding area in order to facilitate sensory fusion. The fusional eye movements start when the disparity stimulus is outside the panum’s area.
1.2.3.4. Diplopia, binocular rivalry and suppression
Diplopia, known as double vision, is usually perceived when an object point appears double when it is seen in two directions simultaneously. Diplopia could come from visual dysfunctions such as strabismus or manually stimulus which induces large horizontal disparity
18
or distinct retina images. Diplopia could be an ophthalmologic parameter for eye defects, it is also a threshold for visual fusion process on healthy eyes.
Binocular rivalry occurs when dissimilar contours are presented to corresponding retinal areas, an alternation between the different retinal images will start during the visual perception process. Binocular rivalry could be caused by the difference of paired images, such as colors, contours and brightness.
Suppression is a neuro-physiological active inhibitory mechanism to avoid diplopia when dissimilar stimuli are depicted on corresponding retinal areas or when non-corresponding retinal areas are stimulated by similar stimuli, one or the other is temporarily inhibited or suppressed to prevent confusion or diplopia respectively.
1.3. Oculomotor function
The maintenance of a clear and stable perception of the world needs coordination of various elements. Accommodation (change in ocular focus) and vergence (change in ocular alignment) are two ocular motor functions interacting with each other to provide clear single binocular vision. While retinal blur mainly drives the accommodation, retinal disparity changes accommodative position through the convergence-accommodation (simply vergence accommodation, VA) crosslink. Similarly, while retinal disparity primarily drives the vergence system, a change in retinal blur alters vergence through the accommodative-convergence (AC) crosslink.
1.3.1. Accommodation
Accommodation is a visual function that ensures a sharp retina image when the eyes are
focused on an object. When the eyes fixation switches from one object to another, the retina image may be blurred, and this defocus stimulates retinal cones to transmit the summed blur signals to the visual cortex through magnocellular layer of LGN. The cortical cells will respond to this sensory blurred signals and formulate motor command and transmit it to ciliary muscles via oculomotor nerves, ciliary ganglion and then to short ciliary nerves. The ciliary muscles will change the states of contraction according to the command to reform the crystalline lens to attain in-focus retinal image and clarity of vision. It should be noted that the ciliary muscle reaction is only one of the most important steps to achieve successful perception, there are other reactions such as pupil size change, corneal curvature changes or changes in the axial length of the eyeball itself to compensate the fixation distance change[10]. The accommodation state is driven by synkinetic control from vergence system.
19
The accommodative stimulus-response function is an important demonstration of the accommodative system, as is shown in Fig. 1.11, it provides an accurate and quantitative description of the accommodative response to accommodative stimuli. The accommodative response is generally smaller than the accommodative stimulus by an amount equal to the depth of focus. This lag or error is called the lazy lag of accommodation. The curve could be divided into one linear region and several nonlinear regions. The linear region is in the middle part of the profile, where the change of accommodative leads to a relative large and proportional change in the response, the accommodative error is also proportional in this region. For the nonlinear region, the initial non-linear portion, accommodation changes is less than the stimulus. During the non-linear transitional region, there is a soft saturation where the function slope decreases with increased stimuli amplitude.
The following zone is hard saturation region where the response has reached its full amplitude. When the stimulus exceeds the amplitude limit, the accommodation response declines below its peak. Accommodation could be affected by a multitude of factors, such as contrast, spatial frequency, retinal eccentricity retinal image velocity etc.[17, 18].
Figure 1.11 Function of accommodative stimuli and accommodation response (Clifton M., Schor,
O.D., 1997).
1.3.2. Vergence
Two eyes movement in opposite directions is called eye vergence. Although the primary stimulus for vergence is retinal disparity, vergence is also elicited in response to proximal cues, changes in tonic innervation and through the synkinetic link from accommodation. The synkinectic link is an interaction link between accommodation and vergence. A vergence eye movement towards the midline (convergence) occurs in response to crossed retinal disparity whereas movement of the two eyes away from the midline (divergence) occurs for uncrossed
20
disparities. The vergence system proposed by Maddox is composed of four components: accommodative (driven by retinal blur as a synkinetic response from accommodation system), fusional (also known as disparity vergence), tonic (resting state of the eye) and proximal (awareness of a near object). Clinicians use the accommodative convergence in prims diopter (∆) per diopter (D) of accommodation (∆/D, or ACA) ratio from Maddox’s theory. On the other hand, Fincham and Walton emphasized that accommodation may be driven as the convergence movements of the eyes with vergence as the fundamental component, and the clinical expression is convergence accommodation per convergence (D/∆, or CA/C) ratio.
1.3.3. Models of the oculomotor system
Although an oculomotor system is composed by various components, a stable and correct perception relies on cross-coupling among the components. Examples of such cross-linkages include the cross-talk between saccade-vergence, horizontal-vertical vergence and accommo-dation-vergence. The coupling between accommodation and vergence is the most well-known. Under normal binocular viewing conditions, accommodation and vergence interact with each other through reciprocal cross-link interactions where optically stimulated accommodation evokes convergence and disparity stimulated vergence evokes accommodation. Magnitudes of these interactions are represented by AC/A (ratio of accommodative convergence to accommodation) and CA/C (ratio of convergence induced accommodation to convergence)[19]. The respective activities of the various components of the oculomotor system and amplitude of the responses can be modeled. The models are divided into two types: static models [20, 21], and dynamic models [22, 23]. Static models help to understand the basic oculomotor mechanisms and their implications into clinical measurements, providing information about the stable state of the oculomotor response as a consequence of fixation point transfer (not a stimulation point). Dynamic models can explain the dynamic properties of oculomotor responses. The two types of models are generally developed to simulate a specific visual phenomenon as adaptation of the oculomotor system in near vision or the contribution of proximity to the oculomotor response.
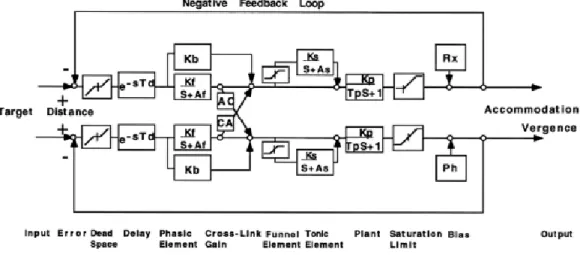
A model demonstrating phasic-tone control and interaction between accommodation and vergence has been proposed by Schor in 1996, as is shown in Fig. 1.12, the model is composed
by input, linear and nonlinear components, cross-coupling and cross-coupling which is enhanced by adaptation. The inputs stimuli are target distances, it passes a fast phasic component at the front of the feed-forward paths which respond to external stimuli such as perceived distance, blur and disparity. Then the signal passes a following adaptable tonic component that responds to intrinsic innervation. The phasic and tonic responses are summed linearly. The output is limited by negative feedback loop, it means when tonic adaptation
21
increases, the phasic response will decrease. The cross-link responses of AC/A and CA/C is included in the model to illustrate the interaction of accommodation and convergence [23].
Figure 1.12 Block diagram of the phasic-tone control and interaction between A and V.
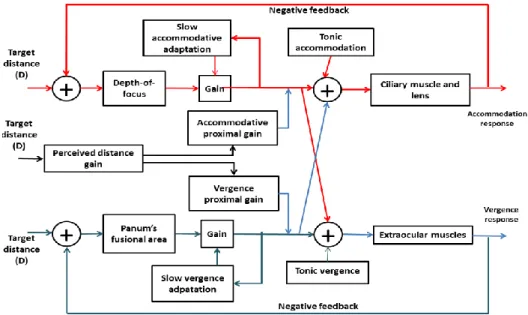
A static model of accommodation and vergence is demonstrated in Fig. 1.13, there are three
branches at the left input, an accommodative branch, proximal branch and a branch associated with the convergence. The input signal of the model for each branch is the distance to target. Note that the input of accommodation and disparity vergence sum with the negative feedback response of the respective system while the proximal branch does not have a visual feedback pathway of its own, because there is no retinal information input. The operator where signal passes through the depth of focus for accommodative component and Panum’s area for vergence component is called dead-space, this component allows a tolerance of some small neuro sensory-based system error, such as blur and diplopia. The operator gain represents the experimentally derived system open loop gain, it is the fast subsystem, and an immediately clear and / or fused retinal image is obtained in 1s when a blur or disparity is inputted. The slow subsystem lasts for a prolonged period, it can minimize visual system fatigue and prevent myopia development and its progression [24]. The tonic inputs have little influence on the overall closed-loop for near response and only modest influence on the far response. The summing junctions combine the gain output from crosslink output, proximal output and tonic output. The ciliary muscle and lens and extraocular muscles will be stimulated when the neural output signal comes out of the summing junction which leads to the innervation of oculomotor muscles. Motor changes are then returned to the original junction. If the residual error system is too large, the cycle is repeated until this error becomes acceptable (depth of field / Panum’s area) and stable for both systems [25]. The crosslink gain represent the AC/A ratio for
22
accommodation while effective CA/C ratio for convergence. Abnormally high ratio from accommodation or convergence will lead to an overdriven and result in esotropica or exotropia.
Figure 1.13 Static interactive dual-feedback model of the accommodative and vergence
system(Benjamin, 2006).
1.4. Sensory function
The abilities to discriminate the object’s shape, color, position, speed, directions result from the cooperation of visual sensory functions.
1.4.1. Depth perception
Neural basis: the ability of the human eye to see in three dimensions and estimate the
distance of an object is called depth perception, it is mainly stimulated by the image disparity between eyes. When the disparity is within Panum’s fusional area, it will be fused by the brain and a single vision with depth information is perceived. Similar to the color perception, the images are encoded by photoreceptors dedicated to given feature extraction, and then interpreted in the cortex. The monocular retino-geniculate projections from right eye and left eye remained separated until reaching the input layer of ocular dominance columns (ODCs) in V1, layer 4C. The binocular vision starts by the horizontal connections between ODCs of opposite jocularity in upper layers 4B (Fig. 1.14a) [26]. A successful binocular data process requires connections between input of right eye and left eye, which occurs in layers 2-4B in V1 (Fig. 1.14b), decorrelation of connections between the eyes inputs will cause loss of horizontal connections which lead to stereo blindness, exotropia and gaze asymmetries (Fig. 1.14c)[27]. There are neuro cells in V1 that fair for different disparity features, such as the disparity
23
magnitude, correlation of stimulus in both eyes and the cross disparity or uncross disparity etc. [28].
Figure 1.14 Neuroanatomic functions for binocular vision in striate cortex (V1). a). The binocular vision is achieved by the horizontal connections between ODCs of opposite ocularity. b). The horizontal connections for binocular vision to layer 2-4B of V1 in normal primates. c). The horizontal connections for binocular vision to layer 2-4B of V1 in strabismus primates (Tychsen et al., 2010).
Crossed and uncrossed disparity: non-zero disparities giving rise to stereoscopic depth are
divided into crossed and uncrossed. As illustrated in Fig. 1.15, it presents the relative position of the observed objects and fixation point in depth. Crossed disparities are created by objects in front of the horopter (near objects). The disparity is termed "crossed" because the monocular image of the object when viewed by the right eye is displaced to the left, whereas that viewed by the left eye is displaced to the right. Uncrossed disparities are created by objects located behind the horopter (far objects). In this case the monocular image of the objects viewed by the right eye is displaced to the right and that viewed by the left eye is displaced to the left.
24
Figure 1.15 Demonstration of crossed and uncrossed disparity.
Stereoscopic acuity: Stereoscopic acuity is the smallest binocular disparity that can be
discriminated. It is an important parameter for eye examination. There are several generally used clinical stereoscopic acuity tests, such as stereo fly test, the frisby stereo test, keystone multi stereo test etc. The disparity threshold of coarse stereopsis is normally much higher than that of fine stereopsis. The standard stereo acuity threshold varies with examine methods, for stereo fly test, the normal observers should have better than 60 of arch stereoscopic acuity.
1.4.2. Comfort zone
In order to see a sharp and clear object, the eyes need to accommodate as close as the object’s focal distance. The acceptable focus distance range is around ± 0.3 diopters. Besides, the eyes must converge to make the binocular disparity less than the range of Panum's fusion area. Accommodation and vergence responses are normally coupled: accommodative changes evoke vergence changes (accommodative vergence), and vergence changes evoke accommodative changes (vergence accommodation). In a natural viewing condition, binocular disparity and
focus distance cues provide consistent signals for object distance, so the accommodation-vergence coordinates well because the accommodation distance and accommodation-vergence distance are almost always the same no matter where the observer looks at (diagonal line in Fig. 1.16). The
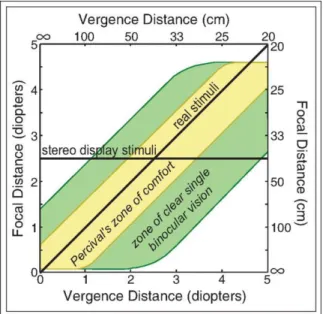
clear single binocular vision zone (green region in Fig. 1.16) is the range of vergence and focal distances in which the observer maintain a sharply focused single image. Percival comfort zone (yellow region in Fig. 1.16) is an approximate range of vergence and accommodation distance where the viewer can fuse stereo pairs without discomfort. To achieve a clear single vision without discomfort, vergence and accommodation distances should be as close as possible[29].
Figure 1.16 The demonstration of clear single binocular vision zone(green and yellow region), Percival's zone of comfort (yellow region), the vergence and accommodation coordination in real world (diagonal line) and the vergence and accommodation coordination on conventional
25
stereo displays(horizontal line)( Banks, Martin S., et al. 2008).
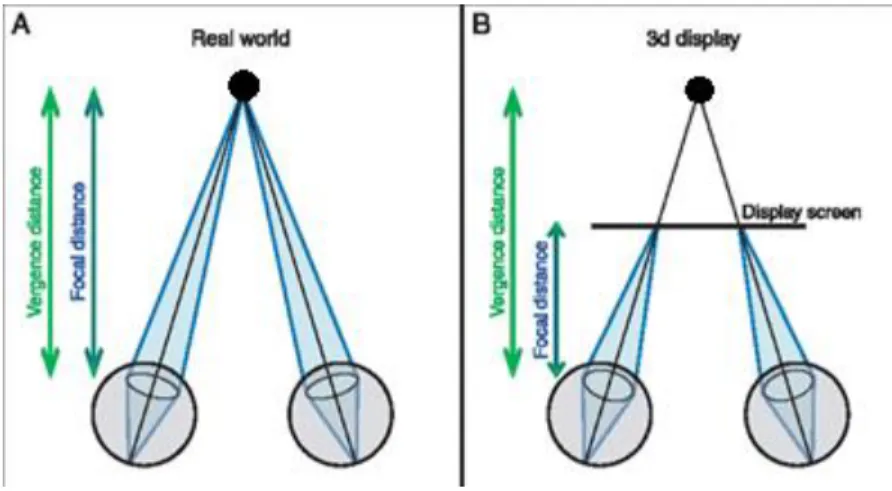
When stereoscopy is implemented in conventional 3D display, there is a mismatch between convergence and accommodation. On a stereoscopic display, the focus distance and vergence distance are inconsistent, because stereo images with disparities are displayed on a flat screen, the vergence distance changes with disparity, which maybe closer or farther than the screen, but the focus distance is always the distance to the screen (Fig. 1.17, Fig. 1.16 horizontal line). As described in 1.3.3, a clear and single view perception is due to the accommodation and vergence couple. The eyes simultaneously accommodate and converge to the stereo images on the 3D screen, the crosslink components between vergence and accommodation systems are stimulated, but the inconsistensity of vergence and focus distance will influence the synkinesis link. The accommodation-vergence conflict is recognized as the predominant factor entailing
visual fatigue and discomfort on conventional stereoscopic display. Long time viewing for such
3D content will lead to eyestrain, blurred vision, headache or dizziness symptoms.
Figure 1.17 a). Vergenceaccommodation under natural viewing condition, b) Vergence -accommodation on stereoscopic display (Banks, Martin S., et al., 2008).
1.4.3. Motion-in-depth perception
The ability to estimate the object motion in 3D space is essential for everyday activities. When an object moves in depth, the binocular disparity between it and a stationary object will change, as is shown in Fig. 1.18, when object is approaching or receding from the fixation point, the projected images will move in the opposite direction on the corresponding eye’s retina, the binocular disparity and intraocular velocity change at the same time[30].
26
Figure 1.18 Schematic illustrations of motion in depth and the associated image motion. A) The object moves toward the middle of the eyes produces opposite directions of image motion in the two eyes. The horizontal binocular disparity changes over time as the object moves in depth.
B) Receding movement of an object reverses the direction of image motion in each eye and
reverses the temporal sequence of changes in binocular disparity (Sanada, T. M et al. 2014).
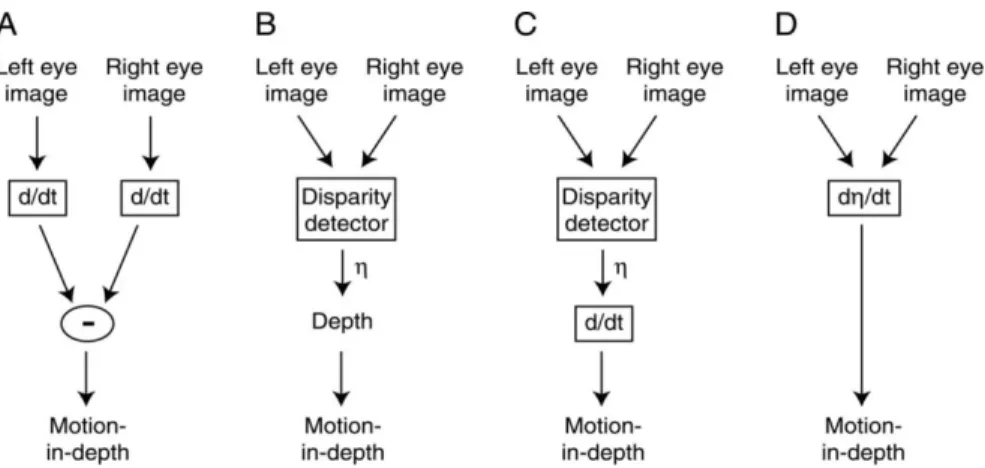
Mechanisms to achieve motion-in-depth perception
The binocular vision is known to be used to perceive motion-in-depth (MID) [28], but what specific binocular cues are used to see motion-in-depth have not been completely investigated. In current opinion, two cues have been addressed for the detection of MID: changing disparity
(CD) and intraocular velocity difference (IOVD).
The models of the two cues to process MID is demonstrated in Fig. 1.19, model A demonstrated IOVD cue: To use this signal, two separate and independent monocular velocity signals must first be derived, and subsequently combined vectorially across the two eyes; model B-D illustrated the CD cue: Positional information must first be combined from both monocular images to establish a disparity signal, which can then be differentiated over time to yield the speed of the object in depth [31, 32].