HAL Id: inria-00115880
https://hal.inria.fr/inria-00115880v4
Submitted on 4 Dec 2006
HAL is a multi-disciplinary open access
archive for the deposit and dissemination of
sci-entific research documents, whether they are
pub-lished or not. The documents may come from
teaching and research institutions in France or
abroad, or from public or private research centers.
L’archive ouverte pluridisciplinaire HAL, est
destinée au dépôt et à la diffusion de documents
scientifiques de niveau recherche, publiés ou non,
émanant des établissements d’enseignement et de
recherche français ou étrangers, des laboratoires
publics ou privés.
Simbatch: an API for simulating and predicting the
performance of parallel resources and batch systems
Jean-Sébastien Gay, Yves Caniou
To cite this version:
Jean-Sébastien Gay, Yves Caniou. Simbatch: an API for simulating and predicting the performance
of parallel resources and batch systems. [Research Report] RR-6040, INRIA. 2006, pp.15.
�inria-00115880v4�
a p p o r t
d e r e c h e r c h e
IS S N 0 2 4 9 -6 3 9 9 IS R N IN R IA /R R --6 0 4 0 --F R + E N G Thème NUMINSTITUT NATIONAL DE RECHERCHE EN INFORMATIQUE ET EN AUTOMATIQUE
Simbatch: an API for simulating and predicting the
performance of parallel resources and batch systems
Jean-Sébastien Gay,
Yves Caniou
N° 6040
Unité de recherche INRIA Rhône-Alpes
655, avenue de l’Europe, 38334 Montbonnot Saint Ismier (France)
Téléphone : +33 4 76 61 52 00 — Télécopie +33 4 76 61 52 52
Simbatch: an API for simulating and predicting the
performance of parallel resources and batch systems
Jean-S´
ebastien Gay,
Yves Caniou
Th`eme NUM — Syst`emes num´eriques Projet GRAAL
Rapport de recherche n°6040 — October 2006 —15pages
Abstract: The study of scheduling algorithms for parallel tasks in a grid computing context either neglects local reservation systems which manage parallel resources, either suppose that they use a First Come First Served strategy, or the experimental model does not handle parallel tasks. In this report, we describe an API built in the grid simulation tool Simgrid. It offers core functionalities to simulate in a realistic way parallel resources and batch reservation systems. Simbatch simulation experiments show an error rate inferior to 1% compared to real life experiments conducted with the OAR batch manager.
Key-words: Scheduling, Grid simulation, Batch systems, Performance prediction
This text is also available as a research report of the Laboratoire de l’Informatique du Parall´elisme http://www.ens-lyon.fr/LIP.
Simbatch: Une API pour la simulation et la pr´
ediction de
performances des syst`
emes de r´
eservation batch
R´esum´e : Les ´etudes d’algorithmes d’ordonnancement de tˆaches parall`eles dans le contexte des grilles de calcul ignorent souvent les syst`emes de r´eservation locaux qui g`erent les ressources parall`eles, ou supposent qu’ils instancient First Come First Served ou encore n’instancient pas le mod`ele des tˆaches parall`eles dans leurs travaux d’exp´erimentation. Nous d´ecrivons donc dans cet article une API int´egr´ee au simulateur de grille Simgrid. Elle offre les structures et fonctionnalit´es pour simuler de fa¸con tr`es r´ealiste les ressources parall`eles et les syst`emes de r´eservation batch pour les g´erer. Les r´esultats exp´erimentaux montrent des erreurs de simulation inf´erieures `a 1% par rapport aux r´esultats r´eels obtenus avec le syst`eme de r´eservation OAR sur un cluster. Mots-cl´es : Ordonnancement, Simulation de grilles, Syst`eme de r´eservation batch, Pr´ediction de performances
Simbatch: simulating and predicting performances of batch systems 3
Contents
1 Introduction 4
2 Grid simulator 4
3 An API to simulate batch schedulers 5
3.1 Introducing Simbatch . . . 5
3.2 Modeling . . . 6
3.3 Using several batch schedulers with Simbatch . . . 7
4 Experiments 7 4.1 Tasks generation . . . 7
4.2 Real experiments platform. . . 8
4.3 Protocol of experimentation . . . 8
5 Results and discussion 8 5.1 Validation of the scheduling algorithms. . . 8
5.2 Simbatch simulation precision . . . 8
5.2.1 Experiments involving computing tasks . . . 9
5.2.2 Experiments involving communicating tasks . . . 9
6 Conclusions and future works 11 6.1 Experiment without communication . . . 14
6.2 Experiment with communication . . . 15
4 Jean-S´ebastien Gay, Yves Caniou
1
Introduction
The accessability to the aggregated power of a federation of computing resources requires mecha-nisms to monitor, handle and submit jobs, etc. This can be done with the help of grid middleware such as Diet[4] or NetSolve[6]. They aim at offering to grid end-users the capacity to efficiently solve computation problems, while hiding the complexity of the platform.
Actually, grids are built on a clusters hierarchy model, as used by the two projects EGEE1
and Grid’5000[3]. The production platform for the EGEE project (Enabling Grids for E-science in Europe) aggregates more than one hundred sites spread over 31 countries. Grid’5000 is the French Grid for the research, which aims to own 5000 nodes spread over France (9 sites are actually participating).
Generally, the use of a parallel computing resource is done via a batch reservation system: users wishing to submit parallel tasks to the resource have to write scripts which notably describes the number of required nodes and the walltime of the reservation. Once submitted, the script is processed by the batch scheduling algorithm: the user is answered the starting time of its job, and the batch system records the dedicated nodes (the mapping) allocated to the job.
In the Grid context, there is consequently a two-level scheduling: one at the batch level and the other one at the grid middleware level. In order to efficiently exploit the resource (according to some metrics), the grid middleware should map the computing tasks according to the local scheduler policy. Neither the conception of such algorithms nor their validation are obvious. The execution of large scale experiments, when they are feasible, monopolizes the resources and cannot be reproduced. So it seems to be necessary to define common bases in order to simulate them and draw their profiles before trying to realize them in real life. Thus, we propose and describe here an easy and reusable module as a built-in for the grid simulator Simgrid[5] to realize those studies.
Contributions of this work are mainly focused on the conception of an API which extends the functionalities of Simgrid, allowing to easily simulate parallel resources and batch system in grid computing.
Thereby, the studies of scheduling algorithms for grid middleware, or even for new schedul-ing algorithm at batch level, are greatly fined down. Furthermore, realistic models of PBS2
(or Torque3
) and OAR4
are built-in. The quality of the results obtained during the validation of this work allows us to envisage using it as a performance prediction tool which could be embedded in the grid middleware to schedule its computing tasks, as described in [7].
The remainder of this report is organized as follow: we firstly introduce the working context in section 2 then we describe our models in section3. Real experiments are explained in section4
and, analysis and critics are formulated in section5. We then conclude in section6by introducing our future goals.
2
Grid simulator
There are numerous grid simulators, amongst them we can cite Bricks[12], for the simulation of client-server architectures; OptorSim[1], created for the study of scheduling algorithms dedicated to the migration and replication of data; and Simgrid[9]. The latter is by definition a toolkit that provides core functionalities for the simulation of distributed applications in heterogeneous distributed environments.
The most related work are [8] and [11]. In order to realize their studies, the authors model local schedulers. However, their systems are not generics: they do not provide any API of reusable functions; moreover in an attempt to keep their study simple the scheduling policy used is always
1 http://public.eu-egee.org/ 2 http://www.openpbs.org/ 3 http://old.clusterresources.com/products/torque/ 4 http://oar.imag.fr INRIA
Simbatch: simulating and predicting performances of batch systems 5
First Come First Served ; at last, they only use sequential tasks, e.g., they do not model parallel tasks.
Then, studies led on scheduling in grid computing are not necessarily precise, or correct, due to the simulation of the local scheduling policy in the parallel systems.
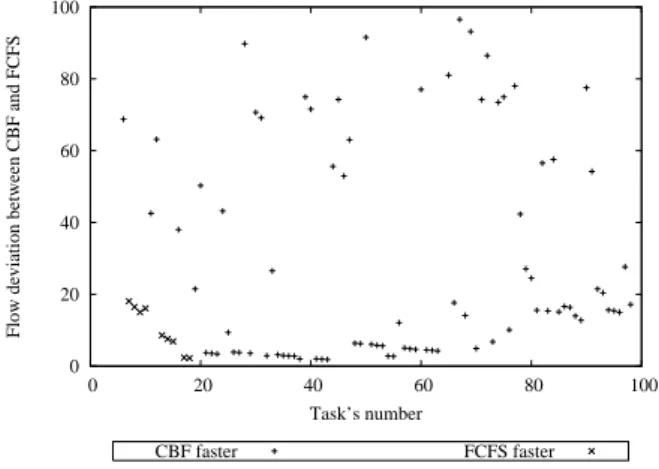
Indeed, we have conducted 1000 simulation experiments in order to compare the impact of batch scheduling heuristics on the flow of a task (the difference of the time spent in the system, resulting from the addition of the waiting time passed in the queue, of the run time and of the communication costs). This metric is useful in our context, because it is seen from the user side (a client or a grid middleware). Each experiment is composed of 100 tasks submitted to a parallel resource composed of 7 cpus, controlled successively by FCFS (used in PBS5
) then by Conservative BackFilling, used in OAR. We have observed that the minimum of the differences average is around 13%, the maximum around 39%, for a global average of 28% with a standard deviation less than 4%.
Figure 1 shows the flow difference on the flow observed during one of the 1000 experiments scheduled with FCFS then with CBF. We can observe that the backfilling of CBF leads to a completly different resulting flow for each task. Morevover, the two runs end respectively after 83297 seconds for FCFS compared to 74270 for CBF, which is 12% sooner.
In order to improve the realistic results and ease the conception and analysis of grid scheduling heuristics, we offer Simbatch6
, an API to easily simulate such systems. We have chosen to integrate it within Simgrid because the project is very responsive and active, and its popularity is increasing in our community. 0 20 40 60 80 100 0 20 40 60 80 100
Flow deviation between CBF and FCFS
Task’s number
CBF faster FCFS faster
Figure 1: Flow difference observed on 100 tasks scheduled with FCFS then with CBF
3
An API to simulate batch schedulers
3.1
Introducing Simbatch
Simbatch is a C API consisting of 2000 lines of code. It aims at simplifying the conception and evaluation of scheduling algorithms at a grid or a cluster scale. It uses data types and functionalities provided by the Simgrid library to model clusters and batch systems.
Simbatch provides a library containing already three scheduling algorithms[10]: Round Robin (RR), First Come First Served (FCFS) and Conservative Backfilling (CBF). The API is designed to easily let the user integrate its own algorithms. In order to visualize the algorithm behavior, a
5
http://www.openpbs.org
6
http://simgrid.gforge.inria.fr/doc/contrib.html
6 Jean-S´ebastien Gay, Yves Caniou 1
3
4
MSG_process node submission RR FCFS CBF topology NetworkMSG_process batch runs on host frontal
Acknowledgement 2 MSG_Process submissionPlateform MSG_Process entryPoint Gantt chart computation Modeling cluster Tasks Scheduler Ending Clients External load
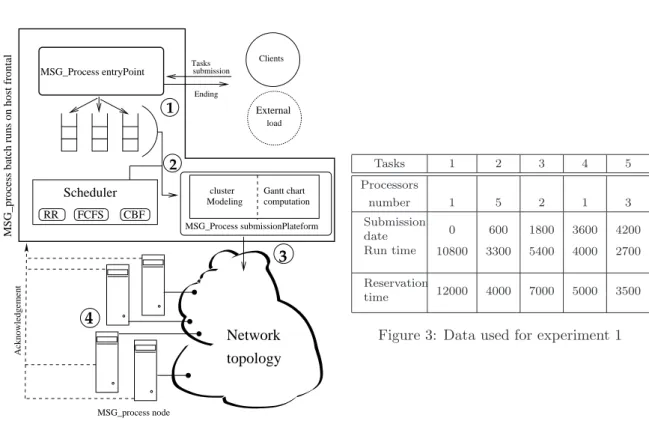
Figure 2: Simbatch architecture
Tasks 1 2 3 4 5 Processors number 1 5 2 1 3 Submission date 0 600 1800 3600 4200 Run time 10800 3300 5400 4000 2700 Reservation time 12000 4000 7000 5000 3500
Figure 3: Data used for experiment 1
compliant output with the Paj´e7
software is available allowing the draw of the Gantt chart of the execution.
3.2
Modeling
A cluster is composed of a frontal computer relied to interconnected computing resources following a specific topology. Usually, resources of a cluster cannot be accessed directly from outside the cluster: communications must be done through the frontal. The batch manager system is executed on the frontal node. Every jobs executing on the nodes must have been submitted to the batch system. It receives requests from users, schedules them on the parallel resources and execute the corresponding task when needed. Here, scheduling means that the batch scheduler has to determined the starting time of each computing task (scheduling phase) and to allocate computing nodes for each of them (mapping phase). The computing tasks are generally parallel and could have both input and output data.
In Simbatch, a parallel task submitted by a client is modeled by the addition of different information to a Simgrid task data type such as the number of nodes, the walltime, the run time. The other models are directly inherited from Simgrid. As exposed in Figure2, the task treatment is made in the following manner:
1. The entryPoint process accept parallel tasks submission from the different clients and put them in the right priority queue.
2. Thanks to the modeling unit, the scheduler assigns the starting time to the tasks and reserves the computing resources needed for their execution. A global view of the cluster is obtained by calculating the Gantt chart.
7
http://www-id.imag.fr/Logiciels/paje/
Simbatch: simulating and predicting performances of batch systems 7
3. The submission module manages the sending of each task at the starting date on the reserved resources. It controls the good respect of the reservation too. A task is killed if the walltime is exceeded.
4. Because Simbatch is build on top of Simgrid, it lets this one simulate communications and executions. When a task finishes its life cycle, an acknowledgement is sent to the batch process in order to update its global view of the cluster.
3.3
Using several batch schedulers with Simbatch
An experiment requires at least four files: a platform file, a deployment file, a batch configuration file and a file describing the tasks which will be submitted to each parallel resource, the external load.
Simgrid uses the platform file to describe resources which compose the simulated platform. It contains the description of all resources such as nodes network links, the connectivity of the platform, etc.
Simbatch requires a deployment file in which functions that should be attached to the resources are defined. Thus, to define the use of a batch scheduler on a frontal node, one must provide a line like: <process host="Frontal_lyon" function="SB_batch"/>
This line points out that the host named Frontal_lyon will execute the SB_batch process provided by the Simbatch API.
Likewise, one must declare for each computing resource of each cluster the execution of the SB_nodeprocess provided by the Simbatch API with a line like:
<process host="Node-lyon_1" function="SB_node"/>
The batch configuration file contains all information relative to each frontal nodes of the plat-form, like the number of waiting queues and the scheduling algorithm.
The external load is generated by the tasks submissions of the simulated grid platform users. The file, whose name is recorded in the configuration file, describes the tasks specifications such as the dates of submission, the number of processors, the walltime.
It is also possible to simulate an internal load for each batch scheduler. It aims at reproducing the task submissions of clients who are directly connected to the parallel resource, i.e., who are not actively participating to the simulated grid platform. There is at most the same number of internal load files than the number of frontal nodes in the platform.
We give p.13some of the files that we used for the experiments as an example. The main code shows a client submitting a task to a batch scheduler described as follows: use of an external load, 3 priority queues, 5 nodes directly connected to it with a star topology and the CBF algorithm.
4
Experiments
4.1
Tasks generation
In order to validate the results obtained with Simbatch, we have built a workload generator using the GSL library8
. It uses a Poisson’s law with parameter µ = 300 to generate inter-arrival time. Tasks specifications are determined by flat laws. Thus, CPU numbers are drawn from U (1; 7), execution durations from U (600; 1800) and walltimes are obtained by balancing the corresponding execution duration by a random number drawn from U (1.1; 3)
8
http://www.gnu.org/software/gsl/
8 Jean-S´ebastien Gay, Yves Caniou
Some experiments have been conducted with communicating tasks. They are all independent but require the communication of input data from the frontal node to one node allocated to the parallel task, and the communication of the output data back to the frontal node. In order to do this, we have created 6 files with a size of respectively 1, 2, 5, 10, 15, 20 Mb . One of this file is chosen randomly by a uniform law to be transfered as input data, while another file is chosen in the same manner to be transfered as output data.
4.2
Real experiments platform
OAR[2] is a batch reservation system developed in Grenoble. It is deployed on each site of the Grid’5000 platform. The scheduling algorithm used is CBF.
The 1.6 version of OAR has been installed on a cluster compound of a frontal and 7 servers SuperMicro 6013PI equipped with a Xeon processor at 2.4 GHz, each of them relied to a 100 Mbits/sec switch.
4.3
Protocol of experimentation
Two protocols of experimentation have been used to validate our work.
For the first one, we have generated several clusters, varying the number of nodes and the network topology used: bus, star, mixt. For each cluster, a batch system has been generated using one of the three algorithms provided by Simbatch and a number of priority queues randomly chosen.
For the second one, we have modeled the real platform by creating computing resources con-nected in a star topology. Then, thanks to our load generator, we have submitted the same load to both platforms (real and simulated). In this purpose, we have created a MPI9
computing task whose duration is passed in parameter. The task is executed between two calls for time measuring in an OAR script. The precision of the time measure is about 1 second, so it is negligible compared to the task duration.
5
Results and discussion
5.1
Validation of the scheduling algorithms
For each tuple (cluster, batch) generated for the first protocol, several experiments have been realized with the help of the workload generator described above. Thus, the three algorithms RR, FCFS, CBF provided by the Simbatch library have been the subject of intensive simulation tests in order to validate the accuracy of the results.
Figure 4shows the result obtained for one of the experience of the second protocol, described in Figure3. One can see the Paj´e Gantt chart on the left and the one obtained with the Drawgantt OAR tool on the right.
The tasks execution order is strictly the same: task 3, 4, 5 benefit from the backfilling and start their execution before task 2 which needs every nodes of the cluster. However, we can point out that Simbatch doesn’t necessarily allocate the same nodes than OAR (task 3).
5.2
Simbatch simulation precision
Two sets of experiments have been conducted with the second protocol: only computing tasks are involved in the first one, as the second one uses exclusively communicating tasks.
9
http://www-unix.mcs.anl.gov/mpi/
Simbatch: simulating and predicting performances of batch systems 9
Figure 4: Gantt chart for experiment 1 (5 nodes used): Simbatch (left), OAR (right)
5.2.1 Experiments involving computing tasks
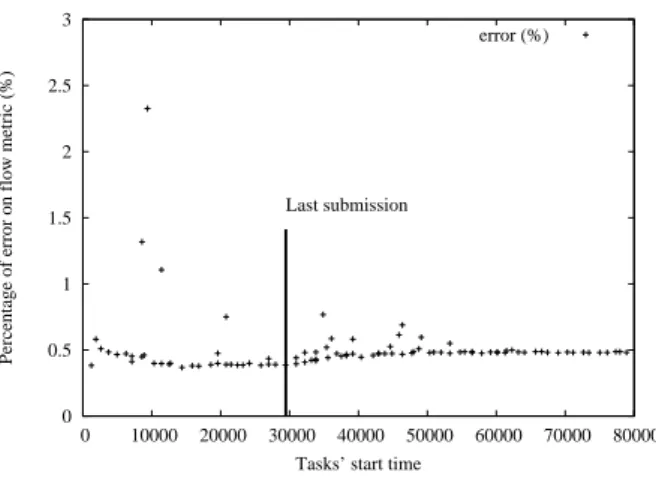
We have run a number of 5 experiments for the first set of experiments. It represents about 130 hours of computing on the cluster. Only computing tasks are involved. We present here a representative experiment for this set while Page14contains the results of the other experiments. The experiment consists in submitting the same set of 100 computing tasks to the real platform and to the simulated platform: results obtained with OAR was exactly 80392 seconds (about 22h) while the simulator gave us 80701 seconds. So the total execution time difference is only 308 seconds. It represents an error rate of 0.38%. This difference is mainly due to the mechanisms for interrogating the Mysql database, submitting tasks via ssh, etc.
Figure 5 shows the error rate obtained for the flow metric in function of the tasks execution date. The flow of a task is the time spent in the system, i.e., results from the addition of the waiting time passed in the queue, of the run time and of the communication costs. We can point out that the error rate is constant and generally below 1%, which is negligible compared to the precision of the measure. We can point out that for each experiment we have few tasks with an error rate above the 1%. This phenomenon is not due to a scheduling error but rather to some time precision here. In fact, some shorter and small tasks (time and processor) can enter the system and take advantage of the backfilling both with Simbatch and OAR. Because of the small gap between Simbatch and OAR starting time (thus between their ending time as well), the task begins a little later in reality, which can represent up to 15% and has only been observed once in our experiments (the second maximum observed is 6%).
An arrow is also drawn at time 29454: it represents the date of the last submission. In a dynamic environment, if we give to Simbatch every specifications of a set of tasks submitted to a batch scheduler, then Simbatch should be able to make a reliable predictions on the execution of this set several hours before the end.
5.2.2 Experiments involving communicating tasks
Following our excellent results obtained for the simulation of batch scheduler for parallel tasks without communication costs, we have decided to go further and we have tested Simbatch with experiments involving communication costs. Hence, we transfer some data from the frontal node to one of the allocated nodes for the parallel task. Once the computation done, we transfer back some data from the same allocated node to the frontal.
We have run the experiments on our platform with OAR and in simulation with Simbatch. Then, we have measured the flow for each task and we have calculated the error on the flow metric between simulation and real experiments.
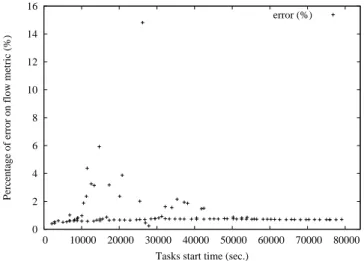
Figure6 depicts one representative experiment (others can be found Page15). The error rate is low, with an average around 2%. However a few tasks have a higher error percentage. After having analysed our results, we can point out that those tasks have the same profile, i.e., small computation time and few resources needed (typically 1 processor). When we analyse deeply, we
10 Jean-S´ebastien Gay, Yves Caniou 0 0.5 1 1.5 2 2.5 3 0 10000 20000 30000 40000 50000 60000 70000 80000
Percentage of error on flow metric (%)
Tasks’ start time Last submission
error (%)
Figure 5: Error ratios for an experiment scheduled with the Simbatch CBF and the real-life CBF implemented in OAR 0 5 10 15 20 0 10000 20000 30000 40000 50000 60000 70000 80000
Percentage of error on flow metric (%)
Tasks’ start time Last submission
error (%)
Figure 6: Error ratios for an experiment involving communication costs scheduled with the Sim-batch CBF and the real-life CBF implemented in OAR
Simbatch: simulating and predicting performances of batch systems 11
can conclude that those tasks are taking advantage of the backfilling in simulation contrarily to the reality. In spite of the fact that some tasks are scheduling earlier in simulation than in reality, the impact seems to be small on the other task flow: the duration of the task which benefited from a backfilling represents a small percentage of other task flow.
Thus, Simbatch obtains realistic results for simulated experimental studies. It allows to easily model parallel resources managed by a batch scheduler. The good quality of its simulation shows its relevancy in the study of scheduling algorithms for the grid. Furthermore, it can also be embedded as a prediction module of a grid middleware for example.
6
Conclusions and future works
The actual grid simulators do not allow to test easily new scheduling algorithms for the grid. Their API lacks of functionalities to quickly make use of batch schedulers generally present on clusters. This is why we suggest the Simbatch API, the first module integrated to Simgrid.
Simbatch is a tool that can be used for the conception of scheduling algorithms for batch schedulers and for the profiling of dynamic scheduling algorithms at the grid scale, such as a grid middleware having to take into account local scheduling policies of each clusters.
We have detailed those functionalities and we have specified the model we used. Then we have showed the facility for every Simgrid users to use Simbatch thanks to the examples coming from our validation work.
The main scheduling algorithms (Round Robin, First Come First Served and Conservative BackFilling) (the last two are respectively implemented in PBS, and in MAUI and OAR) are inte-grated and have been validated by several simulation experiments. Moreover, we have compared results obtained from Simbatch simulations with the ones from the real-life batch scheduler OAR. Simbatch shows very good precision with an error rate in general less than 1%.
This works open a lot of perspectives. The conception of Simbatch aims at providing us an easy way to elaborate and study dynamic scheduling algorithms that will be integrated in the hierarchical grid middleware Diet. The Grid’5000 resources should be easily modeled and some simulation experiments could be done in order to select the large scale experiments to test.
Furthermore, the submission of parallel tasks by a grid middleware is not an easy job, particu-larly due to the lack of profiling functionalities in batch schedulers. Thanks to Simbatch, it is now possible to use a plenty modeling of those systems in order to determine information such as: the number of processors to use for one task, in which queue submit this task, how long should hold out the reservation to obtain the earliest starting time. Thus, the middleware can determine which parallel resources to use with which parameters to choose. So we are thinking to the integration of Simbatch in the prediction performance module of Diet’s Sed deployed on parallel resources frontal.
12 Jean-S´ebastien Gay, Yves Caniou
References
[1] W. Bell, D. Cameron, L. Capozza, P. Millar, K. Stockinger, and F. Zini. Optorsim - a grid simulator for studying dynamic data replication strate-gies. Journal of High Performance Computing Applications, 17, 2003.
https://edms.cern.ch/file/392802/1/OptorSimIJHPCA2003.ps.
[2] N. Capit, G. Da Costa, Y. Georgiou, G. Huard, C. Martin, G. Mounier, P. Neyron, and O. Richard. A batch scheduler with high level components. In Cluster computing and Grid 2005 (CCGrid05), 2005. http://oar.imag.fr/papers/oar_ccgrid05.pdf.
[3] F. Cappello, F. Desprez, M. Dayde, E. Jeannot, Y. Jegou, S. Lanteri, N. Melab, R. Namyst, P. Primet, O. Richard, E. Caron, J. Leduc, and G. Mornet. Grid’5000: A large scale, recon-figurable, controlable and monitorable grid platform. In Proceedings of the 6th IEEE/ACM International Workshop on Grid Computing, Grid’2005, Seattle, Washington, USA, Novem-ber 2005.
[4] E. Caron, F. Desprez, E. Fleury, F. Lombard, J.-M. Nicod, M. Quinson, and F. Suter. Calcul r´eparti `a grande ´echelle, chapter Une approche hi´erarchique des serveurs de calculs. Herm`es Science Paris, 2002. ISBN 2-7462-0472-X.
[5] H. Casanova. Simgrid: A toolkit for the simulation of application scheduling. In Proceedings of the IEEE Symposium on Cluster Computing and the Grid (CCGrid’01). IEEE Computer Society, may 2001. Available athttp://www-cse.ucsd.edu/~casanova/.
[6] H. Casanova and J. Dongarra. Netsolve : A network server for solving computational science problems. In Proceedings of Super-Computing -Pittsburg, 1996.
[7] Walfredo Cirne and Francine Berman. Using moldability to improve the performance of supercomputer jobs. J. Parallel Distrib. Comput., 62(10):1571–1601, 2002.
[8] V. Garonne. DIRAC - Distributed Infrastructure with Remote Agent Control. PhD thesis, Universit´e de M´edit´eran´ee, D´ecembre 2005.
[9] A. Legrand, L. Marchal, and H. Casanova. Scheduling distributed applications: the simgrid simulation framework. In IEEE Computer Society, editor, 3rd International Symposium on Cluster Computing and the Grid, page 138. IEEE Computer Society, May 2003.
[10] A. W. Mu’alem and D. G. Feitelson. Utilization, predictability, workloads, and user runtime estimates in scheduling the ibm sp2 with backfilling. In IEEE, edi-tor, IEEE Trans. Parallel and Distributed Systeme, pages 529–543. IEEE, June 2001.
http://www.cs.huji.ac.il/~feit/papers/SP2backfil01TPDS.ps.gz.
[11] K. Ranganathan and I. Foster. Decoupling computation and data schedul-ing in distributed data-intensive applications. In 11th IEEE International Symposium on High Performance Distributed Computing (HPDC-11), 2002.
http://www.cs.uchicago.edu/%7Ekrangana/papers/decoupling_comp_data.ps.
[12] A. Takefusa, H. Casanova, S. Matsuhoka, and F. Berman. A study of deadline for client-server sytems on the computational grid. In 10th IEEE International Sympo-sium on High Performance Distributed Computing (HPDC-10), pages 406–415, 2001.
http://ninf.apgrid.org/bricks/.
Simbatch: simulating and predicting performances of batch systems 13
Annexe A
<?xml version=’ 1.0 ’ ?>
<!DOCTYPE platform description SYSTEM ”surfxml . dtd”> <platform description>
<process host=”Client ” function ”c l i e n t ”> <argument value=”0” />
<argument value=”0” /> <argument value=”0” />
<argument value=”Frontale” /> <!−− Connection −−> </process>
<!−− The Scheduler process ( with some arguments) −−> <process host=”Frontale” function=”SB batch”>
<argument value=”0” /> <!−− Number of tasks −−> <argument value=”0” /> <!−− Size of tasks −−> <argument value=”0” /> <!−− Size of I/O−−> <argument value=”Node1” /> <!−− Connections −−> <argument value=”Node2” />
<argument value=”Node3” /> <argument value=”Node4” /> <argument value=”Node5” /> </process>
<process host=”Node1” function=”SB node”/> <process host=”Node2” function=”SB node”/> <process host=”Node3” function=”SB node”/> <process host=”Node4” function=”SB node”/> <process host=”Node5” function=”SB node”/> </platform description>
Deployment file
<?xml version=’ 1.0 ’ ?>
<!DOCTYPE platform description SYSTEM ”surfxml . dtd”> <platform description>
<cpu name=”Client ” power=”97.34000000000000”/> <!−− One scheduler for one c l u s t e r of f i v e nodes −−> <!−− Power of the batch i s not important −−> <cpu name=”Frontale” power=”98.094999999999999”/> <cpu name=”Node1” power=”76.296000000000006”/> <cpu name=”Node2” power=”76.296000000000006”/> <cpu name=”Node3” power=”76.296000000000006”/> <cpu name=”Node4” power=”76.296000000000006”/> <cpu name=”Node5” power=”76.296000000000006”/> <!−− No discrimination for the moment −−>
<network link name=”0” bandwidth=”41.279125” latency=”5.9904e−05”/> <network link name=”1” bandwidth=”41.279125” latency=”5.9904e−05”/> <network link name=”2” bandwidth=”41.279125” latency=”5.9904e−05”/> <network link name=”3” bandwidth=”41.279125” latency=”5.9904e−05”/> <network link name=”4” bandwidth=”41.279125” latency=”5.9904e−05”/> <network link name=”5” bandwidth=”41.279125” latency=”5.9904e−05”/> <!−− Simple topologie −−>
<route src=”Client ” dst=”Frontale”><route element name=”0”/></route> <route src=”Frontale” dst=”Node1”><route element name=”1”/></route> <route src=”Frontale” dst=”Node2”><route element name=”2”/></route> <route src=”Frontale” dst=”Node3”><route element name=”3”/></route> <route src=”Frontale” dst=”Node4”><route element name=”4”/></route> <route src=”Frontale” dst=”Node5”><route element name=”5”/></route> <!−− Bi−directionnal −−>
<route src=”Node1” dst=”Frontale”><route element name=”1”/></route> <route src=”Node2” dst=”Frontale”><route element name=”2”/></route> <route src=”Node3” dst=”Frontale”><route element name=”3”/></route> <route src=”Node4” dst=”Frontale”><route element name=”4”/></route> <route src=”Node5” dst=”Frontale”><route element name=”5”/></route> </platform description>
Platform description file
<?xml version=”1.0 ” ?> <config>
<!−− Global s e t t i n g s for the simulation −−> <global>
<f i l e type=”platform”>platform .xml</ f i l e> <f i l e type=”deployment”>deployment .xml</ f i l e> <!−− Paje output : s u f f i x has to be . trace −−> <f i l e type=”trace ”>simbatch . trace</ f i l e> </global>
<!−− Each batch deployed should have i t s own config −−> <batch host=”Frontale”> <plugin>librrobin . so</plugin> <!−− Internal Load −−> <wld>./workload/seed /1.wld</wld> <priority queue> <number>3</number> </priority queue> </batch> <!−− Other batchs −−> </config>
Configuration of the simulated batch system
#i n c l u d e <s t d i o . h> #i n c l u d e <s t d l i b . h> #i n c l u d e <s t r i n g . h> #i n c l u d e <msg/msg . h> #i n c l u d e <s i m b a t c h . h> #d e f i n e NB CHANNEL 1 0 0 0 0 /* How t o c r e a t e a n d s e n d a t a s k */ i n t c l i e n t ( i n t a r g c , char * a r g v ) { j o b t j o b= c a l l o c ( j o b t , s i z e o f( j o b ) ) ; m t a s k t t a s k=NULL ; s t r c p y ( j o b−>name , ” t a c h e ” ) ; j o b−>n b p r o c s = 3 ; j o b−>p r i o r i t y = 1 ; j o b−>w a l l t i m e = 6 0 0 ; j o b−>r e q u e s t e d t i m e = 1 8 0 0 ; j o b−>i n p u t s i z e = 1 0 0 ; j o b−>o u t p u t s i z e = 6 0 0 ; t a s k = M S G t a s k c r e a t e ( j o b−>name , 0 , 0 , j o b ) ; M S G t a s k p u t ( t a s k , M S G g e t h o s t b y n a m e ( ” F r o n t a l e ” ) , CLIENT PORT ) ; } i n t main ( i n t a r g c , char ** a r g v ) { S B g l o b a l i n i t (& a r g c , a r g v ) ; M S G g l o b a l i n i t (& a r g c , a r g v ) ; /* O p e n t h e c h a n n e l s */ M S G s e t c h a n n e l n u m b e r (NB CHANNEL ) ; M S G p a j e o u t p u t ( ” s i m b a t c h . t r a c e ” ) ; /* T h e c l i e n t w h o s u b m i t s r e q u e s t s ( w r i t e y o u r o w n ) * P a r a m s h a v e t o b e c a l l e d w i t h t h e s a m e n a m e */ M S G f u n c t i o n r e g i s t e r ( ” c l i e n t ” , c l i e n t ) ; /* R e g i s t e r s i m b a t c h f u n c t i o n s */ M S G f u n c t i o n r e g i s t e r ( ” S B b a t c h ” , S B b a t c h ) ; M S G f u n c t i o n r e g i s t e r ( ” S B n o d e ” , S B n o d e ) ; M S G c r e a t e e n v i r o n m e n t ( ” p l a t f o r m . xml ” ) ; M S G l a u n c h a p p l i c a t i o n ( ” d e p l o y m e n t . xml ” ) ; MSG main ( ) ; /* C l e a n e v e r y t h i n g u p */ S B c l e a n ( ) ; MSG clean ( ) ; r e t u r n EXIT SUCCESS ; }
Simgrid main code
14 Jean-S´ebastien Gay, Yves Caniou
Annexe B
6.1
Experiment without communication
0 0.5 1 1.5 2 2.5 3 3.5 0 10000 20000 30000 40000 50000 60000 70000 80000
Percentage of error on flow metric (%)
Tasks’ start time (sec.) error (%)
Figure 7: This experiment is made up of 100 tasks. The error rate is very low and rarely over the 1%. These tasks are gener-ally taking advantage of the backfilling and we can point out the fact that they are con-centrated in the first quarter of the experi-ment. The difference of makespan observed between the simulation and OAR is 293 sec-onds for a makespan of 79442.0 secsec-onds in simulation. 0 0.5 1 1.5 2 2.5 3 3.5 0 10000 20000 30000 40000 50000 60000 70000 80000
Percentage of error on flow metric (%)
Tasks’ start time (sec.) error (%)
Figure 8: In this experiment made up of 100 tasks, the concentration of tasks enjoy-ing backfillenjoy-ing is around the middle. The max error rate is 3% and there are no other tasks having an error rate between 2 and 3%. The mean error rate is slightly higher than for the previous experiment, so the difference of makespan observed is a bit higher too with 411 seconds for a makespan of 84544.0 sec-onds in simulation. 0 2 4 6 8 10 12 14 16 0 10000 20000 30000 40000 50000 60000 70000 80000
Percentage of error on flow metric (%)
Tasks start time (sec.)
error (%)
Figure 9: At the contrary to the experiments depicted above, this experiment (100 tasks) shows a max error rate around the 15%. However, there has been no scheduling errors during this experiment. This is the perfect illustration for the consequence of measure precision on very short tasks taking advantage of the backfilling. For this experiment, we measured a deviation of 359 seconds between the makespan for a makespan of 80392 seconds in simulation
Simbatch: simulating and predicting performances of batch systems 15
6.2
Experiment with communication
0 10 20 30 40 50 0 10000 20000 30000 40000 50000 60000 70000 80000
Percentage of error on flow metric (%)
Tasks’ start time (sec.) error (%)
Figure 10: This experiment (100 tasks) has encountered problems during simulation. One of the task of this experiments has en-joyed backfilling in simulation and not in OAR. So we can show a task with a max error rate around the 50% and few tasks with an er-ror rate around 10%. However, after a sharp analysis , we conclude that the rest of that experiment don’t suffer too much from this error. Moreover, if we examine the error rate of the rest of the tasks in this experiment, we can point out the low variation (around the 4%) starting at time 30000 seconds.
0 10 20 30 40 50 0 10000 20000 30000 40000 50000 60000 70000 80000
Percentage of error on flow metric (%)
Tasks’ start time (sec.) error (%)
Figure 11: This experiment of 100 tasks pre-sented here shows errors in simulation that have some repercussions on other tasks. So between time 10500 seconds and time 60000 seconds, we have a lot of errors in the schedul-ing compared to the majority of experiences. At time 60000 seconds, the error rate is sta-bilized around the 4% and the scheduling be-comes the same again in OAR and in our sim-ulation. We can justify this stabilization by the fact that every short tasks have been ter-minated and it remains only the bigger tasks that can’t take advantage of the backfilling.
0 5 10 15 20 0 10000 20000 30000 40000 50000 60000 70000 80000
Percentage of error on flow metric (%)
Tasks’ start time (sec.)
error (%)
Figure 12: This experiment like the one in fig.6 has not encountered errors. The scheduling in the simulation was exactly the same than in OAR. The maximum error rate here, is around the 10% is due to the measure precision and the mean error rate is around 1%. A comparison of the makespan gives us a difference of 642 seconds.
Unité de recherche INRIA Rhône-Alpes
655, avenue de l’Europe - 38334 Montbonnot Saint-Ismier (France)
Unité de recherche INRIA Futurs : Parc Club Orsay Université - ZAC des Vignes 4, rue Jacques Monod - 91893 ORSAY Cedex (France)
Unité de recherche INRIA Lorraine : LORIA, Technopôle de Nancy-Brabois - Campus scientifique 615, rue du Jardin Botanique - BP 101 - 54602 Villers-lès-Nancy Cedex (France)
Unité de recherche INRIA Rennes : IRISA, Campus universitaire de Beaulieu - 35042 Rennes Cedex (France) Unité de recherche INRIA Rocquencourt : Domaine de Voluceau - Rocquencourt - BP 105 - 78153 Le Chesnay Cedex (France)
Unité de recherche INRIA Sophia Antipolis : 2004, route des Lucioles - BP 93 - 06902 Sophia Antipolis Cedex (France)
Éditeur
INRIA - Domaine de Voluceau - Rocquencourt, BP 105 - 78153 Le Chesnay Cedex (France)
http://www.inria.fr