HAL Id: tel-02129530
https://tel.archives-ouvertes.fr/tel-02129530
Submitted on 28 May 2019HAL is a multi-disciplinary open access archive for the deposit and dissemination of sci-entific research documents, whether they are pub-lished or not. The documents may come from teaching and research institutions in France or abroad, or from public or private research centers.
L’archive ouverte pluridisciplinaire HAL, est destinée au dépôt et à la diffusion de documents scientifiques de niveau recherche, publiés ou non, émanant des établissements d’enseignement et de recherche français ou étrangers, des laboratoires publics ou privés.
Investigation on the Diluent Effect on Solvent
Extraction Processes of Trivalent f-Elements by Di-Alkyl
Organophosphorus Extractants
Thibaut Lécrivain
To cite this version:
Thibaut Lécrivain. Investigation on the Diluent Effect on Solvent Extraction Processes of Trivalent f-Elements by Di-Alkyl Organophosphorus Extractants. Analytical chemistry. Washington State University, 2018. English. �tel-02129530�
INVESTIGATION ON THE DILUENT EFFECT ON SOLVENT EXTRACTION
PROCESSES OF TRIVALENT f - ELEMENTS BY
ACIDIC DI-ALKYL ORGANOPHOSPHORUS EXTRACTANTS
By
THIBAUT JEAN-MICHEL LUCIEN LÉCRIVAIN
A dissertation submitted in partial fulfillment of the requirements for the degree of
DOCTOR OF PHILOSOPHY
WASHINGTON STATE UNIVERSITY Department of Chemistry
17th of September 2018
© Copyright by THIBAUT JEAN-MICHEL LUCIEN LÉCRIVAIN, 2018 All Rights Reserved
© Copyright by THIBAUT JEAN-MICHEL LUCIEN LÉCRIVAIN, 2018 All Rights Reserved
To the Faculty of Washington State University:
The members of the Committee appointed to examine the dissertation of THIBAUT JEAN-MICHEL LUCIEN LÉCRIVAIN find it satisfactory and recommend that it be accepted.
Kenneth L. Nash, Ph.D., Chair
James Brozik, Ph.D., Co-Chair
Peter Reilly, Ph.D.
ACKNOWLEDGMENTS
« Que tu es plein de bon sens, mon petit bonhomme ; un de ces jours je te ferai passer docteur en gai savoir »
Translation
« You have plenty of common sense my little guy, one of this days I will make you doctor of merry knowledge »
Francois Rabelais - Gargantua. chap. 13
This journey would have not been possible without the love and support of my wife, Lindsey. I take this opportunity to express how grateful for her patience, her understanding, and countless help during my completion of this degree program. We certainly have traveled this road together, and I would not have made it without you.
I must thank my advisor and mentor Ken Nash for his support and guidance throughout the last couple of years. Having Ken has an advisor has given me the opportunity to grow up as a scientist. When I came to WSU for an internship, it was with the objective to learn about solvent extraction, and today I leave with a love of the subtlety of solution chemistry; a new skill set necessary to perform such research. Ken, you have taught me to critically analyze experimental results (like a chemist), which I believe was not necessarily an easy task. I will be forever grateful for the
opportunity to learn from the best professor in the field, and probably one the best scientists in the field in general.
Working with Ken Nash implies that I also work in the Nash Group and its colorful members. I must thank the postdoctoral researchers Julie Muller and Joey Lapka for their guidance and the time they gave me to answer to my countless questions. I would like to thank my present fellow graduate students in the Nash group, Guy Dutech, Matthew RisenHuber, and Samuel Miller, but also past members, with a special thanks to Ashleigh Kimberlin, Ian Hobbs, and Jeff Berry. I doubt that I would have been able to produce this quality of work without your constructive criticism of my work. I must also offer a special thanks to some graduate students from other WSU research groups such as Cecilia Eiroa Lledo, Sam Battey, Brian Backer, Cameron Naylor, Peyton Nosbusch, and many others.
I think it is also necessary to thank the Chemistry Department staff members. First the office folks especially Trent, Stacie, and Molly for the countless help and support. The teaching team especially Nikki, Ryan and Krista for your trust in me as a chemistry teacher; I learned a lot from you. Last but not least, the IT wizard Yoshi and his team of minions. All of you people are the backbones of this department.
While I have had great mentorship at WSU, I could not have made my way here without my previous mentors. Because of that I wanted to thanks my previous mentors from the CEA for guiding me from high school to WSU, starting with the clay people: Sebastien Savoye and Christoph Imbert (CEA Saclay), the resin calcinaters Sebastien Picart and Elodie Remy (CEA Marcoule), and the sonic bubble team: Matthieu Virot and Serguei Nikitenko (ICSM). Also a special thank you to Phillippe Moisy, who introduced me to the beauty of the solution chemistry of the f-elements. Today I laugh about it; I don’t think any of us imagined that I would eventually
complete a Ph.D program on solution chemistry of f-elements. The accomplishment of this doctoral program is a testament of all of your combined encouragements, guidance, and mentor skills.
I would also like to thank my parents, Florence and Jean-Louis Martin. I know it has been difficult for you to seem me moving on another continent. Thank you for giving me a lifetime of love and support. I think it is safe to say that I would not be here without you…
I wanted to thank some friends from outside WSU. Marie-Alix, thank you for your support, friendship, and for taking the time to speak with me on a regular basis (and for asking me to be your matron of honor. that was fun!). Thank you Agathe for your friendship and your happiness! There is so many other people that would deserve to be thanked but that are not listed here, such as Scott & Jess T (and Willow and Nyx), Jessica J, etc. Thank you, all of you! I will never forget your help and encouragement.
Lastly, I want to thank my committee, Profs Ken Nash, James Brozik, Pete Reilly and Philippe Moisy, who each had a hand in my scientific development, and eventual success of this project.
INVESTIGATION ON THE DILUENT EFFECT ON SOLVENT EXTRACTION
PROCESSES OF TRIVALENT f - ELEMENTS BY
ACIDIC DI-ALKYL ORGANOPHOSPHORUS EXTRACTANTS
Abstract
by Thibaut Jean-Michel Lucien Lécrivain, Ph.D. Washington State University
December 2018
Chair: Kenneth L. Nash
Solvent extraction is the most common chemical technique used in hydrometallurgical separations and purification of transition metals and f-elements. Solvent extraction of metallic cations, such as the f-elements, needs the use of organic ligands (extractants) to coordinate the targeted cation, to make it soluble in an organic phase and then allow the phase transfer from the aqueous phase to the organic one. The family of acidic di-alkyl organophosphorus extractants are the extractants of choice for trivalent metals. Furthermore, the large catalogue of diluents available for experimentation is one of the delightful aspects of solvent extraction chemistry (and probably to other chemistry domains). There are so many to choose from, and each has its special applications where it outshines the rest.
This dissertation is focusing on the influence of the choice of the diluent on the solvent extraction
process of selected trivalent f-elements (Nd3+, Eu3+, Tm3+ and Am3+) by HEH[EHP]. The results
show that the diluent influences the efficiency of the extraction (characterized by the Kex), but also
chelate is invariant from one diluent to another. The results of the extraction of Eu3+ by HEH[EHP]
are then compared to the diluent properties that are relevant for the solvation process (cavitation,
dispersion and association). Finally, van’t Hoff analysis is applied to the extraction of Am3+ and
TABLE OF CONTENTS
ACKNOWLEDGMENTS ... iii
ABSTRACT ... vi
LIST OF TABLES ... xi
LIST OF FIGURES ... xiii
1 INTRODUCTION ... 1
Solvent Extraction ... 1
Calculation of Equilibrium Constants ... 9
Analytical Determination of Distribution Ratios. ... 15
Research Focus ... 21 Research scope ... 42 References ... 44 2 METHODS ... 48 1.1. Materials ... 48 1.2. Purification methods ... 49 1.3. Neutron Activation ... 52
1.4. Solvent Extraction Method ... 54
1.5. Spectroscopic Methods ... 57
1.6. References ... 61 Page
3 DETERMINATION OF STABILITY CONSTANTS OF SOLVENT EXTRACTION OF
f-ELEMENTS BY HEH[EHP] IN VARIOUS DILUENTS ... 62
3.1 Preface ... 62 3.2 Introduction ... 64 3.3 Experimental ... 65 3.4 Discussion ... 90 3.5 Conclusion ... 97 3.6 References ... 98
4 CHARACTERIZATION OF THE DILUENT EFFECT ON SOLVENT EXTRACTION OF Eu(III) BY HEH[EHP] AS FUNCTION OF FUNDAMENTAL CHEMICAL PROPERTIES OF THE DILUENTS ... 101
4.1 Introduction ... 101
4.2 Theory of Thermodynamic of the Solvation Process ... 102
4.3 Metrics and Objectives ... 106
4.4 Specific Interactions: Solvatochromic parameters ... 120
4.5 Discussion on the Diluent Effect ... 128
4.6 Conclusion ... 138
4.7 References ... 139
5 THERMOMETRIC CHARACTERIZATIONS OF THE EFFECT OF THE DILUENT ON THE EXTRACTION OF f-ELEMENTS BY HDEHP ... 143
Introduction ... 143
Principle of Thermochemical Analysis ... 144
Experimental ... 149 Discussion ... 154 Future Work ... 157 Conclusion ... 158 References ... 159 6 GENERAL CONCLUSIONS ... 161 A. APPENDIX ... 164
LIST OF TABLES
Table 1-1. Acidic organophosphorus extractant compound ... 23
Table 1-2. Reichardt 2003 solvent classification scheme ... 29
Table 1-3. Kolthoff and Reichardt solvent classification scheme ... 30
Table 1-4. Chastrette solvent classification scheme ... 30
Table 1-5. The mole fraction of solubility of the diluent in water, of the water in diluent, and the corresponding 1-octanol/water partition constant ... 33
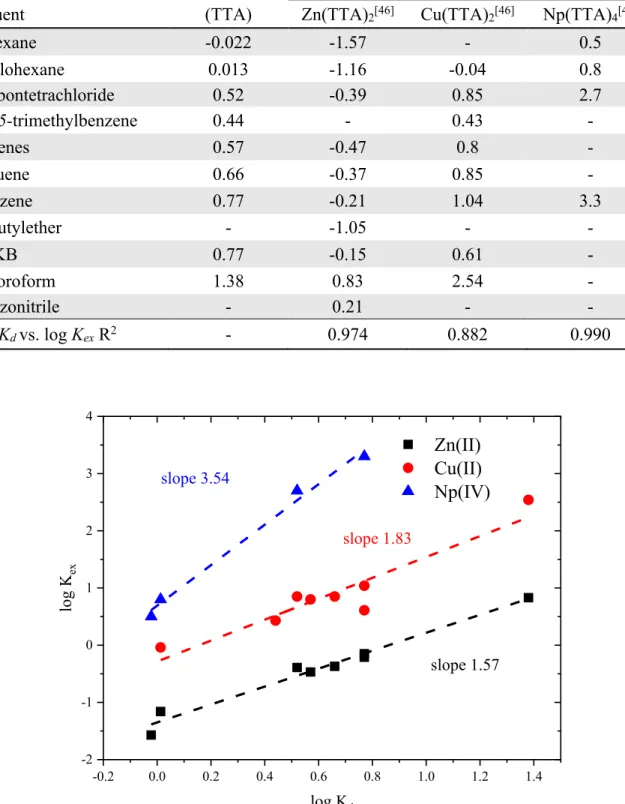
Table 1-6. Partitioning (Kd) and extraction equilibrium (Kex) constants involving HTTA, from 1 mol·L-1 (Na-H)ClO 4 into various diluents. ... 36
Table 1-7. Thermodynamic data involving HDBP, distribution[49] K d and extraction data of metal chelate[27], K ex from 0.1 mol·L-1 (Na-H)NO3 into various diluents. Bold: aqueous 1.0 mol·L-1 (Na-H)NO 3. Parenthesis: distribution form another source.[28] r: corrected value ... 38
Table 1-8. Thermodynamic data involving HDOP, Extraction data of metal chelate, log Kex from 0.1 mol·L-1 (Na-H)NO 3 into various diluents, and average ligand number in the metal chelate from ref [36]. ... 40
Table 2-1. Feature of 5D 0 → 7Fj luminescent transitions for Eu3+.[8] ... 59
Table 3-1. Equilibria constants of extraction of Eu3+by HEH[EHP] for 0.1 mol·L-1 (Na-H)NO3 at 25°C ± 1°C. log Kex represent the equilibria constant considering only the complex Eu(AHA)3, log 𝐾#$∗ consider the average ligand number 𝑛. Complex* refer to the largest portion of complex considering the average ligand number. Type of diluent: i = inert, D = donor, A = acceptor. (a) the efficiency of the extraction seem to be one order of magnitude lower than expected, (b) the efficiency of the extraction seem to be a couple of order of magnitudes lower than expected ... 73
Table 3-2. Equilibria constants of extraction of Tm3+by HEH[EHP] for 0.1 mol·L-1 (Na-H)NO3 at 25°C ± 1°C. log Kex represent the equilibria constant considering only the complex Tm(AHA)3, log 𝐾#$∗ consider the average ligand number 𝑛. Complex* refer to the largest portion of complex considering the average ligand number. Type of diluent: i = inert, D = donor, A = acceptor.(a) ) the efficiency of the extraction seem to be one order of magnitude lower than expected ... 76
Table 3-3. Equilibria constants of extraction of Nd3+by HEH[EHP] for 0.1 mol·L-1
(Na-H)NO3 at 25°C ± 1°C. log Kex represent the equilibria constant considering only the
complex Nd(AHA)3, log 𝐾#$∗ consider the average ligand number 𝑛. Complex* refer to the
largest portion of complex considering the average ligand number. Type of diluent: I = inert, D = donor, A = acceptor. ... 79
Table 3-4. Equilibria constants of extraction of Am3+by HEH[EHP] for 0.1 mol·L-1
(Na-H)NO3 at 25°C ± 1°C. log Kex represent the equilibria constant considering only the
complex Am(AHA)3, log 𝐾#$∗ consider the average ligand number 𝑛. Complex* refer to
the largest portion of complex considering the average ligand number. Type of diluent: i = inert, D = donor, A = acceptor. ... 80
Table 3-5. Feature of the 5D
0 → 7Dn luminescence transition for Eu3+ ... 83
Table 3-6. Organic phase Nd(III) metal loading information ... 89 Table 5-1. Calculated thermodynamic parameters, ΔG (calculated for 298.15 K), ΔH, and
TΔS for the extraction of Nd(III) and Am(III) by HDEHP in various diluents (n-octane,
toluene, chloroform, nitrobenzene) from acidic nitrate media, µ = 0.1 mol·L-1 (Na-H)NO3
at pH=2. Values calculated from equation (5.14), uncertainties in ΔH and TΔS calculated from the unweighted linear regression and the 95% confidence interval of the fitting. (T = 298.15 K) ... 153
Table 5-2. Parameters calculated from the linear enthalpy-entropy compensation effect ... 157 Table A-1. Comparison of the deathprint of each electricity production technology. ... 179
LIST OF FIGURES
Figure 1-1. Schematic representation of solvent extraction, where a solute S is distributed
between the upper (lighter) yellow phase and the lower (heavier) blue phase. ... 1
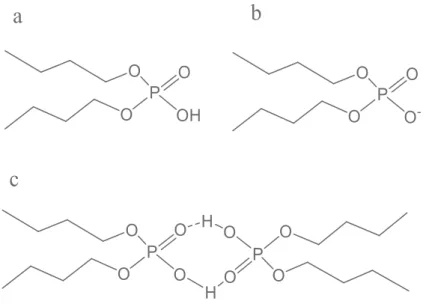
Figure 1-2. Structures of the acidic organophosphorus extractant DBP, (a) acidic monomer,
(b) conjugated base, (c) dimeric form ... 3
Figure 1-3. Solvating extractant extraction process, where M represent a metal cation, A
represent an anion, B a solvating extractant ... 6
Figure 1-4. Structure of the solvating Calix[4]arene-bis(t-Octylbenzo-Crown-6) ... 7 Figure 1-5. Solvent Extraction by ion exchange process, where M represent a metal cation,
HA represent a weak acid organic extractant, and A its aqueous conjugate base ... 8
Figure 1-6. Structure of the acetyl acetone derivative thenoyltrifluoroacetone (HTTA) ... 9 Figure 1-7. Extraction of Cu(II) from 1 mol.L-1 NaClO
4 into benzene as a function of pH
(large figure) and of free acetylacetonate ion concentration (insert) at several formal concentrations of acetylacetone. Figure from ref [17] ... 14
Figure 1-8. Picture of a solution of Arsenazo III in absence of metal (left) and the same
solution in presence of Eu(NO)3 ... 16
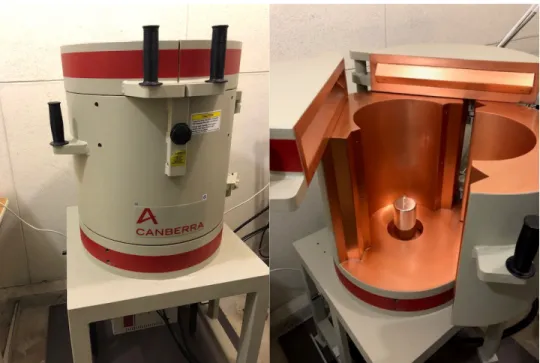
Figure 1-9. Self-cooled high precision gamma counting instrument, left instrument closed
for analysis, right instrument open for sample changing. ... 20
Figure 1-10. Structures of tributyl phosphate (a) dibutyl phosphoric acid (b) and monobutyl
phosphoric acid (c) ... 22
Figure 1-11. Chemical structure of (a) Bis-2-ethyl(hexyl) phosphoric acid (HDEHP) and (b)
2-Ethyl(hexyl)phosphoric acid mono-2-ethyl(hexyl) ester. pKa values from ref [35] ... 24
Figure 1-12. Accepted schematic diagram of equilibria in extraction of cation (M) by
HEH[EHP] (HA) based on literature equilibria ... 25
Figure 1-13. Accepted structure of the metal chelate formed between a metal cation of
charge n and n dimers ref [9]- appendix D ... 26
Figure 1-14. Schematic representation of the London dispersion. Top for a monatomic
particle, bottom for a hydrocarbon ... 31
Figure 1-16. Schematic representation of observed water/diluent positioning for
fluorobenzene used as a diluent (this work) ... 35
Figure 1-17. Graphic plot between the distribution ratio of the TTA and the coefficient of extraction of the metal chelate from Table 1-6 ... 36
Figure 1-18. Graphic plot between the distribution ratio of the HDBP and the coefficient of extraction of the metal chelate from Table 1-7 ... 39
Figure 1-19. Schematic representation of (a) di-octyl-phosphoric acid (HDOP), of the metal chelate with an average ligand number of 3 (b) and 2.5 (2) ... 41
Figure 2-1. Common impurity found in di alkyl phosphoric acid (mostly A, and C) and alkyl alkyl phophonic acid (mostly B, C and D). A: di-alkyl phosphonate, B: alkyl alkyl phosphinate, C: Mono-alkyl phosphoric acid, Mono-alkyl phosphonic acid.[2] ... 49
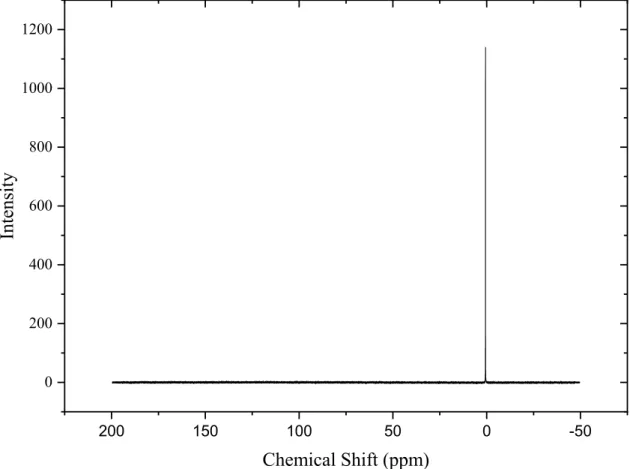
Figure 2-2. 31P NMR chemical shift for HDEHP purity control, in DCCl3 ... 52
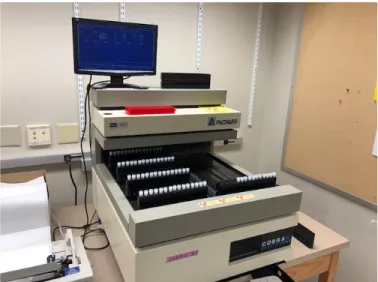
Figure 2-3. The Gamma counter, Packard Model 5003 Cobra II Auto Gamma Counter ... 55
Figure 2-4. Liquid scintillation counter, Beckman LS 6500 Auto Counter ... 57
Figure 2-5. Schematic of the utilization of the cuvette for Eu3+ luminescence ... 60
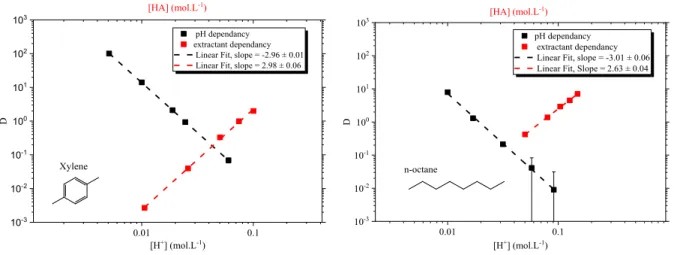
Figure 3-1. Graphic slope analysis of sample plots for: left xylene, right n-octane. Unweighted fit of log D vs. log [H+] and log [(HA)2]. Metal 152/154Eu tracer extracted from nitric media (Na-H)NO3 µ = 0.1 mol·L-1. ... 68
Figure 3-2. LNM and GSA plot for the extraction of Eu3+ by HEH[EHP] from (H-Na)NO 3 media µ = 0.1 mol·L-1 and room temperature. The logarithm of the distribution of europium between the organic and aqueous phase, versus the logarithm of the formal concentration of extractant. Unweighted fit. Top left in iso-octane, top right in benzene, bottom left in methyl iso butyl ketone, and bottom right in chloroform. ... 70
Figure 3-3. LNM and GSA plot for the extraction of Tm3+ by HEH[EHP] from (H-Na)NO3 media at 0.1 mol·L-1 and room temperature. The logarithm of the distribution of thulium between the organic and aqueous phase, versus the logarithm of the formal concentration of extractant. Unweighted fit. Top left in toluene, top right in chloroform, bottom left in iso-octane, and bottom right in nitrobenzene. ... 75
Figure 3-4. LNM and GSA plot for the extraction of Nd3+ (blank) and Am3+ (solid) by HEH[EHP] from (H-Na)NO3 media at 0.1 mol·L-1 and room temperature. The logarithm of the distribution of tracers between the organic and aqueous phase, versus the logarithm of the formal concentration of extractant. Unweighted fit. Top left in n-octane, top right in benzene, bottom left in MIBK, and bottom right in chloroform ... 78
Figure 3-5. Luminescence in lanthanide complexes ... 81 Figure 3-6. Europium luminescence under 245 nm excitation beam, left: europium(III)
nitrate hexahydrate crystals, right: europium(III) oxide powder. ... 82
Figure 3-7. Red: example of a luminescence from an Eu-HEH[EHP] metal chelate in
n-octane, excitation wavelength 393 nm, approx of 0.5 mmol·L-1 of metal chelate extracted
by 0.1 mol·L-1 HEH[EHP], light red: first derivative of the luminescence spectra used to
detect the 5D0 → 7F(0-2) transitions. ... 83
Figure 3-8. Luminescence from an Eu-HEH[EHP] metal chelate in TCE (black), n-octane
(red), toluene (blue), MIBK (green), chloroform (purple). excitation wavelength 393 nm,
approx of 0.5 mmol·L-1 of metal chelate extracted by 0.1 mol·L-1 HEH[EHP], 5D0 → 7F
(0-2) transitions ... 84
Figure 3-9. Visible absorption of Nd-HEH[EHP] metal chelate in organic phase, 7.9
mmol·L-1 Nd and 506 mmol·L-1 HEH[EHP] in toluene ... 86
Figure 3-10. Visible absorption of Nd-HEH[EHP] metal chelate in n-octane organic phase
at different metal loading condition, mononuclear metal chelate in red, 3rd phase in black ... 87
Figure 3-11. Neodymium-HEH[EHP] metal chelate visible molar absorptivity in different
diluent: Toluene (black), n-octane (red), MIBK (blue), TCE (green), chloroform (purple). Other information in the Table 3-6. ... 88
Figure 3-12. Possible chelate rings around the metal center, left 4 atoms chelate ring, right
8 atoms chelate ring ... 90
Figure 3-13. Octahedral isomers, left: facial isomer, center: left-handed Δ-meridional
isomers, right: right-handed Λ-meridional isomer. In blue the ionic binding of Eu3+--O-P,
in red the ion-dipole interaction Eu3+--:O=P, in black dash the chelate rings. ... 91
Figure 3-14. Possible coordination modes around the neodymium metal center, left 3 atoms
chelate ring, renter 7 atoms chelate ring, right no ring with a molecule of MIBK coordinated in the first coordination sphere. ... 92
Figure 3-15. Chemical structure of di-octyl phosphoric acid ... 93 Figure 3-16. Linear Gibbs energy plots of Eu3+ extraction equilibrium data. Correlation
between the Gibbs energy of extraction of Eu3+ by di-octyl phosphoric acid (HDOP) and
2-ethylhexylphosphonic acid mono-2-ethylhexyl ester (HEH[EHP]) in various diluents. Red: inert diluents (aliphatic hydrocarbon), green : aromatic diluents, purple: n-donors. ... 93
Figure 3-17. Linear Gibbs energy plot of Eu3+ and Tm3+ extraction by HEH[EHP] from
nitrate media (H-Na)HNO3 µ = 0.1 mol·L-1 at T = 25°C – data from Table 3-1 and Table
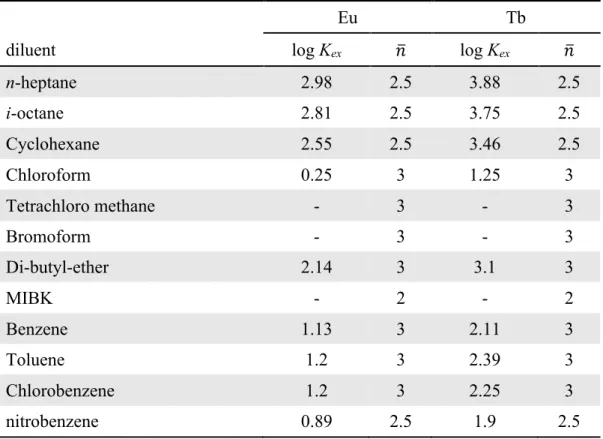
Figure 3-18. Linear Gibbs energy plot of Eu3+ and Tb3+ extraction by HDOP from nitrate
media (H-Na)NO3 µ = 1.0 mol·L-1 at T = 25°C, data from Kolarik - Table 1, ref: [6]. Red:
inert diluents (aliphatic hydrocarbon), green: aromatic diluents, purple: n-donors, orange: acceptor ... 95
Figure 3-19. Linear Gibbs energy plot of Nd3+ and Am3+ extraction by HEH[EHP] from
nitrate media (H-Na)HNO3 µ = 0.1 mol·L-1 at T = 25°C – data from Table 3-3 and Table
3-4. Red: inert diluents (aliphatic hydrocarbon), green: aromatic diluents, purple: n-donors,
orange: acceptor ... 95
Figure 4-1. Schematic representation of a cavitation process needed for the solvation process
of a solute in a non-interacting diluent ... 104
Figure 4-2. Correlation between the variation of the Gibbs energy of europium extraction in
different diluents by HEH[EHP] (results from the extraction from the Chapter 3, Table 3.1, results relative to carbon tetrachloride) and the cohesive energy density calculated from equation (4.12) ... 110
Figure 4-3. Correlation between the variation of the Gibbs energy of europium extraction in
different diluents by HEH[EHP] (results from the extraction from the Chapter 3, Table 3.1, results relative to carbon tetrachloride) and the polarity of the diluent calculated from the Debye equation calculated using equation (4.17) ... 113
Figure 4-4. Fitting of free Gibbs energy of europium extraction in different diluents by
HEH[EHP] (results from the extraction from the Chapter 3, Table 3.1, results relative to
carbon tetrachloride) against the polarity parameter f(εr) < 0.3 ... 114
Figure 4-5. Correlation between the variation of the Gibbs energy of europium extraction in
different diluents by HEH[EHP] (results from the extraction from the Chapter 3, Table 3.1, results relative to carbon tetrachloride) and the polarizability of the diluent calculated from the Lorenz-Lorenz function calculated using the equation (4.18) ... 116
Figure 4-6. Correlation between the variation of the Gibbs energy of europium extraction in
different diluents by HEH[EHP] (results from the extraction from the Chapter 3, Table 3.1, results relative to carbon tetrachloride) and the polarity of the diluent based on the dipole moment using the dipolar field function calculated with equation (4.19) ... 118
Figure 4-7. Correlation between the variation of the Gibbs energy of europium extraction in
different diluents by HEH[EHP] (results from the extraction from the Chapter 3, Table 3.1, results relative to carbon tetrachloride) and tabulated Hansen solubility parameters from
reference [30] ... 119
Figure 4-8. Schematic representation of a ground state property of a solvatochromic
molecule ... 120
Figure 4-9. Schematic representation of iacetylacetonatooxovanadium(IV) used as DN
Figure 4-10. Correlation between the variations of the Gibbs free energy of europium
extraction in different diluents by HEH[EHP] (results from the extraction from the Chapter 3, Table 3.1, results relative to carbon tetrachloride) and tabulated DN from reference [33]. The slope is the fit result, excluding the inert diluents ... 122
Figure 4-11. Schematic representation of the solvatochromic chromophore used for the
determination of the β scale. Top left nitrophenol, top right nitroanisol, bottom left 4-nitroaniline, bottom right 4-nitro-N,N-diethylaniline ... 123
Figure 4-12. Correlation between the variations of the Gibbs free energy of europium
extraction in different diluents (relative to carbon tetrachloride) and tabulated β from reference [33]. The slope is the fit result, excluding the inert diluents ... 124
Figure 4-13. Schematic representation of the solvatochromic chromophore used for the
determination of the SB scale. Left 5-nitroindoline, right 1-methyl-5-nitroindiline ... 125
Figure 4-14. Correlation between the variations of the Gibbs free energy of europium
extraction by HEH[EHP] in different diluents (relative to carbon tetrachloride) and tabulated SB from reference [35]. ... 126
Figure 4-15. Schematic representation of butylstilbazolium molecule used as a
solvatochromic chromophore by Catalan to develop the SA scale, where R and R’ can be
either –H or –C(CH3)3 ... 127
Figure 4-16. Molecular electrostatic potential maps of a HEH[EHP], top monomer,
bottom dimer. The green surface are the surface with a zero potential, the red regions are hydrogen bonding acceptors, and the blue is hydrogen bonding donor. ... 130
Figure 5-1. Left: vial and lifting used for the solvent extraction van’t Hoff analysis, right:
temperature controlled water bath. ... 150
Figure 5-2. Change in log Kex for Nd (red) Am (black) extractions with HDEHP, within different diluents (top left toluene, top right chloroform, bottom left n-octane, bottom right nitrobenzene) as a function of the temperature. ... 152
Figure 5-3. Correlation of ΔH and TΔS of extraction of a series of diluent (where T =
298.15°K). Black squares: neodymium data, red spheres: americium data. ... 156
Figure A-1. Daily consumption of energy per capita vs. the six stages of human development
... 166
Figure A-2. United Nation HDI data[4] versus annual PCEC[3] ... 169
Figure A-3. World population estimates from 1800 to 2100, based on "high", "medium" and
"low" United Nations projections in 2017[7] ... 170
Figure A-4. CO2 gas pollutant emission per unit of energy used (integrated though the LCA,
Figure A-5. NOX (left) and SO2 (right) pollutant emission per unit of energy used (integrated
though the LCA, in function of the energy source. ... 173
Figure A-6. Range of material requirement (fuel excluded) for various electricity generation
technologies ... 175
Figure A-7. Representative of the land use estimates for a variety of the electricity
generating technologies from reference [11]. Left: data represented on a linear scale, right: data represented on a logarithmic scale. ... 176
Dedication
This dissertation is dedicated to my wife Lindsey, my mother, and father for your support, kindness, and selflessness.
CHAPTER ONE
1
INTRODUCTION
Solvent Extraction
Generality
Solvent Extraction (SX) is one of the most common separation techniques, because of its simplicity, speed and wide scope. SX is a practice that has been performed for centuries to achieve
many objectives.[1] It is the main process involved in perfume and dye extractions, but also the
reprocessing of Rare Earth Elements for energy production and technology development[2], the
purification of plutonium for the making of atomic bombs[3], the recycling of nuclear fuels[4], and
the separation and purification of strategic transition metal[5]. This technique has also been shown
by Rydberg to be extremely useful in the determination of metal-ligand stability constants.[6]
Therefore, modern use has made this process an essential daily practice in many scientific laboratories. The main concept of solvent extraction is using the difference of solubility of an analyte (S) between two immiscible liquids to partition the solute between the two phases.
Figure 1-1. Schematic representation of solvent extraction, where a solute S is distributed between the upper (lighter) yellow phase and the lower (heavier) blue phase.
The distribution law, derived in 1898 by W. Nernst[7], relates the distribution of a solute between
phase 1 and phase 2.
S)*+,- . ⇌ S)*+,- 0 (1.1)
The equilibrium constant for reaction (1.1), the Nernst distribution law, called the distribution constant (originally described in French: “coefficient de partage”), can be written as shown in equation (1.2).
𝐾1 =[S)*+,- 0]
[S)*+,- .] (1.2)
where the brackets denote the concentration of the solute. If KD is greater than one, the solute will
move from phase 1 to phase 2. Conversely, the solute will remain in phase 1 if the distribution constant is less than one.
The KD is an interesting parameter for solvent extraction, it is applicable to describe the distribution
of a molecular solute that can be stabilized in either phase by the action of solvation alone (Nernst law). The Nernst partitioning coefficient does not apply if the analyte needs a chemical reaction to be extracted. If a chemical reaction other than solvation is required, the primary parameter in solvent extraction is the distribution ratio D, calculated by the ratio of the formal concentration of the analyte in the organic phase over the formal concentration of the same analyte in the aqueous phase.
𝐷 = ∑[𝐴̅]
Example 1: Distribution constant vs. distribution ratio of HDBP[8]
In 1976, Bale et al.[8] published a study on the equilibrium constants of partitioning of
dibutyl phosphoric acid (HDBP). This molecule is an acidic organophosphorus extractant that can be present by itself in multiple species in each phase. In the organic phase it is present primarily as a dimer (HA)2, but also in smaller quantities as a monomer HA. In
aqueous solution, it acts as a weak acid, and therefore is present as a protonated (HA) acid and its conjugate base A-. Therefore the only distribution constant for a HDBP describes
the partitioning of the protonated monomer (a):
Figure 1-2. Structures of the acidic organophosphorus extractant DBP, (a) acidic monomer, (b) conjugated base, (c) dimeric form
𝐾1= [𝐻𝐴::::]
[𝐻𝐴] (1.4)
while the distribution ratio accounts for (HA)2, HA, and A-.
𝐷 =∑[𝐻𝐴::::] ∑[𝐻𝐴]=
[𝐻𝐴] + 2[(𝐻𝐴)0]
The Nernst partitioning constants and the distribution ratio describing two different analytes can be significantly different depending on the experimental conditions. This difference can be exploited to separate two analytes. This process is called liquid-liquid separation (extraction) and is characterized by the separation factor (SF), which is defined by the equation (1.6)
𝑆𝐹B./B0 = 𝐾1B. 𝐾1B0 (1.6) 𝑆𝐹B./B0= 𝐷B. 𝐷B0 (1.6)
It is also interesting to note that in more “practical” situations (such as in chemical engineering for characterizing separation schemes), solvent extraction can be characterized in percent extraction of a solute (also called the extraction factor):
%𝐸 = 100 𝐷
1 + 𝐷 (1.7)
Different Types of Solvent Extraction of Metal Cations
During the early years of the solvent extraction sciences, SX was mostly used by organic chemists for separating organic substances. Since in those extraction the solute often exists under the same molecular (or supramolecular) form, the system is often referred to as non-electrolyte reaction
bases) could complex a targeted ion in an aqueous phase, to form a complex soluble in an organic phase.
SH/?+ A?/H ⇌ SA (1.8)
where S represents the targeted ionic solute in the aqueous phase, A the organic ligand, SA the complex and the bar on the top of the complex specifies that the complex is solvated in the organic phase. This is an example of an ion pairing extraction. The reagent responsible for forming the extractable (solvable) complex is termed the extractant.
1.1.2.1 Solvent Extraction by Solvating Agent
Here the SX by Solvating Agent (SXSA) is in particular the one described as extraction of metal
complex as adducts in Solvent Extraction, Principle and Practice[9]. Solvent extraction by a
solvating agent is the extraction process in which a neutral extractant is extracting a neutral species.
If the neutral extractant is coordinatively unsaturated, it forms a MAz(H2O)x hydrated species. If
the ligand A is not an extractant, this hydrated species does not partition into the organic phase. However, if the aqueous molecules are replaced by organic neutral molecules, the lipophilicity of the adduct will drastically increase (proportionally to the number of coordinated organic
extractant) until saturation[10].
MKH+ zA?+ bB O ⇌ MA
K∙ bB
Figure 1-3. Solvating extractant extraction process, where M represent a metal cation, A represent an anion, B a solvating extractant
For this SX process to be optimal, the coordination number of the cation must be equal to nz + x, where n is equal to the denticity of A, z the number of A needed to neutralize M, and x the number
of water molecules coordinating the MAz complex. In SXSA processes, several type of adducts
can exist, for example, A can be either an inorganic anionic salt (ClO4-, F-, NO3-, etc.), or an organic
anionic neutralizer (DBP, COONa, etc), or even a metallic weak acid, (TcO4-). It is also possible
that B is the protonated neutral variant of A of the same molecule (self adducts).
Examples of metal ion SXSA:
Example 2: Cation extraction: extraction equilibrium of CsNO3 by calixarene extractant[11]:
CsH+ NO
UH+ Clx:::: ⇌ CsNO::::::::::::::: U∙ Clx (1.10)
Here the metal ion is cesium cation (Cs+), neutralized by a nitrate anion (NO 3-) and
extracted by the solvating agent Calix[4]arene-bis(t-Octylbenzo-Crown-6) in 1,2-Dichloroethane (Clx)
Figure 1-4. Structure of the solvating Calix[4]arene-bis(t-Octylbenzo-Crown-6)
Example 3: Anion extraction: extraction equilibrium of perrhenic acid by tri alkyl amine[12]:
ReOZ?+ HH+ TıOA::::::: ⇌ HReO
Z∙ TıOA
::::::::::::::::: (1.11)
Here the metal ion is the perrhenate anion (ReO4-), neutralized by a proton (H+) and
extracted by the solvating agent tri-isooctyl amine (TiOA).
1.1.2.2 Solvent Extraction by Ion Exchange
The method of SX by Ion eXchange process (SXIX) is in particular the method described as
extraction of coordinatively saturated metal chelate type complex in Solvent Extraction, Principle
and Practice.[9] This SX process uses organic/lipophilic weak Brönsted acids as extractants. The
organic acid ligands are able to complex a metal ion through multiple binding sites of basic atoms (such as O, N, S) to form a metal chelate. This type of chelation provides, to the metal complex, an extra stability in the organic phase. In the extraction reaction, an equivalent number of hydrogen ions to the cationic charge are exchanged to the aqueous phase simultaneously with cation transfer to the organic phase to maintain electroneutrality in both phases:
MHK+ zHA:::::: ⇌ MA
K
In order to describe more precisely SEIX, it is not unusual to describe the extraction process
through a stepwise reaction with the deprotonated anion A- added until the coordination sphere of
the metal being mostly (or completely) saturated with the extractant (water could be also present in the coordination sphere, depending on the denticity and the concentration of the extractant). When the number of extractants are sufficient for the metal chelate to become hydrophobic, the complex can partition between the phases.
Figure 1-5. Solvent Extraction by ion exchange process, where M represent a metal cation, HA represent a weak acid organic extractant, and A its aqueous conjugate base
It is relevant to note that chelated multidentate acidic extractants can also create adducts with free ligand in the organic phase, creating self adduct system similar to the one described at the end of the SXSA paragraphs (section 1.1.2.1). Also, the same metal chelate can react with another metal chelate present in the organic phase if their concentrations are large enough, creating heavy organic polynuclear species.
Example 4: Extraction of Al(III) by TTA[13]
Acetylacetone, representative of the class of extractants known as β-diketones, can coordinate in multiple ways to the metal atom. For the extraction by ion exchange, it must complex through a dissociated anionic enol form. In those condition (and those condition only can it act as a weak acid extractant).
AlUH+ 3HTTA:::::::: ⇌ Al(TTA):::::::::::
U+ 3 HH (1.13)
Here the metal extracted is trivalent aluminum (Al3+) extracted by three anionic TTA-. It is
important to note that for this extraction, the pH is a factor in determining the position of the equilibrium.
Figure 1-6. Structure of the acetyl acetone derivative thenoyltrifluoroacetone (HTTA)
Calculation of Equilibrium Constants
The previous section presented chemical equilibria that describe the extraction of metals from an aqueous phase into an organic phase. However to fully understand solvent extraction processes, the identification of the species extracted and the determination of biphasic equilibrium constants are critical (and generally strongly correlated). The creation of models can provide a rational
understanding of the chemical principles of solvent extraction to determine those equilibrium constants.
Two of major methods of determination of critical stability constants are the Ligand Number
Method and Graphic Slope Analysis, both usually referred to as slope analysis.
Ligand Number Method (LNM)
In 1941, Bjerrum developed the LNM method to identify the average composition of the metal
species in the system[14]. This method considers the extraction of MAn into the organic phase and
assumes that the metal exists as one species, MAn, in the aqueous phase. Taking the derivative the
logarithm of the distribution of the metal between each phase versus the logarithm of the formal
concentration of extractant in the system the following equation (1.14) is obtained[15]:
𝜕 log 𝐷
𝜕 log[𝐴]b[c][d][e][B] = 𝑚 ∙ 𝑛ghi− 𝑚 ∙ 𝑛kl (1.14)
Where m·norg and m·naq are the metal:ligand ratio in the respective phases. The subscript indicates
other parameters that are held constant. [M], [H], [X], [S], refer respectively to the metal, hydrogen ion, background electrolyte, and diluent. While it is commonly assumed that the number of ligands per central atom is a whole number (indicating a fixed stoichiometry), in 1941 Bjerrum presented the concept of average ligand number, defined as the mean number of ligands per central
atom[14].
𝑛ghi
:::::: = ∑ 𝑛[𝑀𝐴::::::]n
It has been also be shown that the n can be substituted by 𝑛: in equation (1.16) so it can be redefined
as[9],[15]:
𝜕 log 𝐷
𝜕 log[𝐴]b[c][d][e][B] = 𝑛:::::: − 𝑛ghi ::::: kl (1.16)
Similarly, equation (1.17) defines the average metal number per complex:
𝜕 log 𝐷
𝜕 log[𝑀]b[o][d][e][B] = 𝑚::::::: − 𝑚ghi ::::::: klp (1.17)
and equation (1.18) defines the average number of hydrogen ions per metal complex:
𝜕 log 𝐷
𝜕 log[𝐻]b[o][c][e][B]= ℎ:::::: − ℎghi :::::: klp (1.18)
In the case of the extraction of a metal cation by a weak acid (e.g. Example 4: Extraction of Al(III)
by TTA[13]), equation (1.18) will give a negative result, indicating the number of protons needed
to exchange to achieve a charge balance between the extracted metal and the weak acid to extract
a neutral species[15].
Graphic Slope Analysis:
The graphic slope analysis (GSA) method is the most common analytical plot used to characterize a solvent extraction system. If used correctly it can give multiple types of critical information on an extraction system, such as the average ligand number and the coefficient of extraction.
For a rational application of the GSA, it is important to measure the distribution ratio of the analyte with one variable component with the concentration of all other components of the system being kept constant. By this method, the solvent extraction equation can be expressed into a polynomial of type:
𝑦 = 𝑎t+ u 𝑎v𝑥v
(1.19)
where y is a function of the distribution ratio of the analyte and x is a function of the variable for the graphic analysis.
Example 5: Utilization of a GSA in a system humic and fulvic acids with Th(IV)[16]
In a study probing the interaction of humic and fulvic acids with Th(IV) using solvent extraction by HDEHP, Nash and Choppin characterized their system with GSA using a second order polynomial:
𝐷
𝐷t− 1 = 𝑎𝛽$(𝑍) + 𝑏0𝛽{(𝑍)0 (1.20)
with y being the ratio of D over D0 minus 1, D0 being the distribution ratio of thorium in
absence of aqueous carboxylate, a and b fitting parameters, bx and by respectively the
researched stability constants for 1:1 binding site and a 1:2 binding site, and Z the total carboxylate binding sites.
However, when the expression can be expressed in a simple linear plot where i=1,
(y = a0 + a1·x) from the plot of y vs. x the intercept on the x axis yields the a0 parameter and the
slope yields the a1 parameter. This treatment method can be referred as the limiting value method.
However, in a more general case, this method also called linear slope graphic analysis.[1]
Example 6: Simple linear slope graphic analysis: extraction of Cu(II) by TTA[9],[17]
In the Figure 1-7, Liljenzin et al. used acetylacetonate to extract divalent copper from 1 mol.L-1 perchlorate media as function of pH and free extractant. The following equilibrium
is the accepted solvent extraction mechanism which is based on the charge balance and the coordination of Cu(II):
Cu0H+ 2 HTTA ::::::::: ⇌ Cu(TTA) 0
::::::::::::: + 2 HH (1.21)
However, in the case an investigative study of this mechanism the previous equilibrium need to be demonstrated. Here the oxidation state is unknown:
Cu}H+ n HTTA ::::::::: ⇌ Cu(TTA) }
::::::::::::: + n HH (1.22)
To solve for this equilibrium, it is assumed that TTA cannot self-adduct (create an oligomer composed exclusively of multiple molecules of TTA) based on the stereochemistry of Cu(II), the coordinative atoms (O-, O:), the number of acidic group (1) and the chelate ring
size (6, Cu-O-C=C-C=O:-Cu). In Figure 1-7 the logarithm of the distribution ratio of copper (DCu) has been plotted versus the pH at equilibrium at constant [HTTA] (large plot) and, in the insert plot, the logarithm of the free ligand at constant pH. In Figure 1-7, it can be seen that log DCu is a function of pH at constant F[HA], while at constant pH the log DCu
depends only on F[HA]. Here the notation F[HA] is used, since free TTA is distributed between the organic phase and the aqueous phase. It is evident that the distribution curve approaches two asymptotes, one horizontal (zero slope) and one different from 0 (in the low pH and the high –log [A] range). In the case of a linear slope analysis, the non-zero asymptote is the most relevant, because it gives crucial information on the stoichiometry of the extraction process.
Figure 1-7. Extraction of Cu(II) from 1 mol.L-1 NaClO
4 into benzene
as a function of pH (large figure) and of free acetylacetonate ion concentration (insert) at several formal concentrations of acetylacetone. Figure from ref [17]
Using equation (1.18), the asymptote at the low pH on the dependency (regardless of the F[HA]), the number of protons exchanged for the extraction is determined to be 2, and using
the equation (1.16) on the ligand dependence the number of chelating ligands is determined to also be 2. Using equilibrium (1.22) and those two parameters the equilibrium (1.21) can
Then using this equilibrium the following extraction equilibrium can be determined.
𝐾#$= [𝐶𝑢(𝑇𝑇𝐴)0][𝐻 H]0
[𝐶𝑢][𝐻𝑇𝑇𝐴]0 (1.23)
Using equation (1.3) to simplify the equation (1.23) the following equation can be determined:
𝐾#$= 𝐷‚p [𝐻H]0
[𝐻𝑇𝑇𝐴]0 (1.24)
Analytical Determination of Distribution Ratios.
In the previous section, the role of the distribution ratio of the analyte has been shown to be crucial
for the determination of the coefficient of extraction Kex. Today a large number of methods of
measuring distribution coefficients has been developed, and this number is more likely going to increase over time (based on the creativity of the solvent extraction community). In addition, even if there are multiple distribution ratio determination methods, there are some that are most commonly used.
Spectrophotometric Determinations
Spectrophotometric determination of distribution ratios is a commonly used method. Spectrophotometric determination of concentration (and thereby distribution ratios) has the main advantage of being readily accessible and generally accepted. Unfortunately, only a few analytes are capable of absorbing light in the UV-Vis region, with a large enough coefficient of extinction. For that reason a number of the spectrophotometric methods use a color forming reagent, such as
Azo dyes, using an azo link between two aromatic rings possessing an o-hydroxy group. The most commonly used dye is Arsenazo III , which offers a high sensitivity for the majority of transition metals and f-elements.
Figure 1-8. Picture of a solution of Arsenazo III in absence of
metal (left) and the same solution in presence of Eu(NO)3
Proper calibration methods allow for the creation of equation (1.25).
𝐼 = 𝐼t+ 𝑚[𝑆]„…kn†kh† (1.25)
where I0 and m are calibration parameters determined in one specific medium. If the concentration
of analyte is directly measurable, the distribution ratio can be determined using equation (1.26):
𝐷 =[𝑆̅] [𝑆] = (𝐼̅ − 𝐼O)t 𝑚O × 𝑚 (𝐼 − 𝐼t) (1.26)
The main disadvantage of equation (1.26) for the spectrophotometric determinations of D is that to obtain the organic calibration parameters, calibration standard, for the diluent used, must be
available and generally accepted. A common solution to this problem could be to strip the analyte from the organic phase to an aqueous phase (back extraction), and then to analyze it. This method only works if it is possible to establish a complete back extraction of the analyte, including possible dilution effects. If such standard and back extractions are too complicated, a simpler method is possible based on assuming mass balance. Providing that no third phase is created during the extraction process, the following equation is true:
[𝑆̅]#l = [𝑆]vnv…vkˆ− [𝑆]#l (1.27)
where [𝑆̅]#l and [𝑆]#l are respectively the concentration of analyte in the organic and aqueous
phase at equilibrium, and [𝑆]vnv…vkˆ the concentration of analyte in the aqueous phase before
extraction. Equation (1.27) can be used to define the distribution ratio, D as follows,
𝐷 =[𝑆]vnv…vkˆ− [𝑆]#l
[𝑆]#l (1.28)
or, as written in terms of absorption intensity:
𝐷 = 𝐼vnv…vkˆ− 𝐼#l
𝐼#l (1.29)
This expression is independent of any calibration as long as the intensity of the signal is above the limit of detection and below the saturation.
Flame, Inductively Coupled Plasma, Spectroscopy
These techniques are atomic spectroscopy, which means that the analyte is atomized by combustion with a flame or a plasma. Due to the atomization process (all molecular species are decomposed into atoms, and sometimes a change also in the oxidation state). Atomic spectrophotometry is particularly used for the determination of metal concentration. In principle, these techniques are extremely similar to the spectrophotometric determination for the determination of D, permitting the utilization of the equation (1.29) in most of the cases, although some research groups decide to calibrate their system for the analyte and to use equation (1.26).
Mass Spectrometry
Regardless of the ionization and mass measurement process, mass spectrometry (MS) is a relatively versatile analytical method. It has long been used to measure isotopes, decipher organic structures, and even determine microorganism identification. For SX of metal chelates, the most common utilization is the measure the mass of ions using coupled ICP-MS. The utilization of a high resolution MS adds the option to take into account the isotopic ratio of the cations studied. For example, silver possesses two naturally occurring isotopes with a difference of isotopic masses of 2 Da. If the resolution of the MS is not high enough, one of the isotope of silver could be easily confounded with another element. If the instrument is used to its best potential, ICP-MS enables simultaneous study of a large number of metal distribution ratios in a single experiment. The determination of D for MS is usually done using equation (1.29).
Radiometric Analysis
1.3.4.1 The Use of Radioactivity
The radiometric determination of a distribution ratio is most likely the most common method used by radiochemists around the world. This method uses the proportionality between the concentration of radioactive analyte (RA) and the radioactivity of the solution – equation (1.30).
[𝑅𝐴] ∝𝑅
𝑉 (1.30)
where R is the radioactivity in Bq of the analyte, and V the volume of solution. Knowing the equation (1.30), and analyzing equal volume samples of each phase, the following equation is true:
𝐷 = [𝑅𝐴::::]
[𝑅𝐴]=
𝑅:
𝑅 (1.31)
One challenge in the utilization of the radiometric method is the choice of the appropriate detection method. The easiest method is the detection of gamma rays (if gamma rays are emitted). With the assumption that the difference in the linear energy absorption of gamma ray is negligible between an organic phase and an aqueous phase, the following equation can be used:
𝐷 = 𝐴̅
𝐴 (1.32)
where A is the measured signal of a gamma ray of a specific energy per aliquot of phase (in Bq/mL). The utilization of high-resolution gamma spectrometers allow the analysis of a large number of gamma emitter at the same time - Figure 1-9.
Figure 1-9. Self-cooled high precision gamma counting instrument, left instrument closed for analysis, right instrument open for sample changing.
For the analyses of beta emitters, a direct measure of the A is not always possible, due to the fast loss of energy of a beta particle. To simplify the measurement of beta activity, the analyte can be diluted into a scintillation liquid, converting the energy of the beta decay into light.
Unfortunately, this process does not work for all systems, such as when the radioactive analyte is solvated in aromatic and chlorinated diluents, where the signal is strongly quenched by the diluent. To counter this effect, equation (1.29) can be used to measure the distribution ratio.
1.3.4.2 Neutron Activation Analysis
Neutron Activation Analysis (NNA) is one of the most commonly used method by radiochemists. This is a nuclear process used for determining the concentrations of elements in a vast amount of materials. NAA allows discrete sampling of elements as it disregards the chemical form of a
sample, and focuses solely on its nucleus. The method is based on neutron activation and therefore requires a source of neutrons.
The main difficulty of NAA is access to a neutron reactor, and the useful neutron cross section of analyte.
Research Focus
The Acidic Organophosphorus Extractant HEH[EHP]
Solvent extraction has generally been the method of choice for the purification of metals,
regardless of their utilization, from transition metals (such as copper[18], cobalt, nickel[19], etc), rare
earth elements[2],[20], even hazardous metal such as actinides and other radioactive materials[21],[22].
As stated previously in section 1.1.1, solvent extractions / separations are based on the difference in solubility of chemical species dissolved in each phase of a biphasic (liquid-liquid) system. However, metal electrolytes (ions) are not soluble by themselves in a non-aqueous phase due to the poor solvating ability of the organic solvent for charged species. Therefore, they cannot be extracted without the help of lipophilic complexing agent called an extractant. IUPAC describes the extractant as the active component(s) primarily responsible for transfer of a solute from one
phase to the other.[23] Most modern extractants are amphiphilic molecules, due to their increased
extraction efficiency[24]. However extractants that can distribute between each phase are still
frequently used.
The variety of extractants commercially available is extremely large, and a significant portion of them are used for the purification of metallic cations. The organophosphorus extractant family is one of the major families of extractants used in research and at industrial scale.
Organophosphorus compounds, both acid and neutral, provide a versatile range of solvent extraction, either as a primary extractant or as a synergetic agent. In the 1950s, it was recognized that the radiolysis/hydrolysis products of tributyl phosphate (TBP) mono and dibutyl phosphoric
acids were very effective extractant for the hexavalent uranium.[25]
Figure 1-10. Structures of tributyl phosphate (a) dibutyl phosphoric acid (b) and monobutyl phosphoric acid (c)
(RO)UPO + nHH
•+Ž••‘’,•,/*’Ž••‘’,•,
“⎯⎯⎯⎯⎯⎯⎯⎯⎯⎯⎯⎯⎯⎯⎯• (RO)U?}PO(OH)}+ nRH (1.33)
UO00H+ 2 (RO)0PO(OH) ⇌ UO0((O)OP(OR)0)0+ 2HH (1.34)
Acidic organophosphorus extractants extract metals by cation exchange (see section 1.1.2.2, page 7) of enough acidic hydrogen ions of the extractant(s) to allow the extraction of an electroneutral complex of the metal ion. Unlike the large majority of the other acidic extractants, which do not associate molecularly in non-polar media, acidic organophosphorus extractants have a strong tendency toward association into dimer in the non-polar organic phase. Also it is common for the
metal extractant complex MAz to get solvated by one or more additional extractant molecule HA
P O O O O P O O O OH P O O OH OH
a
b
c
(degree of solvation), MAz(HA)y. The nomenclature of the acidic organophosphorus extractant
can be extremely confusing between sources. Without attempting to favor any of them,
Table 1-1 is a non-exhaustive list of the most common acidic organophosphorus compounds.
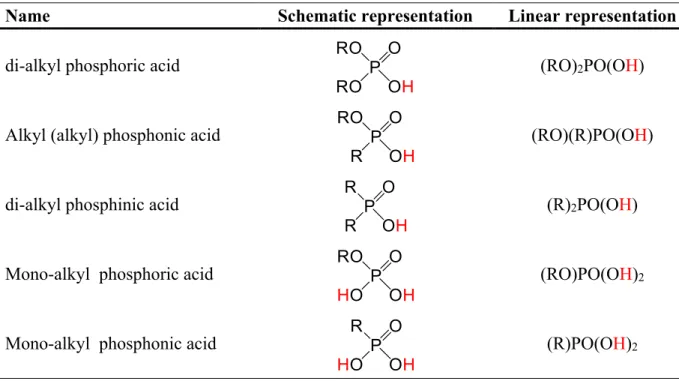
Table 1-1. Acidic organophosphorus extractant compound
Name Schematic representation Linear representation
di-alkyl phosphoric acid (RO)2PO(OH)
Alkyl (alkyl) phosphonic acid (RO)(R)PO(OH)
di-alkyl phosphinic acid (R)2PO(OH)
Mono-alkyl phosphoric acid (RO)PO(OH)2
Mono-alkyl phosphonic acid (R)PO(OH)2
Over the last 70 years these acidic organophosphorus extractants have been intensively studied,
with different phosphorus groups, alkyl chains[26] (symmetric and asymmetric), salting conditions,
extracted cation, etc.[27],[28] In the last 60 years, the TALSPEAK process ((Trivalent Actinide
Lanthanide Separation by Phosphorus reagent Extraction from Aqueous Komplexes), developed
in the 60’s at Oak Ridge National Laboratory[29], has been heavily studied and improved with the
objective of separating trivalent actinides from the trivalent lanthanides. This process is based on the partitioning of lanthanides and actinides between an di-alkyl phosphoric acid, HDEHP (bis-2-ethyl(hexyl) phosphoric acid - Figure 1-11a) solution and an aqueous phase containing a
polyaminopolycarboxylate complexant. The latter reagent is principally responsible for holding back the trivalent actinides, allowing the selective transfer of the lanthanides into the organic
phase.[30]–[33] In the last decade, an advanced TALSPEAK process has been suggested, proposing
to replace HDEHP with a less acidic but structurally analogous extractant alkyl(alkyl)phosphonic
acid HEH[EHP] (2-ethyl(hexyl)phosphoric acid mono-2-ethyl(hexyl) ester - Figure 1-11b)[34].
Different arguments on the use of HEH[EHP] vs. HDEHP have been made, focusing on the green
chemistry aspect of the use of less acidic extractant.[35]
Figure 1-11. Chemical structure of (a) Bis-2-ethyl(hexyl) phosphoric acid (HDEHP) and (b) 2-Ethyl(hexyl)phosphoric acid mono-2-ethyl(hexyl)
ester. pKa values from ref [35]
The use of HEH[EHP] in SX system allow for work in less acidic conditions allowing the use of other buffer and aqueous complexants and increasing the predictability of SX processes. While a reasonable amount of information on the aqueous chemistry exists of SX using HEH[EHP], very
analytical methods and techniques able to probe molecular interactions in this phase. Furthermore, even less information is available on the role of the diluent in the SX process using HEH[EHP].
The generally accepted equilibrium of SX of metal cation by HEH[EHP] is described as follows:
M}H+ n(HA)
0 ⇌ M(AHA)}+ nHH (1.35)]
with the following extraction equilibrium constant
𝐾#$ = [𝑀(𝐴𝐻𝐴)n][𝐻H]n
[𝑀nH][(𝐻𝐴)
0]n (1.36)
Using equation (1.3), equation (1.36) can be simplified to:
𝐾#$ = 𝐷 — [𝐻H]
[(𝐻𝐴)0]˜
n
(1.37)
Figure 1-12. Accepted schematic diagram of equilibria in extraction of cation (M) by HEH[EHP] (HA) based on literature equilibria
Following this mechanism, and accepting that HEH[EHP] complexes with metal cation as
described in the literature[9],[34],[2] - Figure 1-13 – the metal chelate is formed through two basic
atoms O- and Ӧ:, with a ring size of 7 atoms, metal excluded (M-O-P=O:--H-O-P=O:--M).
Figure 1-13. Accepted structure of the metal chelate formed between a metal cation of charge n and n dimers ref [9]- appendix D
However, it should be emphasized, that it has been demonstrated that for similar mono acidic
organophosphorus extractant (such has di-butyl phosphate and di-octyl phosphate, etc), the Kex,
the average ligand number (also called degree of polymerization, degree of solvation, average stoichiometry, etc), and the degree of dimerization of the free extractant are sensitive to various
experimental parameters[27],[28],[36]:
• Organic diluent,
• pH of the aqueous solution,
• ionic strength of the aqueous solution, • Background electrolyte used,
• Extractant used, • Cation extracted , • Etc.
In the past, it has been hypothesized that the main reason for the deviation from the ideal behavior (Figure 1-13) lies in the particular state of solvation of these extractants (are they completely
solvated, dimerized, polymerized, complexed, etc.).[10]
For the purpose of the presented work, the focus is going to be extended to the effect of the organic
diluent on the solvent extraction process of trivalent f-elements by HEH[EHP] and HDEHP.
The Diluent effect
The alchemist’s research for a “Menstruum universal” (universal solvent) indicates the importance given to the diluent and the process of solubility in a larger scheme, with the development of the popular “Similia Similibus Solvuntur” (similar solubilizes similars). Diluents are liquids, under the conditions of this application, in which other substance can be solvated (hydrated if the diluent is
water). In the case of SX, the diluent refers exclusively the non-aqueous phase (organic or ionic
liquid).
As stated in section 1.4.2, the SX process can be strongly impacted by the diluent itself. Regarding understanding of the SX processes, the development of our knowledge on the diluent effect reflects, to some extent, to development of the solvent extraction chemistry itself.
A large variety of liquids (condensed fluids) can be used in solvent extraction. They are usually
divided, in the context of SX, into different classes[37]:
• Class 1: Liquids capable of forming three-dimensional networks of strong hydrogen bonds.
• Class 2: Liquids with both active hydrogen atoms and donor atoms (oxygen, nitrogen, and fluorine) but that cannot create a three dimensional network. They are generally called protic and protogenic substances.
Eg. Primary alcohols, carboxylic acids, primary and secondary amines, nitro compound with α-positioned hydrogen atoms, condensed ammonia etc.
• Class 3: Liquids containing donor atoms without hydrogen donor atoms. They are generally called dipolar aprotic substance.
Eg. Ether, ketone, aldehydes, esters, ternary amines, nitro compounds without α-hydrogen, phosphoryl group containing solvent etc.
• Class 4: Liquids composed of molecules containing active hydrogen atoms, but no donor atoms.
e.g. Chloroform, dichloromethane, etc.
• Class 5: Liquids with no hydrogen-bond forming capability and no donor atoms. This class can be also subdivided into two sub category
o Class 5.1: Aliphatic liquids. They are in general open chains (linear or branched) hydrocarbons, but can also possess one or multiple non-aromatic cycles.
e.g. Ethenes, paraffins, etc.
o Class 5.2: Aromatic liquids: they are in general liquid that verify the Hückel’s rule of aromaticity.
In solvent extraction, only classes 3 to 5 are used as diluent, since they are generally insoluble in aqueous media. The classes 4 and 5 do not solvate any salt without the help of extractants, however it has been shown that class 3 can also act as an extractant by itself, without the need of additional extractants.
Other varieties of classification of diluents has been described in the literature, but the previously described have been found the most relevant to this work. Some other ones are commonly used and cited below, and will be used later in this work. The Reichardt 2003 solvent classification
scheme[38] (Table 1-2) is mostly based on the structure of the diluent
.Table 1-2. Reichardt 2003 solvent classification scheme
Designation Examples
i Non-polar Hexane, tetra chloromethane, cyclohexane
ii low polarity Toluene, chloroform
iii Aprotic dipolar Acetone, ketones, octanal
iv Protic and protogenic Ethanol, octanol, nitro-alkals
v Basic Pyridine, polyaminoethane
vi Acidic 3-methylphenol, butanoic acid
The classification of Kolthoff [39] and Reichardt[38] is according to the polarity (described by the
physical bulk properties of the diluent as media, the dielectric constant ε and the dipole moment
Table 1-3. Kolthoff and Reichardt solvent classification scheme
Designation ε μ ETN Examples
i Apolar aprotic <15 <8.3 0.0-0.3 n-octane, bromo-octane, etc.
ii Weakly polar aprotic <15 <9.3 0.0-0.3 Ethers, esters, etc.
iii Dipolar aprotic >15 8.3 0.3-0.5 Ketone, nitro, sulfoxide, etc.
iv protic 0.5-1.0 Water, alcohol, acids, etc.
The last one, the Chastrette classification[40], stresses the hydrogen bonding and electron pair
donation abilities, polarity and the self-association.
Table 1-4. Chastrette solvent classification scheme
Solvent class Examples
i Apolar, aprotric n-octane, carbone tetra halide
ii Apolar, aprotic, electron pair donors Amines, ether
iii Slightly polar, aprotic, aromatic Halogeno-benzenes
iv Apolar, aprotic, aromatic Benzene, substituted aromatic hydrocarbon
v Aprotic dipolar Nitromethane, acetone, ketone
vi Highly polar aprotic Dimethyl sulfoxide, nitrobenzene
vii Highly polar, polarizable aprotic Hexamethyl phosphoamine, sulfolane
viii Hydrogen bonding Alchohol, phenol.
ix Highly associated hydrogen bonding Water, ethylene glycol
1.4.2.1 Basic diluent properties: the intermolecular forces
The existence of these diluents as liquids at room temperature is the result of cohesive forces between molecules. The lowest cohesive force for a diluent (diluent class 5.1 and 5.2) is the
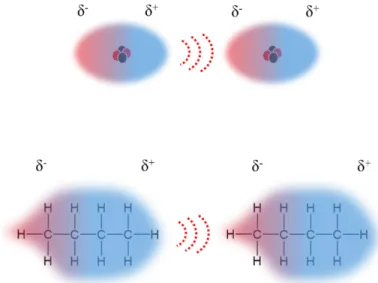
London dispersion (also called dispersive force). The motions of the electrons in the atoms of the
molecule induce a transient electric dipole in a neighboring molecule, which in turn strengthens the temporary dipole in the first molecule. This mutual interaction produces an attractive cohesive force. The class 5.1 and class 5.2 diluents are hold together in a condensed phase by such forces.
Figure 1-14. Schematic representation of the London dispersion. Top for a monatomic particle, bottom for a hydrocarbon
Polar liquids (characterized by the presence of at least one permanent dipole moment) can spontaneously “arrange” in a head to tail configuration, driven by a dipole-dipole interaction (the localized positive charge of one dipole orients toward the negative charge of the neighboring molecule). This association results in a larger attraction force than the London dispersion. The energy associated with this force is proportional to the product of the dipole moment of the molecule and inversely proportional to the sixth power of the mean distance between them.
![Table 1-7. Thermodynamic data involving HDBP, distribution [49] K d and extraction data of metal chelate [27], K ex from 0.1 mol·L -1 (Na-H)NO 3 into various diluents](https://thumb-eu.123doks.com/thumbv2/123doknet/14669604.741413/59.918.118.808.364.632/table-thermodynamic-involving-distribution-extraction-chelate-various-diluents.webp)