RESEARCH OUTPUTS / RÉSULTATS DE RECHERCHE
Author(s) - Auteur(s) :
Publication date - Date de publication :
Permanent link - Permalien :
Rights / License - Licence de droit d’auteur :
Bibliothèque Universitaire Moretus Plantin
Institutional Repository - Research Portal
Dépôt Institutionnel - Portail de la Recherche
researchportal.unamur.be
University of Namur
Electrochemical Investigation of Nitinol/Tantalum Hybrid Surfaces Modified by Alkylphosphonic Self-Assembled Monolayers
Maho, Anthony; Kanoufi, Frédéric; Combellas, Catherine; Delhalle, Joseph; Mekhalif, Zineb Published in: Electrochimica Acta DOI: 10.1016/j.electacta.2013.11.008 Publication date: 2014 Document Version
Peer reviewed version
Link to publication
Citation for pulished version (HARVARD):
Maho, A, Kanoufi, F, Combellas, C, Delhalle, J & Mekhalif, Z 2014, 'Electrochemical Investigation of
Nitinol/Tantalum Hybrid Surfaces Modified by Alkylphosphonic Self-Assembled Monolayers', Electrochimica
Acta, vol. 116, pp. 78-88. https://doi.org/10.1016/j.electacta.2013.11.008
General rights
Copyright and moral rights for the publications made accessible in the public portal are retained by the authors and/or other copyright owners and it is a condition of accessing publications that users recognise and abide by the legal requirements associated with these rights. • Users may download and print one copy of any publication from the public portal for the purpose of private study or research. • You may not further distribute the material or use it for any profit-making activity or commercial gain
• You may freely distribute the URL identifying the publication in the public portal ?
Take down policy
If you believe that this document breaches copyright please contact us providing details, and we will remove access to the work immediately and investigate your claim.
1
Electrochemical Investigation of Nitinol/Tantalum Hybrid Surfaces
Modified by Alkylphosphonic Self-Assembled Monolayers
A. Mahoa,b, F. Kanoufic, C. Combellasc, J. Delhallea, Z. Mekhalifa,*
[a]
Laboratory of Chemistry and Electrochemistry of Surfaces, University of Namur (FUNDP), Rue de Bruxelles 61, B-5000 Namur, Belgium.
[b]
Fonds pour la Formation à la Recherche dans l’Industrie et dans l’Agriculture (FRIA), Rue d’Egmont 5, B-1000 Bruxelles, Belgium.
[c]
Physico-Chimie des Electrolytes, des Colloïdes et Sciences Analytiques, ESPCI ParisTech, CNRS UMR 7195, Rue Vauquelin 10, 75231 Paris Cedex 05, France.
Abstract
The surface characteristics of bare and modified nickel-titanium samples (NiTi) are investigated by spectroscopic, microscopic and electrochemical techniques. The successful electrodeposition of a tantalum coating on NiTi and the effective grafting of 1-dodecylphosphonic acid SAMs on both pristine and Ta-covered NiTi surfaces are evidenced and quantified by XPS and SEM. Cyclic voltammetry performed on the different NiTi-based electrodes highlights their specificities regarding electron transfer to a redox probe present in solution (here ruthenium(III) hexamine). Finally, the samples electrochemical characteristics at a local scale are investigated by scanning electrochemical microscopy (SECM). The impact of the surface modifications on mass transport of the redox probe is analyzed through approach curves in the feedback mode, while the recording of current maps in feedback as well as in substrate-generation/tip-collection modes leads to the qualitative identification of electrochemically-active areas corresponding to precursor pitting corrosion sites.
Keywords
Nickel-titanium; tantalum electrodeposition; 1-dodecylphosphonic acid self-assembled monolayers; charge transfer; scanning electrochemical microscopy.
Corresponding author
* Prof. Zineb Mekhalif, Laboratory of Chemistry and Electrochemistry of Surfaces, University of Namur, Rue de Bruxelles 61, B-5000 Namur, Belgium. Tel.: +32 (0)81 72 52 30. Fax: +32
(0)81 72 46 00. E-mail: [email protected]
2
1. Introduction
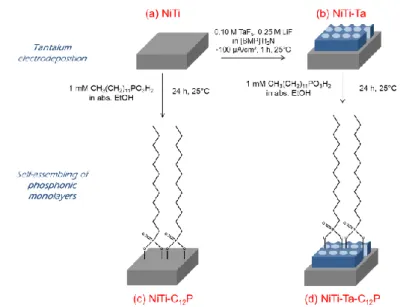
The Nitinol alloy (NiTi, made of Ni and Ti in quasi equiatomic proportions) is well known for its excellent shape memory and superelasticity properties. It has captured attention as a basic material for usual and high technology devices, and also in the fields of medical instruments (surgical pliers, dental floss, endoscopes, …) and implants (dental, orthopedic, cardiovascular, …). In this framework, many researches are pursued towards the reduction of the immune response induced by the high nickel content, notably through the generation of a protective and biocompatible interface between the biomaterial and the human body [1-4]. The approach in several previous works consists of the elaboration on the NiTi surface of a thin tantalum (Ta) layer, a metal which is recognized for its excellent biocompatibility and bioactivity, its radio-opacity and its strong propensity to withstand corrosion processes [5-7]. Among the different chemical methodologies, which can be exploited for this purpose, electrodeposition in ionic liquids constitutes a technique of choice, notably for the control of the thickness of the prepared deposit and its highly accurate structuration [8-11]. A previous paper has highlighted and discussed the intrinsic nanoporous nature of the thin Ta deposit on the NiTi plates [11]. This hollowed morphology implies a possible contact between the extreme surface of the underlying NiTi substrate and the ambient atmosphere through the pores in the Ta film. In this perspective, a further modification of these surfaces by self-assembling of alkylphosphonic acid molecules, well known for their robust grafting on oxide-covered metals, has the potential to constitute a reinforced barrier layer against the aggressive environment. It also opens a wide range of interactions between the substrate and the external medium through a smart selection of the terminal functionality of the alkyl chain [12-17]. Such hybrid inorganic/organic surface films can thus create a fully protective layer on NiTi, but they are also acknowledged as beneficial contributors for a synergetic improvement of the global bioactivity of the platforms [9].
The recent study of the electrodeposition in an ionic liquid solution of a pristine Ta layer on NiTi plates was focusing on the chemical composition and the morphological features of these surfaces, mainly characterized through spectroscopic (X-ray photoelectron spectroscopy, XPS) and microscopic (scanning electron microscopy, SEM) techniques [11]. Another important fundamental consideration concerns the understanding and control of the electrochemical characteristics of such materials, especially with the perspective of evaluating their protective ability towards corrosion phenomena in biological environments. NiTi, as a platform material, has been the object of numerous related studies in the literature, whether as a native substrate, after surface treatment (polishing, heat treatment, ion implantation, …) or modified by organic and inorganic coatings (self-assembled monolayers – SAMs –, metallic, ceramic or polymer films, …) [2-4,16-26]. Most of the experimental characterizations concerning the corrosion resistance of the materials are pursued through polarization curves (or linear sweep voltammetry), cyclic voltammetry (CV) and electrochemical impedance spectroscopy, all of which focus on global scale observations. Developed during the late 80s by Bard’s team, the scanning electrochemical
3
microscopy (SECM) technique has rapidly emerged as a highly promising and useful method to investigate the electrochemical and morphological characteristics of surfaces and interfaces at a more local scale (typically micrometric). Many topics are still investigated through SECM experiments, from classical surface technologies (SAMs, polymer coatings, membranes, nanostructures, electrodes, fuel cells, …) to biological and medical fields (sensors, enzymes, living cells and tissues, DNA, …) [27-32]. SECM can also be considered as a valuable tool for the local electrochemical characterization of thin passive oxide(s) layers covering numbers of metals and alloys. Several research groups have focused their interest on the behavior of the oxide films covering substrates such as Ti and alloys [33-41], Ta [42,43], Al [44], Fe and alloys [44,45], Zn [45], Ni [46], Cu [47], ITO [48], etc. Among them, White and co-workers specifically managed to highlight the presence of characteristic
“electrochemically-active areas” on different surfaces – notably TiO2 and Ta2O5 –
corresponding to pitting [corrosion] precursor sites [33-37,42,43]. Those studies can thus be considered here in the perspective of investigating metallic electrodeposits and/or SAMs on solid surfaces, and more precisely for the characterization of titanium- and tantalum-based substrates.
Here, XPS, SEM, CV and SECM characterization techniques are used to evaluate the proper structural features of NiTi-based electrodes and assess their relative behavior towards electrochemical processes with reactive species in solution, notably in the framework of corrosion phenomena. Specifically, bare NiTi samples as well as substrates modified by tantalum and phosphonic acids (separately or additionally) are considered hereafter.
2. Experimental
2.1. Products and reagents
The following chemicals and solvents are handled without further purification for the pretreatment of the NiTi substrates and for the electrodeposition process of tantalum: absolute ethanol (VWR Prolabo), acetone (Chem-Lab, 99+%), ultra-pure water (18.2 MΩ cm), 1-butyl-1-methylpyrrolidinium bis(trifluoromethylsulfonyl)imide ionic liquid (99%), tantalum fluoride (Aldrich, 98%), lithium fluoride (Sigma-Aldrich, 99%). For the organic modification of the substrates, 1-dodecylphosphonic acid (95%) is supplied by Alfa Aesar. Products used for the electrochemical characterizations are ruthenium(III) hexamine trichloride (Aldrich, 98%) and potassium sulfate (Acros, 99+%).
2.2. Nitinol substrates preparation
NiTi rectangular coupons (20 x 10 x 0.3 mm³), purchased from AMF, are constituted of Ni (56%) and Ti (balance). They are first mechanically polished on a Buehler-Phoenix 4000 instrument using silicon carbide papers (P800, then P1200) and diamond pastes (9, 3, then 1 µm) from Struers. The NiTi plates are then cleaned in absolute ethanol under ultrasonication
4
for 15 min, submitted to UV-ozone for 30 min (Jelight 42-220), and finally ultrasonically treated in absolute ethanol for 15 other min, before being blown dry under nitrogen and stored for further use or analysis (Fig. 1a).
2.3. Tantalum electrodeposition on NiTi substrates.
The covering of the pretreated NiTi samples by an electrodeposited tantalum layer is performed in an argon-filled glove box (residual quantities of water and oxygen below 30 ppm) with an EG&G Princeton Applied Research, Potentiostat/Galvanostat Model 263A. The
electrolytic solution is constituted of 0.10 M TaF5 and 0.25 M LiF in the
1-butyl-1-methylpyrrolidinium bis(trifluoromethylsulfonyl)imide ionic liquid ((BMP)Tf2N). The
electrodeposition of Ta is processed under galvanostatic conditions at ambient temperature (25°C): a constant current of -100 µA/cm² is applied to the NiTi working electrode for 1 h versus a platinum foil acting as both reference and auxiliary electrodes. The modified samples are further post-treated by copious rinsing with acetone, immersed for 15 min in boiling water, then for 15 min in absolute ethanol under ultrasonication, blown dry under nitrogen and finally submitted to UV-ozone for 15 min (Fig. 1b) [9-11].
2.4. Self-assembling of 1-dodecylphosphonic acid
Organic modification of both pretreated NiTi (Fig. 1c) and Ta-covered NiTi (Fig. 1d) substrates is performed through their immersion in 10 mL of a 1 mM solution of
1-dodecylphosphonic acid (C12P) in absolute ethanol for 24 h at ambient temperature. The
samples are then copiously rinsed with absolute ethanol, blown dry under nitrogen and stored until analysis.
2.5. XPS characterization
XPS is used to assess the presence of the Ta electrodeposit and/or the C12P monolayer on
the NiTi substrates, and to qualitatively and quantitatively check the composition of the different surfaces. Spectra are recorded on a Thermo Scientific K-Alpha spectrometer and treated using the Thermo Avantage v5.27 software. The photoelectrons are excited using a
monochromatic Al K radiation as the excitation source, collected at = 0° with respect to
the surface normal and detected with a hemispherical analyzer. The spot size of the XPS source on the sample is 200 µm, and the analyzer is operated with a pass energy of 150 eV for survey spectra and 20 eV for accumulation spectra on core levels. Pressure is kept below
1 x 10⁻⁸ Torr during data collection and the binding energies (Eb) of the obtained peaks are
referenced to the C1s signal for C-H, set at 285.0 eV. Spectra are fitted using a Smart background and a linear combination of Gaussian and Lorentzian profiles in 70-30 proportions. Peak positions obtained after analysis are found essentially constant (0.3 eV). The different relative peak intensities and areas are finally measured on core levels spectra. Sensitivity factors used for the different atoms are: C1s 1.000, O1s 2.930, Ni2p 22.180,
5
and coverage values for tantalum and alkylphosphonic coatings are estimated from the collected XPS data. In all generality, the thickness of a layer material A deposited on a bulk material B can be obtained from the relative attenuation of the B element signal, which is quantified as:
(1)
where IB/IB,0 is the ratio of the bulk element B peak intensities (modified surface/bare
surface), dA the layer material A thickness, B,A the bulk material B photoelectrons mean free
path through layer material A, and the takeoff angle (here = 0°) [49,50].
2.6. SEM imaging
A JEOL 7500F scanning electron microscope is used to image the morphological and structural features of the NiTi-based surfaces.
2.7. Electrochemical analyses
2.7.1. Cyclic voltammetry
Prior to the SECM characterizations, the potential of the different NiTi substrates (pristine
and modified with Ta and/or C12P SAMs) is scanned at a rate of 20 mV/s within the -0.8 /+0.5
V/Ag-AgCl potential window, starting from 0 V/Ag-AgCl with a negative initial scan polarity. The obtained voltammograms provide a direct qualitative and quantitative assessment of
the blocking effect of the Ta electrodeposit and/or the C12P monolayer present on NiTi on
the electron transfer from the sample to Ru(NH3)63+. Briefly, the quantitative CV analysis
consists of extracting the apparent electron transfer rate constant, k°app, from the
voltammogram, which is done using semi-deconvolution analysis of the curves. For a quasi-reversible process, the variation of the electron transfer rate k with the potential E is given from the current i(E) by:
(2)
where Ilim is the diffusion limiting current of the sigmoidal convoluted current I(E), and D the
probe diffusion coefficient (D = 7.4 x 10⁻⁶ cm²/s for Ru(NH3)6Cl3 [40]). The extrapolation of
k(E) to E = E0 leads to k°app, with the E0 value being estimated to -0.19 V/Ag-AgCl from the
electrochemical response of an inert Pt electrode. This strategy allows for a pertinent
estimate of k°app for peak-shaped voltammograms without a precise knowledge of the
electrode surface area [31,32,51,52].
6
SECM is achieved with a CHI 900B (CH Instruments), using a three-electrode cell with a commercial Ag-AgCl reference electrode (CH Instruments, CHI111), a platinum wire as counter electrode, and a 10 µm diameter platinum microdisc ultramicroelectrode (UME), with an estimated RG ratio of 15, as the first working electrode (CH Instruments, CHI107). The NiTi-based sample is fixed to the bottom of the Teflon cell and acts as the second working electrode. Both potentials of the UME tip and the analyzed substrate can be controlled independently using a bipotentiostat. The working solution is composed of 5 mM
Ru(NH3)6Cl3 as the redox mediator and 0.1 M K2SO4 as the supporting electrolyte, in
ultra-pure water.
Analyses in the FB mode are completed in a 5 mM Ru(NH3)6Cl3 / 0.1 M K2SO4 working
solution according to the following scheme. First, the tip is moved down to the substrate at a
rate of 2 µm/s, and an approach curve is recorded: the UME is polarized (Etip) to -0.70
V/Ag-AgCl (to allow for the mass-transfer controlled reduction of Ru(NH3)63+ into Ru(NH3)62+), and
the substrate (Esubstrate) is left at open circuit potential (OCP). The approach is stopped when
a sharp change of the current occurs at the tip, as a result of a contact between the UME and the substrate surface (d = 0). The UME is then withdrawn by 10 µm, and the SECM FB imaging is carried out by scanning a 300 x 300 µm² area at a x,y-scan rate of 25 µm/s. During the whole duration of the imaging process, the substrate is kept at OCP while the tip remains
polarized at Etip = -0.70 V/Ag-AgCl.
2.7.3. SECM in the Substrate-Generation/Tip-Collection (SG-TC) mode: imaging
SECM maps obtained in the SG-TC mode are performed according to a similar procedure.
First, a typical approach curve is obtained in the FB mode (Etip = -0.70 V, Esubstrate = OCP) in
order to correctly position the tip, which is then removed of 10 µm from the substrate surface. At this point, the NiTi-based sample is polarized via the bipotentiostat at a value
that allows for the conversion of Ru(NH3)63+ into Ru(NH3)62+ in electrochemically-active sites
or regions. This value of Esubstrate is determined from the corresponding voltammogram
initially measured (Section 2.7.1.). Etip is set at +0.10 V/Ag-AgCl in order to collect the
Ru(NH3)62+ entities and convert them back into their initial Ru(NH3)63+ form. SECM SG-TC
imaging is then proceeded on 300 x 300 µm² areas at a x,y-scan rate of 25 µm/s.
3. Results and discussion
3.1. XPS
The qualitative and quantitative evaluation of the surface atomic composition of the different substrates is carried out by XPS. In particular, the tantalum covering rate after the electrodeposition and/or the quality of the grafting of 1-dodecylphosphonic acid monolayers, as well as the thickness of the two deposited layers, are assessed prior to any further characterization.
7
Survey spectra of NiTi, NiTi-C12P, NiTi-Ta and NiTi-Ta-C12P are shown in Fig. 2 (a, b, c and d,
respectively). Ni2p and Ti2p signals are present in each case, indicating the accessibility of
NiTi underlayer to photoelectrons for all substrates. The grafting of the C12P SAM is
confirmed on NiTi-C12P and NiTi-Ta-C12P by a significant increase of the C1s peak intensity
and the P2s and P2p signals (inserts on Fig. 2b and 2d), compared to the pristine NiTi sample. The characteristic core levels of Ta (notably Ta4p, Ta4d and Ta4f) are found on the NiTi-Ta
and NiTi-Ta-C12P spectra, proof of the electrodeposit on NiTi. A very slight residual fluorine
contamination (F1s signal), coming from chemical species contained in the electrodeposition bath, is also noticed for the latter two substrates.
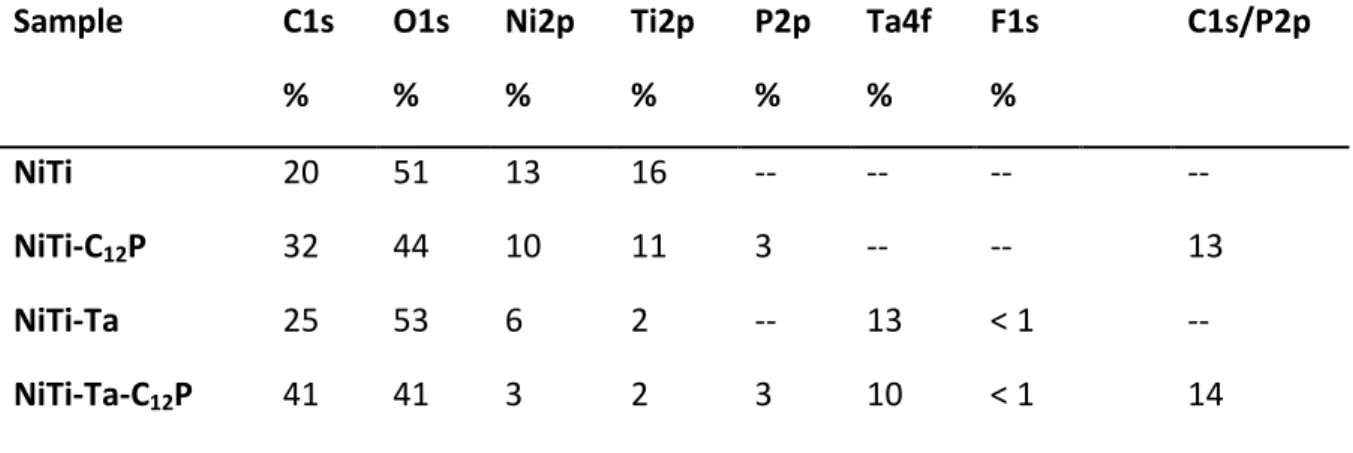
Table 1 reports the different elemental percentages and atomic ratios measured on the four samples. Interestingly, the ratio of Ti and Ni is evolving from a Ti majority on bare NiTi to a Ni excess after Ta modification. As mentioned in a previous study [11], this reversal can be
explained as a consequence of the Ta electrodeposition process. The F- ions contained in the
electrolytic solution (made of TaF5 and LiF) allow for the partial abrasion of Ni entities
present at the extreme surface. As this phenomenon occurs concurrently with the electrodeposition of Ta, a certain amount of nickel-containing species is trapped between the NiTi platform and the Ta layer in formation, which results in a larger quantity of Ni
detected by XPS [11]. Regarding the grafting of the C12P SAMs, its efficiency is confirmed out
of the C1s/P2p ratios for the NiTi-C12P and NiTi-Ta-C12P samples, since the experimental
values (13 and 14, respectively) stand quite close to the theoretical one (C1s/P2ptheor = 12).
The slight difference is due to the presence of few carbon contaminants inherent to the experimental protocol. These first XPS results highlight the presence of good quality Ta
electrodeposits and/or C12P SAMs on the NiTi samples.
Conceptual equations, based on the mean free path of the substrate-specific photoelectrons, have been proposed through the literature to estimate surface films thickness and coverage ratio, notably for oxide native overlayers and nanometric organic adlayers present on specific metallic substrates [49,50,53-57]. We propose here to
conceptualize the present experimental substrates NiTi-C12P and NiTi-Ta as simple cases of
an overlayer of material/element A on a substrate of material/element B. The thickness of the different layers is then calculated from the attenuation of the B material/element signal after the surface modification, according to Eq. (1). Since the Nitinol extreme surface is mainly constituted of titanium dioxide [53], the Ti2p signal is considered here for the quantification of the substrate photoelectrons attenuation after their passage through the
phosphonic or tantalum layer. For NiTi-Ta-C12P samples, the decrease of the Ta4f peak
intensity (in the Ta2O5 form) after the C12P treatment is examined for the calculation of the
SAM thickness. Photoelectron escape depth numeric values have been established from the
works of Cumpson and Seah by assimilating the C12P layer to a pure carbon matrix (density =
1.0 g/cm³) and the Ta deposit to a pure and homogeneous Ta2O5 film (density = 8.2 g/cm³)
8
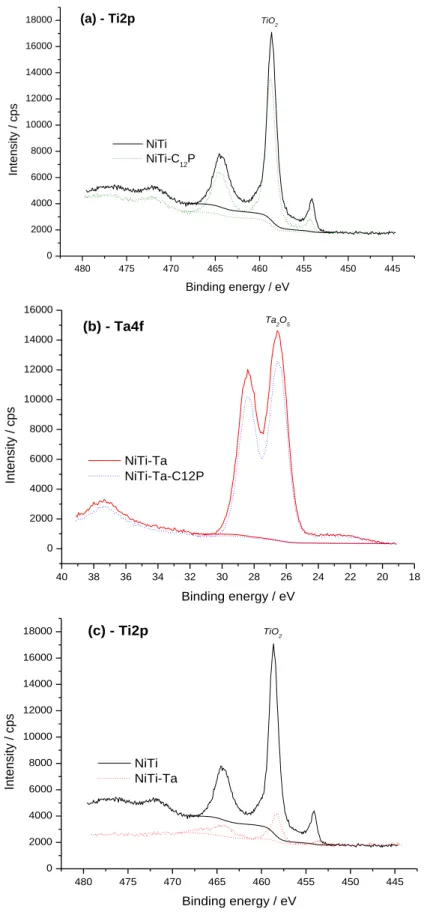
Peak intensity, mean free path and calculated thickness values are reported in Table 2. By
applying Eq. (1) to the Ti2p peak intensities recorded on both NiTi (bare substrate, IB,0) and
NiTi-C12P (modified substrate, IB) core level spectra (Fig. 3a), an average thickness value of
0.8 nm is obtained for the C12P layers on NiTi. In a similar way, the Ta4f signal (Fig. 3b)
inhibition is used to determine a thickness of 0.7 nm for the C12P films on Ta-covered NiTi
(with NiTi-Ta and NiTi-Ta-C12P acting here as bare and modified substrates, respectively).
Both thicknesses are of the same order. As the C12P molecule size equals approximately 1.2
nm, we can reckon a covering ratio by C12P of ~ 60% on both bare and Ta-modified NiTi. The
analysis is also made with Ti2p core levels on NiTi and NiTi-Ta samples (Fig. 3c), and results in
a 2.1 nm thickness for the Ta2O5 deposit on NiTi. With a ITiO2/ITiO2,0 value of 0.15 and a layer
thickness (2.1 nm) being inferior to the experimental mean free path (4.5 nm), we can
postulate a coverage by Ta2O5 on NiTi of ~ 85%.
This being said, the discussion and exploitation of those experimental thickness and covering rate values should be carried on with very deep caution due to the relative complexity of the presently considered interfaces, being atomically unsmooth and constituted of various forms
of nickel-titanium surface oxides and hydroxides, porous-nanostructured Ta2O5
electrodeposits and/or phosphonic acid monolayers. These results should thus be preferably regarded as a relatively rough estimate of experimental trends obtained from modeled thin interfaces. In this perspective, the electrochemical studies described in the following sections are well indicated to address those issues and achieve a more documented and complete discussion.
3.2. Cyclic voltammetry
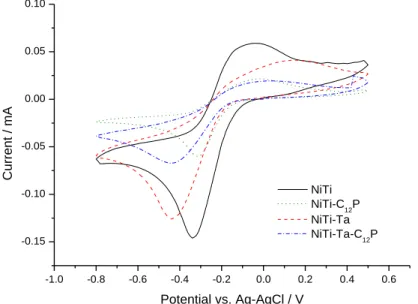
Fig. 4 presents the voltammograms of pristine and modified NiTi samples recorded in a 5
mM Ru(NH3)6Cl3 / 0.1 M K2SO4 solution, at a scan rate v of 20 mV/s. All substrates exhibit the
characteristic voltammogram of the Ru(NH3)63+ / Ru(NH3)62+ mediator system. The same
curves measured in “blank” solutions – containing only 0.1 M K2SO4 – display no
characteristic signal, which attests that only the electron transfer reaction at the mediator is occurring. Compared to the electrochemical response of an inert Pt electrode, only the
backward sweep showing the oxidation of electrogenerated Ru(NH3)62+ at Esubstrate > -0.2
V/Ag-AgCl is of poor quality. It may result from the oxidized form of the NiTi and NiTi-Ta
surfaces, most of the investigated surfaces being composed of TiO2 or Ta2O5 (cf. XPS analyses
in section 3.1). As already proposed for Ta/Ta2O5 surfaces [42], the incomplete reoxidation
of Ru(NH3)62+ at these large band-gap n-type semiconductors could be indicative of the
position of their conduction band edge, Ecb, which would be more negative than the formal
potential E0 of Ru(NH3)63+/2+. In the following, we thus consider specifically the cathodic peak
on the forward scan of the four samples, and significant differences are noticed at this level from one substrate to another (Table 3). In terms of current values, pristine NiTi and NiTi-Ta
exhibit intense peak currents ip of -0.146 and -0.126 mA (respectively) while those of
9
closely related to the presence of the C12P SAM. Considering the peak potentials, Ep, they are
rather shifted towards more cathodic values when the tantalum electrodeposit is present:
samples without Ta – NiTi and NiTi-C12P – present peak potentials of -0.34 and -0.31 V
(respectively), while values for samples with Ta – NiTi-Ta and NiTi-Ta-C12P – are 0.45 and
-0.44 V (respectively). From these observations, a Tafel analysis of the CVs gives access to
apparent standard electron transfer rate constants, k°app [31,32,51,52]. A clear distinction
appears between the effects of a covering by tantalum or by phosphonic acid molecules: the
electrodeposition of Ta considerably decreases the corresponding values of k°app (from 3.1 x
10-4 to 0.92 x 10⁻⁴ cm/s between NiTi and NiTi-Ta; from 2.9 x 10⁻⁴ to 0.87 x 10⁻⁴ cm/s between
NiTi-C12P and NiTi-Ta-C12P), while the grafting of a C12P monolayer has no significant effect
(3.1 and 2.9 x 10⁻⁴ cm/s for NiTi and NiTi-C12P, 0.92 and 0.87 x 10⁻⁴ cm/s for Ta and
NiTi-Ta-C12P).
Analogies can be established at this stage with model electrode surfaces partially covered by a coating, which blocks the electron transfer to the redox probe in solution. Within such model framework, electron transfer occurring on coated electrodes results from charge transfer within the imperfections or defects of the film. The observed electrochemical response can then be used to describe the size and density of the defects within the coating. Complete theoretical descriptions of such an issue have been proposed for various defects size, density, shape and distribution [52,58,59]. Briefly, small and sparse defects behave as independent micro/nanoelectrodes and the CV presents a steady-state sigmoidal response, while in the case of more dense networks, the interpenetration of the diffusion layers of each defect may occur and the peak-diffusion shape of the CV is restored [52,58]. Different situations can then arise, depending on the size of the defects. “Macroscopic” defects (of dimension > µm) result in the decrease of the peak current as an apparent decrease of the active part of the electrode [59]. For “microscopic” defects, with a sub-micrometric size, the diffusion-peak-shaped intensity is the same as that of the uncovered electrode, the electrode coverage then results in the apparent decrease of the electron transfer kinetics compared to the uncovered one [52]. Qualitatively, these situations fit the experimental
situations observed here and the C12P layer would form “macrosopic” defects while the Ta
layer “microscopic” ones. We then use the proposed models to depict the different kinds of coverage of NiTi electrodes.
First, it has already been shown that such a Ta electrodeposit on NiTi presented regular disk-shape nanometric pores, with an average diameter of 120 nm and an average edge-to-edge distance of 150 nm [11]. A SEM image of the dimpled layer is shown in Fig. 5. This configuration corresponds to the “microscopic” defects described in Amatore’s model [52]. The partial blocking of the NiTi electrode surface by the Ta electrodeposit should then
correspond to a decrease of the standard rate constant k°app proportionally to the covering
rate θTa of the sample by Ta, following the relation [52]:
10
where k°app(M) corresponds to the apparent electron transfer rate constant estimated at the
electrode M from semi-deconvolution of the CV (Section 2.7.1.) [31,32,51,52]. Then, a
covering rate, θTa, of ~ 70% is deduced from the experimental k°app values, where ~ 85% was
obtained from XPS quantification and ~ 50% from SEM views (Fig. 5) [11]. The model also states that, in ideal situations, the peak currents are not affected by the blocking of the electrode surface, which is observed here with values of -0.146 and -0.126 mA for NiTi and NiTi-Ta, respectively. The small current decrease observed after the coverage of NiTi by Ta actually corresponds to the theoretical peak current decrease associated to the decrease of
ET reversibility (decrease of k°app) when going from NiTi to NiTi-Ta.
At a scan rate of 100 mV/s (not shown), the CV still shows a diffusive peak-shape. It signifies that at this time range, the nanopores in the Ta layer behave as an array of interpenetrating nanoelectrodes characterized by a linear diffusion. This indicates that the characteristic
diffusion length explored by CV, = (DRT/Fv)1/2 (with D the redox probe diffusivity,
estimated to 7.4 x 10⁻⁶ cm²/s for Ru(NH3)6Cl3 [40]), approximately 15 µm, is more than 100
times larger than the average edge-to-edge length between two nanopores, R0. Indeed,
according to the kinetic zone diagram presented in ref. [52], deviation from diffusion
peak-shape voltammogram to sigmoidal steady-state one occurs for < 100 R0. This observation
fits with the general SEM picture (Fig. 5) where R0 = 150 nm [11]. As the morphological
nature of the Ta layer is known to be dependent on the electrodeposition duration [11], it would be of interest to further check and discuss the evolution of the ET reversibility and
k°app for thicker, denser and pores-filled Ta deposits obtained after longer preparation times (work in progress).
Concerning the surface modification with a C12P SAM, the model of Matsuda et al.,
concerning electrode surfaces with “macroscopic” inhomogeneities, is applicable here [59].
According to this model, the coverage of NiTi by the C12P monolayer should not affect the
electron transfer kinetics between the substrate and Ru(NH3)63+/ Ru(NH3)62+ ions present in
the solution (k°app). Only the current density parameter should vary from unmodified to
modified samples proportionally to the uncovered portion of the electrode: the higher the
covering rate by C12P (θC12P), the more important the decrease of the current peak intensity.
From the experimental values of charge densities Q, the θC12P values for NiTi-C12P and
NiTi-Ta-C12P are estimated to 68 and 41% (respectively), according to:
θC12P(NiTi-C12P) = (QNiTi - QNiTi-C12P) / QNiTi (4) θC12P(NiTi-Ta-C12P) = (QNiTi-Ta - QNiTi-Ta-C12P) / QNiTi-Ta (5)
Those values obviously evidence that the C12P SAM is not fully covering the surface of the
pristine NiTi and NiTi-Ta samples. In the case of NiTi surface the coverage is in good agreement with that obtained from XPS. In the case of the NiTi-Ta sample, already covered with a blocking layer of Ta, it has been shown that the electrode behaves as an array of interpenetrating nanoelectrodes. The surface coverage of 41% obtained in Eq. (5) should
11
correspond to the coverage of the electroactive part of the array of nanopores, that is
Ta-uncovered NiTi. From CV analysis, no indication on the coverage of the Ta layer by C12P is
obtained. However, it is clear from XPS analysis that C12P molecules are also present onto
the Ta layer (Fig. 2 and Table 1), and that the coverage by C12P is equivalent as well on bare
as on Ta-modified NiTi (globally 60%, out of XPS quantification, Fig. 3 and Table 2). The
incomplete coverage of the surfaces by C12P, with “macroscopic” defects, is probably related
to the experimental conditions selected for the grafting of the C12P film on the substrates.
Indeed, many studies have already discussed the crucial importance of parameters such as solvent, temperature, time, pH, and alkyl chain length for the preparation of dense and well-organized phosphonic acid monolayers [14,17,60-63]. The conditions defined here
correspond to a pragmatic grafting of the C12P molecules in the perspective of developing
prototype interfaces for advanced experimental protocols of electrochemical analyses on NiTi-based substrates.
3.3. SECM
The different surface modifications on NiTi samples were first investigated in the FB mode.
By comparison with the CV inspection, the mass transport of the Ru(NH3)62+ tip-generated
redox probe between the surface, the bulk solution and the Pt UME is investigated through FB approach curves. Recording of SECM FB and SG/TC images of the surfaces in solution of
Ru(NH3)63+ is then carried out and commented.
3.3.1. FB approach curves
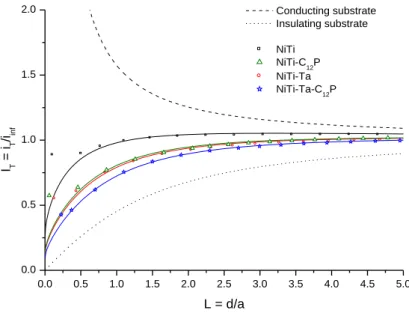
Normalized approach curves (normalized current iT/iT,0 vs. normalized tip position d/rT)
recorded in the FB mode are displayed in Fig. 6. The curves are fitted by general analytical expressions given for first-order heterogeneous finite kinetics at the sample surface with
respect to the Ru(NH3)62+ species electrogenerated at the tip. The fitting procedure consists
of comparing the experimental approach curves to analytical expressions[64,65] in order to
determine the apparent charge transfer rate constants, keff, describing the rate of
regeneration of Ru(NH3)63+ by the substrate. An increasing hindered diffusion of the
mediator is observed and quantified from NiTi (keff = 4.6 x 10⁻³ cm/s) to NiTi-Ta-C12P (1.1 x 10
-3
cm/s), with NiTi-C12P (1.9 x 10⁻³ cm/s) and NiTi-Ta (1.7 x 10⁻³ cm/s) standing close to each
other in an intermediary situation (Table 4). Those values point out that the combination of
a Ta electrodeposit with a C12P monolayer induces a sizeable blocking effect on the mass
transfer processes of the mediator all over the surface. Taken separately, the Ta and SAM modifications increase the trend compared to a pristine NiTi substrate, but slightly less than when they are both achieved.
Absolute and relative values obtained for keff after fitting the experimental approach curves
(Fig. 6 and Table 4) do not directly correspond to their k°app counterparts calculated out of
cyclic voltammograms (Fig. 4 and Table 3). In ideal cases, keff constants measured by SECM
12
Ru(NH3)62+) only limited by mass transfers between the substrate surface, the bulk solution
and the UME tip, while k°app determined out CV curves express a kinetic limitation effect by
the electron transfer. To correctly correlate both data sets, the comparison must concern
the experimental ratios of SECM first-order heterogeneous kinetics rate constants, keff, and
peak current intensities, ip, measured on voltammograms, reflecting mass-transfer
controlled processes (Tables 3 and 4). But the CVs examine the reductive process of the redox probe while the approach curves rather check the oxidative process, which makes the comparison difficult, owing to the poor quality of the backward oxidative scan. This probably results from the passivation of the NiTi-based electrode in this potential range, which does not lead to a current response of good quality. However, interesting changes in the mass
transfer regime have been detected from CV as the C12P grafting yielded the apparent
decrease of the electrode surface area due to the presence of “macroscopic” defects. The
SECM approach curves should also detect such variations and the decrease in keff observed
upon C12P grafting should follow the one observed in the peak currents decrease. The
correspondence is indeed well noted for NiTi and NiTi-C12P samples (ratios values of 2.5 for
keff and 2.4 for ip), and to a lesser extent for NiTi-Ta and NiTi-Ta-C12P (1.5 for keff vs. 1.9 for ip).
A NiTi sample covered with a Ta electrodeposit also presents an interesting surface as it was shown to behave as an array of nanoelectrodes (Section 3.2.). It is expected that the mass-transfer limited flux emitted by such arrays is characterized by an apparent mass-mass-transfer
rate keff,lim = 4NRD with D the redox probe diffusivity, R the nanoelectrodes average radius
and N their density within the array. The SEM inspection suggests keff,lim = 0.80 cm/s
(obtained with D = 7.4 x 10⁻⁶ cm²/s, R = 60 nm and N = 4.5 x 10⁹ pores/cm²)[11], which is
much higher than the experimental determination from the FB approach curves (1.7 x 10⁻³
cm/s). Actually, the nanoelectrodes formed by the nanoporous Ta film were shown not to behave as independent sources but to present overlapping diffusion layers. The mass
transfer rate for such array is then expected to be much lower than keff,lim. Similar conclusion
about overlapping diffusion layer from nanosources was actually pointed out by Nugues and Denuault in the investigation of charge transfer across porous membranes [66].
The qualitative and quantitative study of the different SECM approach curves, as well as the cyclic voltamograms discussed above, highlights thus the local characteristics of NiTi-based materials in terms of electrochemical and electronic phenomena: the NiTi functionalization
by Ta and/or C12P layers induces the progressive reinforcement of the blocking effect on
electron transfers at the surfaces. In further applied perspectives, these observations must be considered with attention knowing the fundamental importance of heterogeneous electron-transfer reactions that occur between a metallic biomaterial and the adsorbed proteins naturally covering it when implanted in the human body [67].
3.3.2. Imaging: FB vs. SG/TC modes
After the collection of the FB approach curves for the different substrates, we have recorded corresponding SECM FB maps of the surfaces. For the sake of straightforwardness, only the
13
NiTi-Ta-C12P case (with full surface modification) will be developed further here, the three
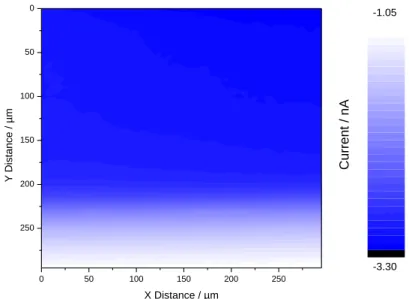
other samples leading to similar observations. As observed in Fig. 7, the image resolution is very poor in the FB mode and does not allow for the obvious observation of any morphological special feature. This is not surprising considering the structure of the surfaces: nanopores in the Ta layer are too small (Ø ~ 150 nm) to be imaged by the microelectrode,
and the covering by the C12P SAM does not sufficiently impact the current parameter to
reveal the “macroscopic” defects assumed from the CV analysis This points out that, with NiTi-based samples, SECM FB imaging on a substrate left at OCP cannot lead to well-defined maps of the different surfaces. This could result from the redox conversion of the selected mediator and the resulting electron and mass transfers with the surface and the tip are not sufficiently “fueled”, mainly because of too passive FB conditions. Indeed, working with a substrate at OCP involves electronic transfers with a zero or weak driving force from the substrate. Moreover, as the NiTi samples respond more efficiently under cathodic conditions (as seen by comparing oxidative and reductive peaks in Fig. 4), attempts to “activate” the imaging of the charge transfer process via the polarization of the NiTi-based sample has been pursued through the SG-TC operation mode.
A representative SECM image in the SG-TC mode of NiTi-Ta-C12P surfaces is reported in Fig.
8. It is important to specify at this stage that the scan is recorded at the exact same x,y,z-location as its corresponding FB counterpart presented in Fig. 7, the only change between
both representations being the applied Etip and Esubstrate. In this way, a direct comparison
between SECM imaging of NiTi-based substrates in FB and SG-TC modes can be discussed.
The selection of the Esubstrate value in SG-TC mode is based on the voltammetry curves of the
samples (Fig. 4, Table 3). For Ti, as well as for Ta-based surfaces, White et al. have shown that the apparent electrochemical activity of surface pitting precursor sites correlates very well with the magnitude of the faradic current measured in the voltammograms, and thus that the SECM image contrast is directly dependent on the potential applied to the sample [33-37,42,43]. From the observations in Fig. 4, a maximal resolution for the observation of electrochemically-active sites by SECM imaging in SG-TC mode will be obtained by applying a
Esubstrate value corresponding to the peak potential of the substrate (Table 3). Thus a potential
of -0.44 V/Ag-AgCl is considered for NiTi-Ta-C12P (Fig. 8), Etip being kept at +0.10 V/Ag-AgCl in
all cases.
The first issue concerns the global resolution of the image, which is substantially improved with SG-TC compared to FB. Short-range variations of the electrochemical activity are now clearly observable. Several electrochemically-active areas of microscopic dimensions, detected as brighter regions in the images, are randomly observed on the surface, most of the time with a quite regular disk shape (Ø ~ 20-30 µm): the structure and dimensions of those sites can easily be correlated with the corresponding properties of pitting [corrosion]
precursor sites observed on TiO2/Ti and Ta2O5/Ta surfaces [33-37,42,43]. All NiTi-based
samples analyzed through this study evidence the random presence of those electroactive areas. The latter correspond to residual topographic imperfections on the underlying Nitinol
14
substrate, which are still randomly perceived. The impact of the blocking effect brought by the different surface modifications has thus to be carefully considered in this perspective. Indeed, the porous morphology of the Ta deposit implies a residual contact between the
Nitinol defects and the external environment. Moreover, a further modification with C12P
SAMs is not sufficient to allow for an exhaustive blocking of the residual reactive sites, even more with such moderate surface coverage ratios (~ 60%). A stronger hindering of the electrochemical response of the underlying Nitinol can be best achieved by depositing
thicker and denser Ta2O5 coatings that thus imply a strongly reduced (if not suppressed)
porosity degree (work in progress).
Nevertheless, the beneficial supply of the complete surface treatment with both Ta and C12P
in terms of imaging resolution is assessed when different Esubstrate values are tested for the
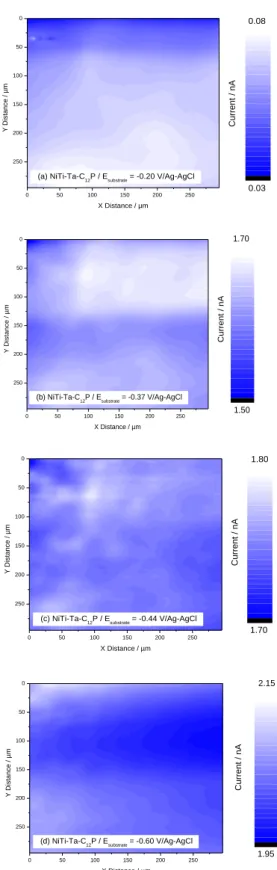
recording of SG/TC current maps, as already mentioned by Pust et al. who observed that the variation of the applied sample potential during the recording of a series of images resulted in contrast and homogeneity changes [40]. Electrochemically-active sites detected on SG/TC
images of NiTi-Ta-C12P samples are perceptible throughout a wider range of Esubstrate – -0.20
to -0.60 V/Ag-AgCl – and with a maximal resolution at Esubstrate = Ep – here -0.44 V/Ag-AgCl
(Fig. 9) –, while they are observed properly for the other substrates only at Esubstrate ~ Ep (not
shown).
The SG-TC mode of the SECM, in addition to considerably improve the imaging resolution compared to the FB mode, allows thus to monitor the electrochemical properties of the substrate. The latter may be directly stimulated by applying an appropriate potential directly to the substrate in order to reveal the presence of local areas more sensitive to corrosion.
This Esubstrate parameter is of great importance in further applied perspectives, notably in the
biological field [68].
4. Conclusions
XPS, SEM, CV and SECM have been used for the characterization of NiTi substrates, pristine or covered with a tantalum electrodeposit and a 1-dodecylphosphonic acid monolayer. The
effects of both Ta and C12P treatments, performed separately and additionally on NiTi, are
evidenced by XPS measurements, showing good grafting efficiency and few contaminants. SEM imaging highlights the particular nanoporous morphology of the Ta layer. Meanwhile, CV analysis points out essential differences between surface modifications with Ta
electrodeposits and C12P films regarding their blocking effect of the electron transfer with
the redox mediator. NiTi plates covered with Ta layers, which intrinsically present nanopores all over their external surface, can be assimilated to blocking electrodes presenting “microscopic” (sub-micrometric) defects behaving as an array of interpenetrating
(nano)electrodes. In contrast, the grafting of C12P leads to interfaces presenting
15
NiTi are calculated from both XPS and CV measurements and show globally good correspondence. Combination of both electrochemical and spectroscopic analysis suggests
that both Ta and NiTi regions are covered equivalently by C12P moieties. Finally, a SECM
study of the different samples through approach curves and current maps reveals their main electrochemical characteristics at a local scale. First-order heterogeneous finite kinetics fitted from experimental FB approach curves recorded for uncovered and covered NiTi surfaces highlight the differences in the regeneration of the mediator at these surfaces. SECM measurements specifically confirm that a more important blocking behavior is
obtained when a combined modification by Ta and C12P is performed. Concerning the
current maps, the FB mode does not lead to good-quality images resolution, probably because of the insufficient “fueling” of the mediator redox conversion in those conditions and settings. However, the polarization of the substrate through the SG-TC mode allows for the recording of better resolved images, with the exposure on all surfaces of several electrochemically-active areas of globally disk shape and micrometric dimensions, corresponding to residual pitting corrosion precursor sites on the underlying Nitinol substrates. The overall corrosion of the substrates and their precursor corrosion sites is reduced by introducing the inorganic and/or organic layers. However, these surface treatments, even combined, do not completely erase (or shadow) these corrosion precursor sites inherent to the pristine NiTi surface.
This work has provided many interesting data concerning the surface chemical composition, as well as on the global and local electrochemical characteristics of the substrates. Further surveys could make the connection with more applied biological perspectives. For instance, the study of the substrates behaviors at sample potential values of biological systems
(~350-550 mV/SCE [68]) – and the resulting adaptation of experimental conditions (selection of
redox probe, …) – constitutes one possible interesting outlook, especially in terms of longer-term applied works (implant engineering, …) where in vitro and in vivo investigations are involved.
Acknowledgment
A.M. is grateful to FNRS-FRIA for Ph.D. student fellowship and funding for scientific mission in Paris.
16
References
[1] S.A. Shabalovskaya, On the nature of the biocompatibility and on medical
applications of NiTi shape memory and superelastic alloys, Biomed. Mater. Eng. 1996, 6, 267.
[2] S.A. Shabalovskaya, J. Anderegg, J. Van Humbeeck, Critical overview of Nitinol
surfaces and their modifications for medical applications, Acta Biomater. 2008, 4, 447.
[3] S.A. Shabalovskaya, G.C. Rondelli, A.L. Undisz, J.W. Anderegg, T.D. Burleigh, M.E.
Rettenmayr, The electrochemical characteristics of native Nitinol surfaces, Biomaterials 2009, 30, 3662.
[4] Z. Bai, H.H. Rotermund, The intrinsically high pitting corrosion resistance of
mechanically polished Nitinol in simulated physiological solutions, J. Biomed. Mater. Res. B 2011, 99, 1.
[5] J. Black, Biological performance of tantalum, Clin. Mater. 1994, 16, 167.
[6] T. Miyazaki, H.-M. Kim, T. Kokubo, C. Ohtsuki, H. Kato, T. Nakamura, Mechanism of
bonelike apatite formation on bioactive tantalum metal in a simulated body fluid, Biomaterials 2002, 23, 827.
[7] B.R. Levine, S. Sporer, R.A. Poggie, C.J. Della Valle, J.J. Jacobs, Experimental and
clinical performance of porous tantalum in orthopedic surgery, Biomaterials 2006, 27, 4671.
[8] S. Zein El Abedin, U. Welz-Biermann, F. Endres, A study of the electrodeposition of
tantalum on NiTi alloy in an ionic liquid and corrosion behaviour of the coated alloy, Electrochem. Commun. 2005, 7, 941.
[9] C. Arnould, J. Delhalle, Z. Mekhalif, Multifunctional hybrid coating on titanium
towards hydroxyapatite growth: Electrodeposition of tantalum and its molecular functionalization with organophosphonic acid films, Electrochim. Acta 2008, 53, 5632.
[10] C. Arnould, J. Delhalle, Z. Mekhalif, Electrodeposition from ionic liquid of 2D ordered
Ta2O5 on titanium substrate through a polystyrene template, J. Electrochem. Soc.
2009, 156, K186.
[11] A. Maho, J. Delhalle, Z. Mekhalif, Study of the formation process and the
characteristics of tantalum layers electrodeposited on Nitinol plates in the 1-butyl-1-methylpyrrolidinium bis(trifluoromethylsulfonyl)imide ionic liquid, Electrochim. Acta 2013, 89, 346.
17
[12] A. Maho, S. Linden, C. Arnould, S. Detriche, J. Delhalle, Z. Mekhalif, Tantalum
oxide/carbon nanotubes composite coatings on titanium, and their functionalization with organophosphonic molecular films: a high quality scaffold for hydroxyapatite growth, J. Colloid Interface Sci. 2012, 371, 150.
[13] B. Adolphi, E. Jahne, G. Busch, X. Cai, Characterization of the adsorption of
x-(thiophene-3-yl alkyl) phosphonic acid on metal oxides with AR-XPS, Anal. Bioanal. Chem. 2004, 379, 646.
[14] G. Mani, D.M. Johnson, D. Marton, V.L. Dougherty, M.D. Feldman, D. Patel, A.A.
Ayon, C.M. Agrawal, Stability of self-assembled monolayers on titanium and gold, Langmuir 2008, 24, 6774.
[15] B. Barthélémy, S. Devillers, I. Minet, J. Delhalle, Z. Mekhalif, Induction heating for
surface triggering styrene polymerization on titanium modified with ATRP initiator, J. Colloid Interface Sci. 2011, 354, 873.
[16] M. Maxisch, C. Ebbert, B. Torun, N. Fink, T. de los Arcos, J. Lackmann, H.J. Maier, G.
Grundmeier, PM-IRRAS studies of the adsorption and stability of organophosphonate monolayers on passivated NiTi surfaces, Appl. Surf. Sci. 2011, 257, 2011.
[17] Z. Petrovic, J. Katic, M. Metikos-Hukovic, H. Dadafarin, S. Omanovic, Modification of a
Nitinol surface by phosphonate self-assembled monolayers, J. Electrochem. Soc. 2011, 158, F159.
[18] L. Tan, R.A. Dodd, W.C. Crone, Corrosion and wear-corrosion behavior of NiTi
modified by plasma source ion implantation, Biomaterials 2003, 24, 3931.
[19] S. Shabalovskaya, G. Rondelli, J. Anderegg, J.P. Xiong, M. Wu, Comparative corrosion
performance of black oxide, sandblasted, and fine-drawn Nitinol wires in potentiodynamic and potentiostatic Ttests: effects of chemical etching and electropolishing, J. Biomed. Mater. Res. B 2004, 69, 223.
[20] F. Sun, K.N. Sask, J.L. Brash, I. Zhitomirsky, Surface modifications of Nitinol for
biomedical applications, Colloid. Surface. B 2008, 67, 132.
[21] R. Quinones, E.S. Gawalt, Polystyrene formation on monolayer-modified Nitinol
effectively controls corrosion, Langmuir 2008, 24, 10858.
[22] W. Simka, M. Kaczmarek, A. Baron-Wiechec, G. Nawrat, J. Marciniak, J. Zak,
Electropolishing and passivation of NiTi shape memory alloy, Electrochim. Acta 2010, 55, 2437.
[23] D. Qiu, L. Yang, Y. Yin, A. Wang, Preparation and characterization of
hydroxyapatite/titania composite coating on NiTi alloy by electrochemical deposition, Surf. Coat. Technol. 2011, 205, 3280.
18
[24] S. Devillers, B. Barthélémy, J. Delhalle, Z. Mekhalif, Induction heating vs conventional
heating for the hydrothermal treatment of Nitinol and its subsequent 2-(methacryloyloxy)ethyl 2-(trimethylammonio)ethyl phosphate coating by surface-initiated atom transfer radical polymerization, ACS Appl. Mater. Interfaces 2011, 3, 4059.
[25] I. Milosev, B. Kapun, The corrosion resistance of Nitinol alloy in simulated
physiological solutions - Part 2: The effect of surface treatment, Mater. Sci. Eng. C 2012, 32, 1068.
[26] I. Milosev, B. Kapun, The corrosion resistance of Nitinol alloy in simulated
physiological solutions - Part 1: The effect of surface preparation, Mater. Sci. Eng. C 2012, 32, 1087.
[27] A.J. Bard, M.V. Mirkin, Scanning Electrochemical Microscopy, Marcel Dekker Inc, New
York, 2001.
[28] G. Wittstock, M. Burchardt, S.E. Pust, Y. Shen, C. Zhao, Scanning electrochemical
microscopy for direct imaging of reaction rates, Angew. Chem. Int. Ed. 2007, 46, 1584.
[29] A. Kiani, M.A. Apluche-Aviles, P.K. Eggers, M. Jones, J.J. Gooding, M.N. Paddon-Row,
A.J. Bard, Scanning electrochemical microscopy. 59. Effect of defects and structure on electron transfer through self-assembled monolayers, Langmuir 2008, 24, 2841.
[30] A. Maho, J. Denayer, J. Delhalle, Z. Mekhalif, Electro-assisted assembly of aliphatic
thiol, dithiol and dithiocarboxylic acid monolayers on copper, Electrochim. Acta 2011, 56, 3954.
[31] H. Hazimeh, S. Nunige, R. Cornut, C. Lefrou, C. Combellas, F. Kanoufi, Surface
reactivity from electrochemical lithography: illustration in the steady-state reductive etching of perfluorinated surfaces, Anal. Chem. 2011, 83, 6106.
[32] T. Matrab, F. Hauquier, C. Combellas, F. Kanoufi, Scanning electron microscopy
investigation of molecular transport and reactivity within polymer brushes, ChemPhysChem 2010, 11, 670.
[33] N. Casillas, S.R. Snyder, W.H. Smyrl, H.S. White, Correlation of electron-transfer rates
with the surface density of states of native and anodically grown oxide films on titanium, J. Phys. Chem. 1991, 95, 7002.
[34] N. Casillas, S.J. Charlebois, W.H. Smyrl, H.S. White, Scanning electrochemical
microscopy of precursor sites for pitting corrosion on titanium, J. Electrochem. Soc. 1993, 140, L142.
19
[35] N. Casillas, S. Charlebois, W.H. Smyrl, H.S. White, Pitting corrosion of titanium, J.
Electrochem. Soc. 1994, 141, 636.
[36] S.B. Basame, H.S. White, Scanning electrochemical microscopy of native titanium
oxide films. Mapping the potential dependence of spatially-localized electrochemical reactions, J. Phys. Chem. 1995, 99, 16430.
[37] S.B. Basame, H.S. White, Scanning electrochemical microscopy: measurement of the
current density at microscopic redox-active sites on titanium, J. Phys. Chem. B 1998, 102, 9812.
[38] A. Schulte, S. Belger, M. Etienne, W. Schuhmann, Imaging localised corrosion of NiTi
shape memory alloys by means of alternating current scanning electrochemical microscopy (AC-SECM), Mater. Sci. Eng. A 2004, 378, 523.
[39] S.E. Pust, D. Scharnweber, C.N. Kirchner, G. Wittstock, Heterogeneous distribution of
reactivity on metallic biomaterials: scanning probe microscopy studies of the biphasic Ti alloy Ti6Al4V, Adv. Mater. 2007, 19, 878.
[40] S.E. Pust, D. Scharnweber, S. Baunack, G. Wittstock, Electron transfer kinetics at oxide
films on metallic biomaterials, J. Electrochem. Soc. 2007, 154, C508.
[41] R. Zhu, C. Nowierski, Z. Ding, J.J. Noël, D. Shosmith, Insights into grain structures and
their reactivity on grade-2 Ti alloy surfaces by scanning electrochemical microscopy, Chem. Mater. 2007, 19, 2533.
[42] S.B. Basame, H.S. White, Chemically-selective and spatially-localized redox activity at
Ta/Ta2O5 electrodes, Langmuir 1999, 15, 819.
[43] S.B. Basame, H.S. White, Scanning electrochemical microscopy of metal/metal oxide
electrodes. Analysis of spatially localized electron-transfer reactions during oxide growth, Anal. Chem. 1999, 71, 3166.
[44] D.P. Wipf, Initiation and study of localized corrosion by scanning electrochemical
microscopy, Colloid. Surface. A 1994, 93, 251.
[45] A.M. Simoes, A.C. Bastos, M.G. Ferreira, Y. Gonzalez-Garcia, S. Gonzalez, R.M. Souto,
Use of SVET and SECM to study the galvanic corrosion of an iron–zinc cell, Corros. Sci. 2007, 49, 726.
[46] C.H. Paik, R.C. Alkire, Role of sulfide inclusions on localized corrosion of Ni200 in NaCl
solutions, J. Electrochem. Soc. 2001, 148, B276.
[47] M. Pahler, J.J. Santana, W. Schuhmann, R.M. Souto, Application of AC-SECM in
corrosion science: local visualisation of inhibitor films on active metals for corrosion protection, Chem. Eur. J. 2011, 17, 905.
20
[48] A.K. Neufeld, A.P. O’Mullane, Effect of the mediator in feedback mode-based SECM
interrogation of indium tin-oxide and boron-doped diamond electrodes, J. Solid State Electrochem. 2006, 10, 806.
[49] P.J. Cumpson, M.P. Seah, Elastic scattering corrections in AES and XPS. II. Estimating
attenuation lengths and conditions required for their valid use in overlayer/substrate experiments, Surf. Interface Anal. 1997, 25, 430.
[50] G. Chamoulaud, D. Bélanger, Spontaneous derivatization of a copper electrode with
in situ generated diazonium cations in aprotic and aqueous media, J. Phys. Chem. C 2007, 111, 7501.
[51] F. Hauquier, T. Matrab, F. Kanoufi, C. Combellas, Local direct and indirect reduction of
electrografted aryldiazonium/gold surfaces for polymer brushes patterning, Electrochim. Acta 2009, 54, 5127.
[52] C. Amatore, J.M. Savéant, D. Tessier, Charge transfer at partially blocked surfaces: a
model for the case of microscopic active and inactive sites, J. Electroanal. Chem. 1983, 147, 39.
[53] S.A. Shabalovskaya, J.W. Anderegg, Surface spectroscopic characterization of TiNi
nearly equiatomic shape memory alloys for implants, J. Vac. Sci. Technol. A 1995, 13, 2624.
[54] O. Kerrec, D. Devilliers, H. Groult, P. Marcus, Study of dry and electrogenerated Ta2O5
and Ta:Ta2O5:Pt structures by XPS, Mater. Sci. Eng. B 1998, 55, 134.
[55] L.P.H. Jeurgens, W.G. Sloof, F.D. Tichelaar, C.G. Borsboom, E.J. Mittemeijer,
Determination of thickness and composition of aluminium-oxide overlayers on aluminium substrates, Appl. Surf. Sci. 1999, 144-145, 11.
[56] M.-C. Bernard, A. Chaussé, E. Cabet-Deliry, M.M. Chemimi, J. Pinson, F. Podvorica, C.
Vautrin-Ul, Organic layers bonded to industrial, coinage, and noble metals through electrochemical reduction of aryldiazonium salts, Chem. Mater. 2003, 15, 3450.
[57] G. Tanami, V. Gutkin, D. Mandler, Thin Nanocomposite Films of Polyaniline/Au
Nanoparticles by the Langmuir-Blodgett Technique, Langmuir 2010, 26, 4239.
[58] T.J. Davies, C.E. Banks, R.G. Compton, Voltammetry at spatially heterogeneous
electrodes, J. Solid State Electrochem. 2005, 9, 797.
[59] T. Gueshi, K. Tokuda, H. Matsuda, Voltammetry at partially covered electrodes. Part
21
[60] L. Forget, F. Wilwers, J. Delhalle, Z. Mekhalif, Surface modification of aluminum by
n-pentanephosphonic acid: XPS and electrochemical evaluation, Appl. Surf. Sci. 2003, 205, 44.
[61] D.M. Spori, N.V. Venkataraman, S.G.P. Tosatti, F. Durmaz, N.D. Spencer, S. Zürcher,
Influence of alkyl chain length on phosphate self-assembled monolayers, Langmuir 2007, 23, 8053.
[62] R. Quinones, E.S. Gawalt, Study of the formation of self-assembled monolayers on
Nitinol, Langmuir 2007, 23, 10123.
[63] G. Lecollinet, N. Delorme, M. Edely, A. Gibaud, J.-F. Bardeau, F. Hindré, F. Boury, D.
Portet, Self-assembled monolayers of bisphosphonates: influence of side chain steric hindrance, Langmuir 2009, 25, 7828.
[64] C. Wei, A.J. Bard, M.V. Mirkin, Scanning electrochemical microscopy. 31. Application
of SECM to the study of charge transfer processes at the liquid/liquid interface, J. Phys. Chem. 1995, 99, 16033.
[65] R. Cornut, C. Lefrou, New analytical approximation of feedback approach curves with
a microdisk SECM tip and irreversible kinetic reaction at the substrate, J. Electroanal. Chem. 2008, 621, 178.
[66] S. Nugues, G. Denuault, Scanning electrochemical microscopy: amperometric probing
of diffusional ion fluxes through porous membranes and human dentine, J. Electroanal. Chem. 1996, 408, 125.
[67] P. Roach, D. Eglin, K. Rohde, C.C. Perry, Modern biomaterials: a review—bulk
properties and implications of surface modifications, J. Mater. Sci.: Mater. Med. 2007, 18, 1263.
[68] D. Scharnweber, R. Beutner, S. Rössler, H. Worch, Electrochemical behavior of
titanium-based materials - are there relations to biocompatibility? J. Mater. Sci.: Mater. Med. 2002, 13, 1215.
22
Figures
Fig. 1. Surface modification of NiTi (a) by tantalum electrodeposition (b), self-assembling of
1-dodecylphosphonic acid molecules (c), and both (d).
1400 1200 1000 800 600 400 200 0 140 135 130 125 120 P2p 140 135 130 125 120 P2p Binding energy / eV (d) NiTi-Ta-C12P P2s P2s (c) NiTi-Ta T a4 p3/2 T a4 p3/2 Ni2p Ni2p (b) NiTi-C 12P F1s F1s P2p P2p T a4 f T a4 f T a4 d C1s C1s C1s T a4 d T i2 p + T a4 p1/2 T i2 p T i2 p O1s O1s O1s Ni2p C1s T i2 p + T a4 p1/2 O1s Ni2p Intensity / a.u. (a) NiTi
Fig. 2. XPS survey spectra of NiTi (a), NiTi-C12P (b), NiTi-Ta (c), and NiTi-Ta-C12P (d). Inserts:
23
Fig. 3. XPS core levels of Ti2p for NiTi and NiTi-C12P (a), Ta4f for NiTi-Ta and NiTi-Ta-C12P (b), and Ti2p for NiTi and NiTi-Ta (c).
480 475 470 465 460 455 450 445 0 2000 4000 6000 8000 10000 12000 14000 16000
18000 (a) - Ti2p TiO2
Int ensit y / c ps Binding energy / eV NiTi NiTi-C12P 40 38 36 34 32 30 28 26 24 22 20 18 0 2000 4000 6000 8000 10000 12000 14000 16000 Ta2O5 (b) - Ta4f Inte n sity / cp s Binding energy / eV NiTi-Ta NiTi-Ta-C12P 480 475 470 465 460 455 450 445 0 2000 4000 6000 8000 10000 12000 14000 16000 18000 (c) - Ti2p TiO2 In te n si ty / cp s Binding energy / eV NiTi NiTi-Ta
24
Fig. 4. Cyclic voltammetry curves for pristine NiTi (black), NiTi-C12P (green), NiTi-Ta (red) and
NiTi-Ta-C12P (blue) samples in 5 mM Ru(NH3)6Cl3 / 0.1 M K2SO4 working solution at scan rate
v = 20 mV/s.
Fig. 5. SEM image of a NiTi-Ta surface.
-1.0 -0.8 -0.6 -0.4 -0.2 0.0 0.2 0.4 0.6 -0.15 -0.10 -0.05 0.00 0.05 0.10 C u rr e n t / mA Potential vs. Ag-AgCl / V NiTi NiTi-C12P NiTi-Ta NiTi-Ta-C12P
25
Fig. 6. Normalized SECM FB approach curves (vz = 2 µm/s, 5 mM Ru(NH3)6Cl3 / 0.1 M K2SO4,
Etip = -0.70 V/Ag-AgCl, Esubstrate = OCP) measured for NiTi (black squares), NiTi-C12P (green
triangles), NiTi+Ta (red circles) and NiTi-Ta-C12P (blue stars) samples. Solid lines are the
theoretical curves for finite electron-transfer kinetics, while dashed and dotted lines are the theoretical curves for a conducting substrate and for a totally insulating substrate, respectively. 0.0 0.5 1.0 1.5 2.0 2.5 3.0 3.5 4.0 4.5 5.0 0.0 0.5 1.0 1.5 2.0 IT = i T /iinf L = d/a Conducting substrate Insulating substrate NiTi NiTi-C12P NiTi-Ta NiTi-Ta-C12P
26
Fig. 7. SECM FB image (vx,y = 25 µm/s, 5 mM Ru(NH3)6Cl3 / 0.1 M K2SO4) of a NiTi-Ta-C12P
surface. Etip = -0.70 V/Ag-AgCl, Esubstrate = OCP.
Fig. 8. SECM SG-TC image (vx,y = 25 µm/s, 5 mM Ru(NH3)6Cl3 / 0.1 M K2SO4) of a NiTi-Ta-C12P
surface. Etip = +0.10 V/Ag-AgCl, Esubstrate = -0.44 V/Ag-AgCl. The x,y,z positions of the tip in Fig.
8 are the same as in Fig. 7.
0 50 100 150 200 250 250 200 150 100 50 0 -3.30 -1.05 Current / nA -3.3E-9 -3.225E-9 -3.15E-9 -3.075E-9 -2.999E-9 -2.924E-9 -2.849E-9 -2.774E-9 -2.699E-9 -2.624E-9 -2.548E-9 -2.473E-9 -2.398E-9 -2.323E-9 -2.248E-9 -2.173E-9 -2.097E-9 -2.022E-9 -1.947E-9 -1.872E-9 -1.797E-9 -1.722E-9 -1.646E-9 -1.571E-9 -1.496E-9 -1.421E-9 -1.346E-9 -1.271E-9 -1.195E-9 -1.12E-9 -1.045E-9 X Distance / µm Y D ist an ce / µm 0 50 100 150 200 250 250 200 150 100 50 0 1.70 1.80 Cu rr e n t / nA 1.71E-9 1.713E-9 1.716E-9 1.719E-9 1.722E-9 1.725E-9 1.728E-9 1.731E-9 1.734E-9 1.737E-9 1.74E-9 1.743E-9 1.746E-9 1.749E-9 1.752E-9 1.755E-9 1.758E-9 1.761E-9 1.764E-9 1.767E-9 1.77E-9 1.773E-9 1.776E-9 1.779E-9 1.782E-9 1.785E-9 1.788E-9 1.791E-9 1.794E-9 1.797E-9 1.8E-9 X Distance / µm Y Dis ta nc e / µm
27
Fig. 9. SECM SG-TC images (vx,y = 25 µm/s, 5 mM Ru(NH3)6Cl3 / 0.1 M K2SO4) of NiTi-Ta-C12P
surfaces at Esubstrate = -0.20 V/Ag-AgCl (a), -0.37 V/Ag-AgCl (b), -0.45 V/Ag-AgCl (c), and -0.60
V/Ag-AgCl (d). Etip = +0.10 V/Ag-AgCl. The x,y,z positions of the tip are the same in all images.
0 50 100 150 200 250 250 200 150 100 50 0 0.03 0.08
(a) NiTi-Ta-C12P / Esubstrate = -0.20 V/Ag-AgCl
C u rr e n t / n A 3E-11 3.167E-11 3.333E-11 3.5E-11 3.667E-11 3.833E-11 4E-11 4.167E-11 4.333E-11 4.5E-11 4.667E-11 4.833E-11 5E-11 5.167E-11 5.333E-11 5.5E-11 5.667E-11 5.833E-11 6E-11 6.167E-11 6.333E-11 6.5E-11 6.667E-11 6.833E-11 7E-11 7.167E-11 7.333E-11 7.5E-11 7.667E-11 7.833E-11 8E-11 X Distance / µm Y Dis tanc e / µm 0 50 100 150 200 250 250 200 150 100 50 0 1.50 1.70
(b) NiTi-Ta-C12P / Esubstrate = -0.37 V/Ag-AgCl
C ur re nt / nA 1.5E-9 1.507E-9 1.513E-9 1.52E-9 1.527E-9 1.533E-9 1.54E-9 1.547E-9 1.553E-9 1.56E-9 1.567E-9 1.573E-9 1.58E-9 1.587E-9 1.593E-9 1.6E-9 1.607E-9 1.613E-9 1.62E-9 1.627E-9 1.633E-9 1.64E-9 1.647E-9 1.653E-9 1.66E-9 1.667E-9 1.673E-9 1.68E-9 1.687E-9 1.693E-9 1.7E-9 X Distance / µm Y D is tanc e / µm 0 50 100 150 200 250 250 200 150 100 50 0 1.70 1.80 (c) NiTi-Ta-C 12P / Esubstrate = -0.44 V/Ag-AgCl C u rr e n t / n A 1.71E-9 1.713E-9 1.716E-9 1.719E-9 1.722E-9 1.725E-9 1.728E-9 1.731E-9 1.734E-9 1.737E-9 1.74E-9 1.743E-9 1.746E-9 1.749E-9 1.752E-9 1.755E-9 1.758E-9 1.761E-9 1.764E-9 1.767E-9 1.77E-9 1.773E-9 1.776E-9 1.779E-9 1.782E-9 1.785E-9 1.788E-9 1.791E-9 1.794E-9 1.797E-9 1.8E-9 X Distance / µm Y Di s tanc e / µm 0 50 100 150 200 250 250 200 150 100 50 0 1.95 2.15
(d) NiTi-Ta-C12P / Esubstrate = -0.60 V/Ag-AgCl
Cur re nt / nA 1.96E-9 1.967E-9 1.973E-9 1.98E-9 1.987E-9 1.993E-9 2E-9 2.007E-9 2.013E-9 2.02E-9 2.027E-9 2.033E-9 2.04E-9 2.047E-9 2.053E-9 2.06E-9 2.067E-9 2.073E-9 2.08E-9 2.087E-9 2.093E-9 2.1E-9 2.107E-9 2.113E-9 2.12E-9 2.127E-9 2.133E-9 2.14E-9 2.147E-9 2.153E-9 2.16E-9 X Distance / µm Y D is tanc e / µm