RESEARCH OUTPUTS / RÉSULTATS DE RECHERCHE
Author(s) - Auteur(s) :
Publication date - Date de publication :
Permanent link - Permalien :
Rights / License - Licence de droit d’auteur :
Dépôt Institutionnel - Portail de la Recherche
researchportal.unamur.be
University of Namur
Capturing multiple social perspectives on adaptation across scales
Dujardin, S.; Orban-Ferauge, F.; Cañares, M. P.; Dendoncker, N.
Published in:
Climate and Development
DOI:
http://dx.doi.org/10.1080/17565529.2017.1301863 Publication date:
2018
Document Version
Version created as part of publication process; publisher's layout; not normally made publicly available
Link to publication
Citation for pulished version (HARVARD):
Dujardin, S, Orban-Ferauge, F, Cañares, MP & Dendoncker, N 2018, 'Capturing multiple social perspectives on adaptation across scales: a Q-method analysis of actors from development planning in the Philippines', Climate
and Development, vol. 10, no. 5, pp. 458-470. https://doi.org/10.1080/17565529.2017.1301863
General rights
Copyright and moral rights for the publications made accessible in the public portal are retained by the authors and/or other copyright owners and it is a condition of accessing publications that users recognise and abide by the legal requirements associated with these rights. • Users may download and print one copy of any publication from the public portal for the purpose of private study or research. • You may not further distribute the material or use it for any profit-making activity or commercial gain
• You may freely distribute the URL identifying the publication in the public portal ?
Take down policy
If you believe that this document breaches copyright please contact us providing details, and we will remove access to the work immediately and investigate your claim.
For Review Only
Capturing multiple social perspectives on adaptation across scales: A Q-method analysis of actors from development
planning in the Philippines
Journal: Climate and Development Manuscript ID 15-CDEV708-RA.R3 Manuscript Type: Research Article
Keywords: Adaptation, Development, Participation, Urban Development, Southeast Asia
For Review Only
Capturing multiple social perspectives on adaptation across scales: A Q-method analysis of actors from development planning in the Philippines
Abstract
This paper describes and analyses viewpoints regarding climate change adaptation held among key social actors from the field of development planning in the Philippines. Four empirically significant social perspectives are determined – institutional, grassroots, developmental and physical planning – using Q-method, an intensive qualitative and quantitative technique. Major differences and commonalities between perspectives are highlighted, in addition to actors’ arguments used to justify claims. Drawing upon an actor-oriented approach, results contribute filling a knowledge gap in the literature on the need to develop approaches that can guide adaptation thinking in development planning. While the four perspectives identified provide evidence that differentiated viewpoints on climate change and planning practices may lead to divergent adaptation strategies, commonalities among social perspectives suggest that shared adaptations may also emerge both among actors from multiple organizational structures and across the organisational hierarchy of planning. By building learning processes that include multiple social perspectives across scales, development planning can become a promising candidate for strengthening adaptive capacities and delivering more effective responses to climate change.
Key words: Climate change adaptation, development planning, social perspectives, Q-method,
Philippines, Bohol. 3 4 5 6 7 8 9 10 11 12 13 14 15 16 17 18 19 20 21 22 23 24 25 26 27 28 29 30 31 32 33 34 35 36 37 38 39 40 41 42 43 44 45 46 47 48 49 50 51 52 53 54 55 56 57 58 59
For Review Only
1. Introduction
1 2
Concerns about the nature, pace and implications of climate change have been the subject of 3
scientific debates for many years. Recently, the inclusion of a broad range of actors is frequently 4
promoted in policy responses to climate change. References to ‘participation’, ‘stakeholder 5
engagement’, ‘bottom-up’ processes, and other terms associated with a discourse of inclusive 6
governance are widespread (Few, Brown, & Tompkins, 2007). In this regard, the 7
Intergovernmental Panel on Climate Change (IPCC) claims with “high confidence” (Yohe et al., 8
2007, p.813) that participatory processes can reduce vulnerability to the hazards associated with 9
current and future climate variability and extremes. Such a call for inclusive governance has been 10
echoed within the fields of planning and development where inclusive practices are often 11
promoted for fundamentally reinforcing key aspects of adaptation. 12
13
Understood as the link between knowledge and action (Friedmann, 1987), development planning 14
can help foreseeing and guiding change by undertaking actions to reduce the risks and capitalize 15
on the opportunities associated with global climate change (Füssel, 2007; Hall, 1982; Potter, 16
1985; Pugh & Potter, 2003). Interdisciplinary, multi-scale, stressing the physical, yet inescapably 17
social, it can also support the inclusion of multiple actors within planning processes in order to 18
incorporate a knowledge base tailored to local places within adaptation plans (Blanco et al., 19
2009). Besides, implementing multiple actor processes within planning mechanisms for initiating 20
structural measures creates the potential for more effective risk reduction whilst building capacity, 21
enhancing governance and accountability, and increasing ownership and more sustainable 22
outcomes (Cutter et al., 2012). 23
24
Nonetheless, planning theories and development frameworks are often poorly articulated around 25
the challenge of adaptation to climate change, highlighting the need to develop approaches that 26
can guide adaptation thinking in development planning practice (Hedger, Moench, Dixit, Kaur, & 27
Anderson, 2011). Meanwhile, experience in the field of adaptation research shows the increasing 28
importance to recognise the complexities inherent in efforts to engage multiple actors for building 29
adaptive capacity (Engle & Lemos, 2010; Huntjens et al., 2012; Inderberg, Eriksen, O'Brien, & 30
Sygna, 2014). Consequently, this research investigates how to guide adaptation thinking in 31
development planning by building upon a framework that encompasses two key components. 32
33
First, climate change is a challenge that cannot be addressed solely by a single level of individual 34
or organisational actor. Although local community actors for instance are critical for action and 35
essential elements for local adaptation, adaptive capacities are not created in a vacuum. Local-36
level institutions often provide the enabling environment for adaptation planning and 37
implementation (Cutter et al., 2012). Adaptation thus requires ‘multi-level’ or ‘multiscale’ 38
governance (Bulkeley & Betsill, 2005; Leck & Simon, 2013), which involves organisations and 39
institutions from both the government and non-government sectors. Likewise, responding to the 40
novel hazards of climate change requires social learning systems enable to take decisions at an 41
appropriate level in the organisational hierarchy (Cash & Moser, 2000). 42
43
Second, building successful adaptations requires the capacity to combine various social 44
perspectives. As Pelling (2011) pointed, it is clear that multiple actors will have viewpoints on 45
what to protect, enhance or expend through adaptive actions and these may not be easily 46 3 4 5 6 7 8 9 10 11 12 13 14 15 16 17 18 19 20 21 22 23 24 25 26 27 28 29 30 31 32 33 34 35 36 37 38 39 40 41 42 43 44 45 46 47 48 49 50 51 52 53 54 55 56 57 58 59
For Review Only
resolved. Hence, capturing various perspectives of multiple actors holding different viewpoints is 47
pivotal in mutually achieving short-term and long-term adaptation needs to climate change 48
(Bardsley & Sweeney, 2010; Corfee-Morlot, Cochran, Hallegatte, & Teasdale, 2011; K. O'Brien & 49
Selboe, 2015; Shaw et al., 2009). As O’Brien (2009) argues, the challenge is to identify 50
adaptation strategies that acknowledge and address a spectrum of values and viewpoints. In 51
contrast to systems that can be objectively measured and observed, these “subjectively influence 52
the adaptations that are considered desirable and thus prioritised” (O'Brien, K., 2009, p.164). 53
54
Building upon this framework, this paper investigates the potential role of development planning 55
for strengthening adaptive capacities. In particular, it explores how development planning can 56
create learning processes that incorporate various social perspectives and facilitate developing a 57
common understanding critical for multiscale and multiple actors’ actions. An actor-oriented 58
approach focusing on state and non-state actors is undertaken by accounting for government 59
and civil society organisations (CSOs) involved in both planned and autonomous adaptation 60
strategies1. Such an approach recognizes multiple simultaneous adaptations, but also betrays a 61
critical issue, i.e. the potential mismatch between adaptation efforts of planned and autonomous 62
activities. This kind of interaction has been recognised between two types of actors, such as 63
when community adaptations are undermined by local government actions (Adger, Arnell, & 64
Tompkins, 2005; Bulkeley & Betsill, 2005). Yet, poor evidence exists as to how actors engaged in 65
those two forms of adaptation strategies may hold conflicting viewpoints on adaptation (Engle & 66
Lemos, 2010; Hedger et al., 2011; Huntjens et al., 2012). 67
68
The aim of this study is thus two-fold: (i) to capture multiple social perspectives on climate 69
change adaptation and planning practices across the organisational hierarchy of planning, and 70
(ii) to examine whether commonalities and differences among these perspectives may lead 71
towards divergent or convergent adaptation strategies. Within the next sections, we first 72
introduce the adaptation and development planning context of our case study, the Philippines. 73
Then, we implement the Q-method, an intensive qualitative and quantitative technique for 74
examining and characterizing multiple actors’ viewpoints. Lastly, we detail four social 75
perspectives and further discuss their commonalities and differences. 76
2. Study area
77 78
Climate change poses a unique set of challenges to archipelagic countries such as the 79
Philippines. Due to its geography, the country is one of the top most disaster prone countries in 80
the world facing climate-induced hazards such as tropical cyclones, droughts, landslides, and 81
floods (Birkmann et al., 2011). Yet, climate change is exacerbating these hazards, which are 82
likely to increase as climate projections foresee an increase in the frequency and severity of 83
those events (Van Aalst, 2006). Global warming and sea level rise also potentially affect 84
settlement patterns, agricultural systems, fishing practices and other livelihood pursuits in various 85
ways (Capili, Ibay, & Villarin, 2005; Rincón & Virtucio, 2008). In this context, the Philippines 86
needs to address climate-related risks because of its exposure and relative vulnerability, but also 87
because it needs to further develop its adaptive capacity (AKP, 2012). The country’s existing 88
1 Planned adaptation is the result of a deliberate policy decision, based on an awareness that conditions have changed or are about to change and that action is required to return to, maintain, or achieve a desired state. By contrast, autonomous adaptation is a response to experienced climate and its effects, without planning explicitly or consciously focused on addressing climate change (Agard et al., 2014).
3 4 5 6 7 8 9 10 11 12 13 14 15 16 17 18 19 20 21 22 23 24 25 26 27 28 29 30 31 32 33 34 35 36 37 38 39 40 41 42 43 44 45 46 47 48 49 50 51 52 53 54 55 56 57 58 59
For Review Only
adaptive capacity is drawn upon pre-existent disaster risk reduction and management (DRRM) 89
activities, but has now to be enhanced where possible, avoiding to start from scratch and 90
duplicating current initiatives (IDS, 2010). 91
92
This study focuses on the island province of Bohol in the central Visayas region (see Figure 1). 93
Referred in the country as being at the forefront of local governance (Cañares, 2014), the 94
province of Bohol has a great potential for building adaptation strategies resulting from the 95
interactions between different levels of social actors and institutions. There are numerous climate 96
change adaptation strategies undertaken by various types of actors depending on their focus 97
areas (see IDS, 2010). Among the most active in the field of development planning are 98
government agencies and civil society organisations. 99
100
On the government side, Local Government Units (LGUs) 2 in Bohol are mainly involved in 101
planned adaptation strategies through current efforts of mainstreaming climate change adaption 102
into development planning at all levels of governance, as required by the Climate Change Act. 103
Being a pilot province for the project named “Integrating Disaster Risk Reduction and Climate 104
Change Adaptation in Local Planning and Decision-making Processes”, LGUs from Bohol are 105
additionally solicited to address the challenge of climate change in local development planning. 106
By law, barangays (i.e. the smallest political administrative division) should identify issues, best 107
practices and implement solutions, while the municipal and city governments are mandated to 108
consider adaptation as one of their regular functions. The provincial governments in turn shall 109
provide technical assistance, enforcement, and information management support to 110
municipalities and cities (AKP, 2012). 111
112
CSOs in Bohol, on the other side, are mostly involved in autonomous adaptation by developing 113
strategies not explicitly related to climate change, but aimed at reducing vulnerability and 114
enhancing overall adaptive capacity of individuals and communities in areas of high climate 115
impacts. In this regard, the most active NGOs on the island are committed to address pressing 116
socio-economic and environmental issues by strengthening and capacitating local communities 117
and development organisations such as People’s Organizations (PO) and cooperatives (e.g. 118
farmers, fishers, and women). These kind of autonomous actions can improve the overall 119
adaptive capacity of households without necessarily targeting a particular climatic stressor or 120
addressing a climate extreme event. 121
122
However, an integrated strategy linking the national, planned and local, autonomous 123
development practices still has to be built both within and in-between civil society forces and the 124
government at various levels. Resurreccion et al. (2008) for instance pointed a mismatch 125
between national level discussions with broad-scale scoping, and local level realities in 126
adaptation where macro scale analysis of climate change are unresponsive to local needs and 127
realities for adaptation. Within the next section, such a disjunction between planned and 128
autonomous forms of adaptation is addressed by comparing actors’ viewpoints from the field of 129
development planning in the Philippines. 130
131
Fig. 1. Study area and survey sites 132
2 A LGU in the Filipino context may be a province, a city, a municipality, or a barangay in the descending order of geographical scale and scope of political power. In geographical terms, each LGU has its own territorial jurisdiction but the smaller unit is embedded in the next higher unit forming a nested pattern (DILG, 2008). 3 4 5 6 7 8 9 10 11 12 13 14 15 16 17 18 19 20 21 22 23 24 25 26 27 28 29 30 31 32 33 34 35 36 37 38 39 40 41 42 43 44 45 46 47 48 49 50 51 52 53 54 55 56 57 58 59
For Review Only
133
3. Method and data
134 135
This study relies on Q-method (Brown, 1980; Stephenson, 1935) to understand and describe the 136
variety of subjective viewpoints regarding climate change adaptation held among actors from 137
government agencies and civil society organisations in the Philippines. Used as “a powerful tool 138
for anti-essentialist approaches to subjectivity and for constructivist inquiries” (Robbins & 139
Krueger, 2000, p.636), it provides a methodological framework for a systematic, multi-scalar 140
examination of social perspectives across the scales of the organisational hierarchy of planning. 141
Most typically in Q, a person is presented with a set of subjective statements about some topic, 142
and is asked to rank-order them. Based upon this sorting exercise called ‘Q-sort’, factor analysis 143
is processed to identify patterns in individuals’ Q-sorts. What factor analysis does is to 144
mathematically create a few new variables that explain variation in many variables. In a Q-145
method survey the variables are the Q-sorts where the factor analysis attempts to bring the 146
complexity of multiple individuals’ Q-sorts down to a simpler picture. Once the factor is described 147
in the language of the Q statements, it becomes the product of the Q-method survey. The 148
individuals’ Q-sorts are individual viewpoints, but the factor analysis solutions reflect “deeper 149
organizing principles” (Stephenson 1965) called social perspectives for the purpose of this paper. 150
151
The Q-method was implemented according to four main steps. First, a concourse of 40 152
statements was elaborated. The concourse builds upon our main research question by 153
translating subjective ways of perceiving climate change and strengthening adaptive capacities. It 154
aims at bringing controversial viewpoints to the fore on climate change adaptation and planning 155
practices in the Philippines. Statements are a matter of opinion and drew upon the scientific 156
literature, key reports and documents (e.g. the 1st Bohol Climate Change Summit 2010), and 157
interviews with key informants (i.e. experts from the academia and research institutes, provincial 158
and municipal government officers from planning, environment and governance offices, and 159
active leaders of local NGOs). Three main areas of enquiry were identified: climate change 160
perception, adaptation approach, and planning practices (see Table 3). As statements were 161
submitted to respondents with a wide range of backgrounds, these were translated in Visayan for 162
increasing readability with respondents feeling less comfortable with English. 163
164
During the second step, respondents were identified using purposive, non-random sampling to 165
sort the statements on a scale from -3 to +3 according to their degree of (dis)agreement. When 166
sorting statements, the internal frame of reference of each respondent is embedded in their 167
responses. The Q-method thus fully engages with the respondent's own logic and their personal 168
experiences. Q methodologically does not ascribe any a priori meaning to the statements in 169
question. Meanings are created during the process of responses, which contrasts with R 170
methods in which both variables and tests in question are constructed by the researcher's frame 171
of reference (McKeown & Thomas, 1988). 172
173
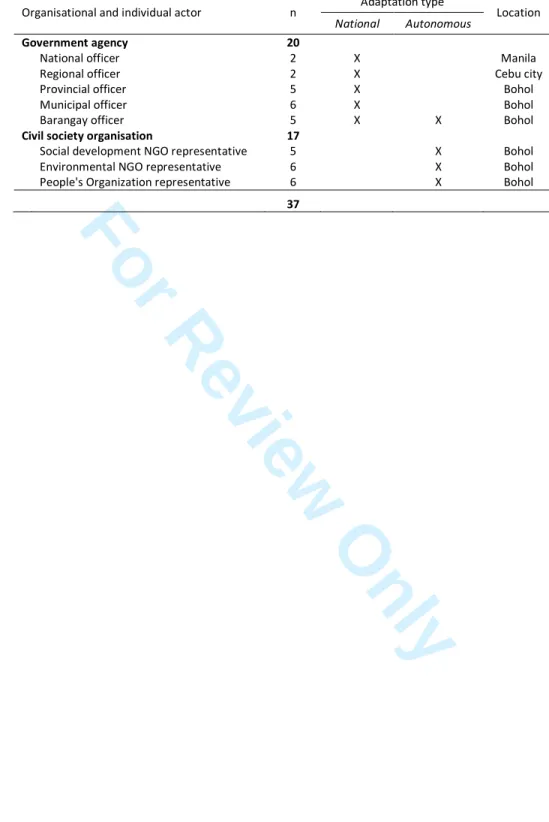
The methodology was implemented with a purposeful sample of 37 respondents from 174
government agencies and civil society organisations during August and September 2013 (Table 175
1). Main respondents surveyed were from both the fields of planning and development in the 176
province of Bohol. Complementarily, associated respondents from higher levels of the planning 177
hierarchy were considered at the regional and national levels for their involvement in 178 3 4 5 6 7 8 9 10 11 12 13 14 15 16 17 18 19 20 21 22 23 24 25 26 27 28 29 30 31 32 33 34 35 36 37 38 39 40 41 42 43 44 45 46 47 48 49 50 51 52 53 54 55 56 57 58 59
For Review Only
mainstreaming climate change adaptation into local development planning. Q-sorts were 179
administered under the condition of an unconstraint sort, i.e. no particular statistical distribution 180
was forced on the rating of statements (Barry & Proops, 1999; McKeown & Thomas, 1988). 181
During the sorting exercise, subsidiary open questions were asked in order to discuss 182
respondents’ choices. Q-sorts lasted 43 minutes on average. 183
184
Table 1. 185
186
The third step involved the sequential application of three sets of statistical procedures, i.e.: 187
correlation, factor or principal component (PCA) analysis, and the computation of factor scores 188
(see Robbins, 2005; Zabala, 2014). Following the Q-method, a PCA analysis was carried out on 189
a data matrix with the 37 Q-sorts as variables (columns) and all statements as sample elements 190
(rows) with the aim to group respondents on the basis of the degree of commonality of their 191
viewpoints on statements. Then, factors were extracted by retaining those with both theoretical 192
and statistical significance in order to perform the Q-method reflexively with “full awareness of its 193
interpretive dimensions and not as a number-crunching exercise” (Eden, Donaldson, & Walker, 194
2005, p.421). To achieve this, Brown (1980's) criteria which retains factors containing at least two 195
loadings in excess of the 0,01 or 0,05 level of significance was used. Besides, a Promax rotation 196
(see Abdi, 2003) was performed on the Q matrix in order to facilitate data interpretability 197
198
Fourth, factors were interpreted as social perspectives by selecting defining Q-sorts or “like-199
minded individuals” (Pini, Previte, & Haslam-McKenzie, 2007, p.8) loading significantly on the 200
same factor3. 201
Factors are “attitudes of mind” (Stephenson, 1965, p.281) held in common by several 202
respondents. In order to inform their interpretation, coded interview transcripts were essential in 203
eliciting the rationale of respondents’ viewpoint. In total, 27h27 minutes of audio records were 204
transcribed and an average number of 32 comments per statement were extracted for 205
interpretation. 206
207
Implementing the Q-method is of particular interest for capturing actors’ viewpoints on climate 208
change adaptation as it allows going beyond methodological individualism, i.e. the view that 209
social events must be explained by reducing them to individual actions, and accounting for the 210
post-structuralist assumption that meaning and action in development planning are made of 211
systemic relations between individuals and underlying structures (Murdoch, 2006). The power of 212
the Q-method lies in the determination of social perspectives reflecting a totality or gestalt that is 213
greater than the sum of the part. As Brown (1980, p.14) explains, one of the core features of the 214
Q factor analysis is that “it is more gestaltist and wholistic, rather than analytic and atomistic, and 215
reflects functional relatedness”, meaning that individual’s viewpoint is captured in accordance 216
with its relation to the whole context of which it is a part. In other words, the method overcomes 217
the distinction between apparent forms of reality from respondents’ speech and essential 218
underlying, constitutive structures and relations between these and their organizations for 219
instance. In the next section, we detail the results obtained after implementing this four-step 220
analysis. 221
3
‘Defining sorts’ were identified in this study according to two conditions: (i) the 5% level of significance, and (ii) the condition that the factor explains more than half of the common variance.
3 4 5 6 7 8 9 10 11 12 13 14 15 16 17 18 19 20 21 22 23 24 25 26 27 28 29 30 31 32 33 34 35 36 37 38 39 40 41 42 43 44 45 46 47 48 49 50 51 52 53 54 55 56 57 58 59
For Review Only
4. Results
222 223
Four social perspectives could be extracted from the dataset drawing upon experience in the 224
field, a careful statistical examination of data, and interview transcripts. The PCA yielded four 225
factors accounting respectively for 18,5%, 14,0%, 13,6%, 8,2% of the explained variance. In 226
total, 8 out of 37 participants have significant loadings on factor 1, 8 on factor 2, 9 on factor 3 and 227
3 on factor 4 (see Table 2). Factors are all positively correlated suggesting a convergence of 228
respondent’s viewpoints on the concourse of statements. As a result, the four factors extracted 229
represent social perspectives that are divergent but not opposite to each other. Two factors, F1 230
and F3, have the strongest correlation (0,798), while F2 and F4 are the most weakly correlated 231
(0,331). In Q-method, this further suggests that respondents defining F1 and F3 share closer 232
viewpoints, while F2 and F4 tend to present more differentiated ones. 233
234
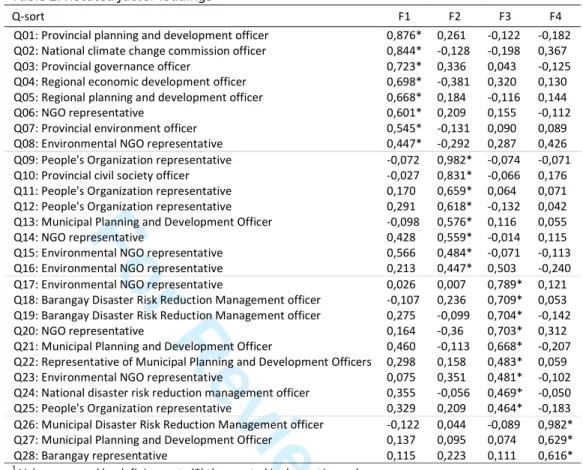
Table 2 presents the factors in which the entries in the table are called factor loadings. The latter 235
represent the extent to which a respondent is associated with a particular factor. As Table 2 236
shows, the highest significant factor loading of F1 (0,876) belongs to a Provincial planning and 237
development officer (Q01) and thus contributes the most to characterize the first social 238
perspective associated with F1, named “the institutional perspective”. Most defining sorts on this 239
factor are provincial, regional and national officers from government agencies. Their structural 240
position within the organisational hierarchy of planning allows providing plausible explanations for 241
attitudes of mind held in common. However, not all government officers load highest on F1, and 242
two Q-sorts from NGO representatives loaded significantly on this factor (Q06 and Q08). 243
244
Table 2 245
246
Table 3 presents per factor the weighted scores for each statement. These scores are calculated 247
and normalized as factor scores (abbreviated ‘z-scores’). They are subsequently converted into 248
rank statement scores for ease of interpretation, i.e. factor scores are expressed in terms of the 249
original Q frequency distribution of (-3, -2, -1, 0, 1, 2, 3). The array of factor scores show the best 250
model for the perspective and represent a summary of “significantly different assemblages of 251
claims” (Robbins & Krueger, 2000, p.639). Likewise, each perspective represents a coherent 252
pattern of opinion about climate change, adaptation, and planning practices in the Philippines. 253
Within the next sections, the four social perspectives identified are empirically determined by 254
describing the factor in the language of the Q-statements and the arguments used by 255
respondents to justify their claims. 256
257
Table 3 258
259
4.1. The institutional perspective
260 261
F1 represents an institutional perspective that supports planned adaptation by highly valuing a 262
strong role of government institutions, including through the mainstreaming climate change 263
adaptation into local development planning. 264
265
Several significantly different statements characterize the institutional perspective, the most 266
prominent of which pertains to the role of governments compared to NGOs for building adaptive 267
capacity. A legitimization of government’s role is expressed in the negative ranking of statement 268 3 4 5 6 7 8 9 10 11 12 13 14 15 16 17 18 19 20 21 22 23 24 25 26 27 28 29 30 31 32 33 34 35 36 37 38 39 40 41 42 43 44 45 46 47 48 49 50 51 52 53 54 55 56 57 58 59
For Review Only
20 (see S20 in Table 3, z=-1,07). In this perspective, NGOs are seen as lacking resources for 269
initiating and sustaining capacity building initiatives. When considering the elaboration of climate 270
change adaptation plans, a climate change officer (see Q02 in Table 2, F1=0,844) for instance 271
explains that NGOs need the technical expertise from governments which are the “data 272
producer” of climate change knowledge. 273
274
Besides, such a pro-government perspective is supported by the idea that governments can 275
better implement and sustain lasting changes over society than NGOs. This is supported by 276
several assertions arguing that governments are the regulatory bodies with authority on people 277
over the long run because “governments have the power” (Q01) and “make people abide with the 278
laws” (Q03). 279
280
The institutional perspective is then further expressed in the negative ranking of statement 2 281
which claims that one cannot go against nature. Respondents who load highly on F1 strongly 282
believe something can be done about climate change in such a way that “once you are prepared 283
you are less likely to be affected” (Q07). In this regard, it emphasizes the potential role of 284
mitigation measures to lessen the negative impacts of disasters. In particular, the institutional 285
perspective advocates for a greater mainstreaming of climate change adaptation at the local level 286
through the involvement of both LGUs and individuals, as well as more pro-activity in order to 287
minimize hazard damages (S19, S23, S27). 288
289
Furthermore, the institutional perspective distinctively rejects the idea that climate change is only 290
a threat (S12). Contrary to all three other factors, this perspective considers that benefits exist. 291
One provincial environment officer (Q07) exemplifies the negative score given to this claim telling 292
that climate change is positive for agriculture in the Bohol province, especially rice crops 293
production. Increasing rainfalls may offer the opportunity for farmers to plant four times a year 294
instead of two traditionally, which becomes particularly true for rain fed paddies. In addition, F1 295
loaders consider that climate change can also induce a change in perceptions and attitudes 296
regarding the environment. Taking the example of plastics segregation (instead of dumping or 297
burning), an environmental NGO representative (Q08) further explains that climate change is 298
changing how people do things, their perspectives, attitudes and values regarding the 299
environment. 300
301
4.2. The grassroots perspective
302 303
F2 is a grassroots perspective that supports autonomous adaptation by highly valuing the 304
environment and the need for meeting basic needs. It values a reactive, self-reliant attitude 305
towards disaster risks. This factor is built by three representatives of PO, three NGO workers 306
(two from environmental NGOs, and one from a social development NGO), and two government 307
officers from the municipal and provincial level. 308
309
A major component of the grassroots perspective is a strong concern for the environment, which 310
is evident in the high ranking of statement 3 stating that ‘Mother Nature’ should be protected for 311
preventing devastating calamities. Along with this environmentalist stance, the grassroots 312
perspective is characterized by a strong agreement regarding the idea that one cannot go 313
against nature (S02). A PO representative (Q11) justifies a high score by claiming that “Nature 314
cannot be hold” and will always have the last say. In the case of typhoon for instance, 315 3 4 5 6 7 8 9 10 11 12 13 14 15 16 17 18 19 20 21 22 23 24 25 26 27 28 29 30 31 32 33 34 35 36 37 38 39 40 41 42 43 44 45 46 47 48 49 50 51 52 53 54 55 56 57 58 59
For Review Only
respondents often refer to the strength of the meteorological event, as well as the random 316
character of its path. 317
318
In the light of climate change perception, F2 loaders claim observing coastal erosion due to 319
strong winds, heavy rain, or soil extraction (S06). However, none blame climate change or 320
explicitly voice a relationship between those two phenomena. Meanwhile, the strong agreement 321
regarding the statistically significantly statement 17 emphasizes a close association between 322
climate change adaptation and DRRM activities, which suggests that F2 loaders have a lower 323
awareness regarding the challenge of climate change. In any event, respondents loading highly 324
on F2 differ from all other factors by strongly agreeing that climate change brings only negative 325
benefits such as “disasters” or “calamities” (S12). 326
327
The grassroots perspective is also characterised by the highest ranking of the statement claiming 328
that more urgent problems exist than climate change (S13). It is sustained by the idea that 329
people will take measures against climate change only if they are badly affected (S14). For one 330
PO representative (Q12), a “day-by-day” way of living along with a “wait and see” attitude makes 331
common sense. 332
333
In terms of approach to adaptation and planning practices, the grassroots perspective is 334
characterized by a stronger reliance upon technical and scientific knowledge for addressing 335
climate risks. Regarding climate risk assessment, this perspective distinctively supports that 336
hazard maps should be made by external experts, not by local people (S30). Respondents 337
loading highly on F2 see the former as “the ones telling which area is dangerous” (Q11). Along 338
with this stance, F2 does not value the importance of asking local people to recall past severe 339
weather events as much as all other factors (S29). Meanwhile, F2 also stands out from all other 340
factors by a self-reliant attitude regarding disaster response, particularly given the positive score 341
attributed to statement 22. Based on their experience, F2 loaders comment that the community is 342
faster than LGUs because it is the first one affected, and thus the first one to respond. 343
344
4.3. The developmental perspective
345 346
F3 represents a developmental perspective that supports planned adaptation, but advocates for 347
a strong role of individuals and local community actors in planning practices. This factor is built 348
upon the viewpoint of five government officers from the barangay, municipal, and national level, 349
three NGO workers, and one PO representative. The developmental perspective is positively 350
correlated with the institutional perspective (p=0,798), but differs by a stronger commitment for 351
social development. 352
353
F3 comes into a developmental perspective with statement 15 that advocates for improved living 354
conditions in order to face climate change impacts. A municipal officer (Q22) scored this 355
statement positively, arguing that one may be more adaptive if basic needs are satisfied. 356
Respondents from the NGO sector in turn further argue that improved quality of life would allow 357
“co-opting more easily with the effects of disasters” (Q20), “mak[ing] relocation easier” (Q17) in 358
case of disasters, increasing people participation to DRRM activities, and improving community 359 resilience in general. 360 361 3 4 5 6 7 8 9 10 11 12 13 14 15 16 17 18 19 20 21 22 23 24 25 26 27 28 29 30 31 32 33 34 35 36 37 38 39 40 41 42 43 44 45 46 47 48 49 50 51 52 53 54 55 56 57 58 59
For Review Only
Besides, the developmental perspective strongly believes that projects from NGOs can be 362
sustained (S21). One Municipal planning and development officer for instance explains that many 363
NGO based projects are still running within his municipality today. In his view, reasons for such a 364
success belong to the project design which should be prepared with both the community and the 365
local government. Projects with “strong sustainability factors” (Q21) will be ensured to be 366
institutionalized at both the Municipality and the Barangay level. While the developmental 367
perspective values NGOs’ work, it also strongly values, along with the institutional perspective, 368
the role of Barangays in responding to climate change impacts and improving adaptive capacity 369
(S19). 370
371
Another major characteristic of F3 is an approach to adaptation valuing the role of individuals and 372
local community actors. This is represented by the negative ranking of the distinguishing 373
statement which claims that people will take measures against climate change only if they are 374
badly affected (S14). One municipal officer (Q21) justifies his view by claiming that people’s 375
awareness regarding DRRM and CCA has improved compared to 20 years ago. This belief in 376
individuals’ capacity for mobilization is also highlighted within this perspective through the idea 377
that local citizens do know about the challenge of climate change (S25). In this regard, it 378
positively values the integration of local knowledge in climate risk assessment (S31). A NGO 379
worker (Q20) for instance gave this statement a positive score by reporting that local 380
communities can mark water levels on their house in order to monitor and make comparisons 381
from one year to another. 382
383
Lastly, F3 is a pro-planning, but anti-hard measures approach to climate change adaptation. The 384
developmental perspective strongly supports the formulation and implementation of plans for 385
reducing climate risks (S26), but poorly values hard adaptation measures by distinctively 386
supporting that building dikes and sea walls is not a long-term solution (S34). 387
388
4.4. The physical planning perspective
389 390
F4 is a physical planning perspective that supports planned adaptation by emphasizing the 391
importance of spatial planning practices (including building hazard mitigating infrastructures and 392
land use zoning). It is driven by a strong awareness of local disaster risk management issues and 393
the need for urgent, technical responses to current climate change impacts. This factor is 394
represented by two local government officers (one municipal planning and development officer 395
and one barangay officer) involved in the implementation of disaster risk reduction and 396
management plans, and one PO representative from an island Barangay experiencing increasing 397
tide heights. 398
399
A first major component of F4 is to highly value spatial planning measures for addressing climate 400
risks. F4 presents statistically significant rankings for several statements promoting land use 401
zoning measures and hazard-mitigating infrastructures. Firstly, the statement claiming that land 402
use measures like zoning will prevent from natural hazards received a distinguishing positive 403
score (S32). As a zoning officer, one respondent from a municipal government (Q27) referred to 404
the municipality’s land use plan and zoning ordinance, arguing that all plans should integrate 405
disaster risk prone areas. In line with this pro-land use zoning perspective on climate change 406
adaptation, F4 loaders consider that relocation is one of the best options to avoid floods (S38). 407
Then, the physical planning perspective on adaptation is also determined by the ranking of 408 3 4 5 6 7 8 9 10 11 12 13 14 15 16 17 18 19 20 21 22 23 24 25 26 27 28 29 30 31 32 33 34 35 36 37 38 39 40 41 42 43 44 45 46 47 48 49 50 51 52 53 54 55 56 57 58 59
For Review Only
statements addressing the development of hazard-mitigating infrastructures (S35, S36, and S37). 409
Respondents loading significantly on F4 justified their answers arguing that sea walls can help 410
prevent floods, that better roads should be built, and that building well-designed sewerage 411
systems will prevent the risk of flood. 412
413
A second major component of F4 is a moderate account for individuals and communities’ role in 414
climate change adaptation. F4 presents a low agreement on the statement advocating more 415
participation from local communities in disaster preparedness activities (S23). This stance comes 416
into sharp perspective by disagreeing about the idea that community responses to calamities are 417
faster and more efficient than LGUs responses (S22). One municipal officer (Q27) explains his 418
score telling that communities must be trained to be efficient. The physical planning perspective, 419
however, is well grounded in local socio-economic and environmental realities. These distinct 420
characteristics rely upon several significantly different claims: that devastating calamities did exist 421
30 year ago; that improving living conditions is essential in order to address climate risks; and 422
that plans should be initiated at the barangay level but are useless if they are not coordinated 423
with higher government levels (S05, S15, and S28). 424
5. Discussion
425 426
Actors’ viewpoints on climate change adaptation and planning practices are held across four 427
empirically determined social perspectives. These perspectives present a high shared meaning, 428
which was illustrated by the positive and relatively high correlation between factors scores. This 429
is an evidence of major commonalities between perspectives that reflect a common interest or 430
culture-wide understanding among actors from the field of development planning regarding 431
climate change adaptation in the Philippines. The four social perspectives hold a common 432
agreement upon the idea that climate change is a reality impacting many different sectors that 433
should be addressed pro-actively (see consensus statements 9, 11 and 24). Besides, 434
development planning is an activity positively valued within each social perspective. In particular, 435
participatory approaches with multiple actors are supported among all perspectives for 436
implementing inclusive planning practices (S27 and S23). In this regard, results are consistent 437
with the observation of Few et al. (2007) that discourses of inclusive governance advocating 438
participation are widespread among actors involved in climate change adaptation. 439
440
Yet, results also suggest more complexity in implementing adaptation strategies than 441
commonalities among perspectives first indicate. Along with Pelling's (2011) observation about 442
the existence of multiple actors’ viewpoints on how to adapt, the four social perspectives 443
identified provide evidence that actors from the field of development planning in the Philippines 444
do hold divergent viewpoints when it comes to frame climate change adaptation and prioritize 445
planning activities. While addressing climate change and building inclusive planning practices is 446
commonly valued as a desired end, differences between perspectives emerge when considering 447
the means of implementing adaptation processes through planning practices. In particular, 448
perspectives present major differences regarding how multiple actors should be involved in 449
planning activities. This can best be exemplified by differences among the physical planning and 450
grassroots perspectives. 451
452
Although the physical planning perspective acknowledges the importance of participatory 453
approaches, it holds a critical attitude towards community’s adaptive capacity by supporting the 454 3 4 5 6 7 8 9 10 11 12 13 14 15 16 17 18 19 20 21 22 23 24 25 26 27 28 29 30 31 32 33 34 35 36 37 38 39 40 41 42 43 44 45 46 47 48 49 50 51 52 53 54 55 56 57 58 59
For Review Only
idea that individual actors cannot address climate risks without being trained and prepared to be 455
efficient. By contrast, the grassroots perspective does not consider governments as essential for 456
enacting adaptation. In terms of disaster responses for instance, this perspective promotes 457
adaptive strategies that build upon community’s role and the “Bayanihan system” (i.e. a Filipino 458
expression designing a spirit or attitude of communal unity to achieve a particular objective). 459
Such a differing prioritization regarding the role of community and government actors in planning 460
practices thus provide evidence that divergent adaptation strategies may emerge among actors 461
from the field of development planning. 462
463
These findings contribute characterizing how development planning can guide adaptation 464
thinking in at least two ways. First, results highlight that the four social perspectives identified 465
among development actors in the Philippines support differently the two main forms of adaptation 466
(planned and autonomous) commonly identified in the climate change literature (Agard et al., 467
2014; Hedger et al., 2011). The grassroots perspective supports autonomous adaptation and the 468
physical planning perspective highly supports planned adaptation. Yet, the institutional 469
perspective only advocates for planned adaptation to a lesser extent, and the development 470
perspective supports both planned and autonomous adaptation strategies. In order to strengthen 471
adaptive capacity, this suggests it is also essential to appraise development planning not only as 472
a two-way process where planned and autonomous forms of adaptation may compete as 473
divergent adaptation strategies, but also as a process driven by actors that combine those two 474
approaches to adaptation in creative ways. 475
476
Second, each social perspective offers an essential starting point to foster the development of 477
adaptation strategies involving multiple actors across scales. Although Resurreccion et al. (2008) 478
pointed a mismatch between national and local level realities in the Philippines, results suggest 479
shared viewpoints exist among actors from multiple levels of the planning hierarchy. The social 480
perspectives identified both divide organisations and cut across boundaries between 481
organisational structures: each of the four social perspectives identified comprises actors from 482
both government agencies and civil society organisations at the national and local level. An 483
actor’s structural position thus should not be considered as a single predictor of any form of 484
adaptation (neither planned nor autonomous). On the contrary, this suggests that development 485
planning has the capacity to develop processes that incorporate a priori distant levels of 486
individual and organisational actors. 487
488
Finally, while focusing on governments and civil society organisations among the formal planning 489
system in the Philippines proved being useful for investigating how development planning can 490
strengthen adaptive capacities, this research further highlights the need to expand the analysis 491
on actors from the informal domain. These may include actors from informal settlements or the 492
most vulnerable communities and households non-represented by formal civil society 493
organisations. Understanding their viewpoints and see how much these may relate to the four 494
perspectives extracted within this study would help better understand the extent to which the 495
adaptation strategies valued by formal actors may be accepted and effectively implemented 496
among these populations. In this regard, the continued use of Q-method is supported as a useful 497
qualitative and quantitative research technique allowing the engagement of multiple types of 498
actors in novel ways. 499 3 4 5 6 7 8 9 10 11 12 13 14 15 16 17 18 19 20 21 22 23 24 25 26 27 28 29 30 31 32 33 34 35 36 37 38 39 40 41 42 43 44 45 46 47 48 49 50 51 52 53 54 55 56 57 58 59
For Review Only
6. Conclusion
500 501
This paper aimed at capturing multiple social perspectives on climate change adaptation and 502
planning practices across the organisational hierarchy of planning in the Philippines, and 503
examined whether commonalities and differences among these perspectives may lead towards 504
divergent or convergent adaptation strategies. Four empirically significant social perspectives 505
were determined – institutional, grassroots, developmental, and physical planning – using Q-506
method, an intensive and quantitative technique. Major differences and commonalities between 507
perspectives were highlighted, in addition to actors’ arguments used to justify claims. These 508
social perspectives are characterized by several distinctive stances regarding climate change 509
adaptation and planning practices in the Philippines. 510
511
First, the institutional perspective values the role of government institutions for mainstreaming 512
climate change adaptation into local development planning. Second, the grassroots perspective 513
gives more prominence to environmental protection and the need for meeting basic needs, along 514
with a self-reliant attitude towards disaster risks. Third, the developmental perspective advocates 515
for the role of individuals and local community actors in planning practices. Fourth, the physical 516
planning perspective values the importance of spatial planning measures (including building 517
hazard mitigating infrastructures and land use zoning) and emphasizes the need for urgent, 518
technical responses to current climate change impacts. 519
520
Results contribute filling a knowledge gap in the literature on the need to develop approaches 521
that can guide adaptation thinking in development planning. They first provide evidence that 522
differentiated viewpoints on climate change and planning practices may lead to divergent 523
adaptation strategies (e.g. through a differing prioritization regarding the role of community and 524
government actors). Yet, the four social perspectives identified also suggest that shared 525
adaptations may emerge both among actors from multiple organizational structures and across 526
the organisational hierarchy of planning. 527
528
In terms of policy and practice, this highlights the need for developing approaches that facilitate 529
the inclusion of these multiple perspectives. In particular, development planning should continue 530
to focus on building learning processes that bring around the table multiple actors with diverse 531
values and worldviews for developing a common understanding on how to strengthen adaptive 532
capacities. This calls for directing attention to negotiations and the creation of spaces for the 533
emergence of cross-scale relationships and shared power between actors. More than accounting 534
for the multiplicity of viewpoints, development planning requires creating participatory venues for 535
negotiation and sharing decision-making through collaborative actions. One example is creating 536
participatory planning mechanisms that ensure the inclusion of actors from all levels of the 537
planning hierarchy, rather than solely relying upon scientific and government actors for instance. 538
When accounting for cross-scales relationships among actors and creating new spaces of shared 539
meaning and action, development planning becomes a promising candidate for strengthening 540
adaptive capacities and delivering more effective responses to climate change. 541 3 4 5 6 7 8 9 10 11 12 13 14 15 16 17 18 19 20 21 22 23 24 25 26 27 28 29 30 31 32 33 34 35 36 37 38 39 40 41 42 43 44 45 46 47 48 49 50 51 52 53 54 55 56 57 58 59
For Review Only
References
Abdi, H. (2003). Factor rotations in factor analyses. In M. Lewis-Beck, A. Bryman, & T. Futing (Eds.), Encyclopedia of social science research methods (pp. 792-795). Thousand Oaks: Sage.
Adger, W. N., Arnell, N. W., & Tompkins, E. L. (2005). Successful adaptation to climate change
across scales. Global Environmental Change, 15(2), 77-86.
doi:10.1016/j.gloenvcha.2004.12.005
Agard, J., Schipper, E. L. F., Birkmann, J., Campos, M., Dubeux, C., Nojiri, Y., . . . Bilir, T. E. (2014). Annex II: Glossary. In V. R. Barros, C. B. Field, D. J. Dokken, M. D. Mastrandrea, K. J. Mach, T. E. Bilir, M. Chatterjee, K. L. Ebi, Y. O. Estrada, R. C. Genova, B. Girma, E. S. Kissel, A. N. Levy, S. MacCracken, P. R. Mastrandrea, & L. L. White (Eds.), Climate
Change 2014: Impacts, Adaptation, and Vulnerability. Part B: Regional Aspects. Contribution of Working Group II to the Fifth Assessment Report of the Intergovernmental Panel on Climate Change (pp. 1757-1776). Cambridge, United Kingdom and New York,
NY, USA: Cambridge University Press.
AKP (2012) Desktop study on assessment of capacity gaps and needs of South East Asia
countries in addressing impacts, vulnerability and adaptation to climate variability and climate change. Regional Climate Change Adapatation Knowledge Platform for Asia:
Thailand.
Bardsley, D. K., & Sweeney, S. M. (2010). Guiding climate change adaptation within vulnerable natural resource management systems. Environmental Management, 45(5), 1127-1141. Barry, J., & Proops, J. (1999). Seeking sustainability discourses with Q methodology. Ecological
Economics, 28(3), 337-345.
Birkmann, J., Welle, T., Krause, D., Wolfertz, J., Suarez, D. C., & Setiadi, N. (2011). World risk index: Concept and results. In ADW & UNU-IEHS (Eds.), World risk report 2011 (pp. 13-43). Berlin: Alliance Development Works.
Blanco, H., Alberti, M., Forsyth, A., Krizek, K. J., Rodríguez, D. A., Talen, E., & Ellis, C. (2009). Hot, congested, crowded and diverse: Emerging research agendas in planning. Progress
in Planning, 71(4), 153-205. doi:10.1016/j.progress.2009.03.001
Brown, S. R. (1980). Political subjectivity: Applications of Q methodology in political science. New Haven: Yale University Press.
Bulkeley, H., & Betsill, M. (2005). Rethinking sustainable cities: Multilevel governance and the 'urban'politics of climate change. Environmental politics, 14(1), 42-63.
Cañares, M. (2014) Briefing: Assessing open governance data in Bohol. STEP UP Consulting: Bohol. 1 p.
Capili, E. B., Ibay, A. C. S., & Villarin, J. R. T. (2005, 19-23 September). Climate change impacts
and adaptation on Philippine coasts. Paper presented at the Proceedings of the
International Oceans 2005 Conference, Washington D.C, USA.
Cash, D. W., & Moser, S. C. (2000). Linking global and local scales: designing dynamic assessment and management processes. Global Environmental Change, 10(2), 109-120. Corfee-Morlot, J., Cochran, I., Hallegatte, S., & Teasdale, P.-J. (2011). Multilevel risk governance
and urban adaptation policy. Climatic change, 104(1), 169-197.
Cutter, S., Osman-Elasha, B., Campbell, J., Cheong, S.-M., McCormick, S., Pulwarty, R., . . . Ziervogel, G. (2012). Managing the risks from climate extremes at the local level. In C. B. Field, V. Barros, T. F. Stocker, D. Qin, D. J. Dokken, K. L. Ebi, M. D. Mastrandrea, K. J. Mach, G.-K. Plattner, S. K. Allen, M. Tignor, & P. M. Midgley (Eds.), A special report of
working groups I and II of the Intergovernmental Panel on Climate Change (IPCC) (pp.
291-338). Cambridge: Cambridge University Press.
DILG (2008) Rationalizing the Local Planning System: A Source Book. Department of the Interior and Local Government: Bureau of Local Government Development: Quezon City, Philippines. 3 4 5 6 7 8 9 10 11 12 13 14 15 16 17 18 19 20 21 22 23 24 25 26 27 28 29 30 31 32 33 34 35 36 37 38 39 40 41 42 43 44 45 46 47 48 49 50 51 52 53 54 55 56 57 58 59
For Review Only
Eden, S., Donaldson, A., & Walker, G. (2005). Structuring subjectivities? Using Q methodology in human geography. Area, 37(4), 413-422.
Engle, N. L., & Lemos, M. C. (2010). Unpacking governance: building adaptive capacity to climate change of river basins in Brazil. Global Environmental Change, 20(1), 4-13. Few, R., Brown, K., & Tompkins, E. L. (2007). Public participation and climate change
adaptation: Avoiding the illusion of inclusion. Climate policy, 7(1), 46-59.
Friedmann, J. (1987). Planning in the public domain: From knowledge to action: Princeton University Press.
Füssel, H.-M. (2007). Adaptation planning for climate change: concepts, assessment approaches, and key lessons. Sustainability science, 2(2), 265-275.
Hall, P. (1982). Urban and Regional Planning (3rd ed.). London: George Allen & Unwin.
Hedger, M., Moench, M., Dixit, A., Kaur, N., & Anderson, S. (2011) Approaches to planning for
climate change: Bridging concepts and practice for low carbon climate resilient development. Institute of Development Studies: Brighton. 39 p.
Huntjens, P., Lebel, L., Pahl-Wostl, C., Camkin, J., Schulze, R., & Kranz, N. (2012). Institutional design propositions for the governance of adaptation to climate change in the water sector. Global Environmental Change, 22(1), 67-81.
IDS. (2010, 18-19 May). Strengthening climate resilience: Philippines national consultation. Paper presented at the Proceedings of the First National Consultation on Strengthening Climate Resilience in the Philippines, Quezon City, Philippines.
Inderberg, T. H., Eriksen, S., O'Brien, K., & Sygna, L. (2014). Climate change adaptation and
development: Transforming paradigms and practices. London: Routledge.
Leck, H., & Simon, D. (2013). Fostering multiscalar collaboration and co-operation for effective governance of climate change adaptation. Urban Studies, 50(6), 1221-1238.
McKeown, B., & Thomas, D. (1988). Q methodology. Newbury Park (CA): Sage.
Murdoch, J. (2006). Post-structuralist Geography: a Guide to Relational Space. London, UK: SAGE Publications.
O'Brien, K. (2009). Do values subjectively define the limits to climate change adaptation? In W. N. Adger, I. Lorenzoni, & K. L. O'Brien (Eds.), Adapting to climate change: Thresholds,
values, governance (pp. 164-180). Cambridge: Cambridge University Press.
O'Brien, K., & Selboe, E. (2015). The Adaptive Challenge of Climate Change: Cambridge University Press.
Pelling, M. (2011). Adaptation to climate change: from resilience to transformation. London: Routledge.
Pini, B., Previte, J., & Haslam-McKenzie, F. (2007). Stakeholders, natural resource management and Australian rural local governments: A Q methodological study. Local Government
Studies, 33(3), 427-449.
Potter, R. B. (1985). Urbanisation and planning in the third world: Spatial perceptions and public
participation. London: Routledge.
Pugh, J., & Potter, R. B. (2003). Participatory planning in the Caribbean-lessons from practice: Ashgate Publishing Ltd.
Resurreccion, B. P., Sajor, E. E., & Fajber, E. (2008) Climate adaptation in Asia: Knowledge
gaps and research issues in South East Asia. ISET-International and ISET-Nepal:
Kathmandu.
Rincón, M. F. G., & Virtucio, F. K. (2008, June). Climate change in the Philippines: A contribution
to the country environmental analysis. Paper presented at the Proceedings of the Country
Environmental Analysis Consultative Workshops, Manila, Philippines.
Robbins, P. (2005). Q methodology. Encyclopedia of social measurement, 3, 209-215.
Robbins, P., & Krueger, R. (2000). Beyond bias? The promise and limits of Q method in human geography. The Professional Geographer, 52(4), 636-648.
Shaw, A., Sheppard, S., Burch, S., Flanders, D., Wiek, A., Carmichael, J., . . . Cohen, S. (2009). Making local futures tangible—synthesizing, downscaling, and visualizing climate change scenarios for participatory capacity building. Global Environmental Change, 19(4), 447-463.
Stephenson, W. (1935). Technique of factor analysis. Nature.
3 4 5 6 7 8 9 10 11 12 13 14 15 16 17 18 19 20 21 22 23 24 25 26 27 28 29 30 31 32 33 34 35 36 37 38 39 40 41 42 43 44 45 46 47 48 49 50 51 52 53 54 55 56 57 58 59
For Review Only
Stephenson, W. (1965). Perspectives in Psychology: Definition of opinion, attitude, and belief.
Psychological Record, 15(2), 281-288.
Van Aalst, M. K. (2006). The impacts of climate change on the risk of natural disasters.
Disasters, 30(1), 5-18.
Yohe, G. W., Lasco, R. D., Ahmad, Q. K., Arnell, N. W., Cohen, S. J., Hope, C., . . . Perez, R. T. (2007). Perspectives on climate change and sustainability. In M. L. Parry, O. F. Canziani, J. P. Palutikof, P. J. van der Linden, & C. E. Hanson (Eds.), Climate change 2007:
Impacts, adaptation and vulnerability. Contribution of working group II to the fourth assessment report of the Intergovernmental Panel on Climate Change (IPCC) (pp.
811-841). Cambridge, UK: Cambridge University Press.
Zabala, A. (2014). qmethod: A package to explore human perspectives using Q methodology.
The R Journal, 6(2), 1-11. 3 4 5 6 7 8 9 10 11 12 13 14 15 16 17 18 19 20 21 22 23 24 25 26 27 28 29 30 31 32 33 34 35 36 37 38 39 40 41 42 43 44 45 46 47 48 49 50 51 52 53 54 55 56 57 58 59
For Review Only
Table 1.: Respondent characteristics
Organisational and individual actor n Adaptation type Location
National Autonomous
Government agency 20
National officer 2 X Manila Regional officer 2 X Cebu city Provincial officer 5 X Bohol Municipal officer 6 X Bohol Barangay officer 5 X X Bohol
Civil society organisation 17
Social development NGO representative 5 X Bohol Environmental NGO representative 6 X Bohol People's Organization representative 6 X Bohol
37 3 4 5 6 7 8 9 10 11 12 13 14 15 16 17 18 19 20 21 22 23 24 25 26 27 28 29 30 31 32 33 34 35 36 37 38 39 40 41 42 43 44 45 46 47 48 49 50 51 52 53 54 55 56 57 58 59
For Review Only
Table 2. Rotated factor loadings1
Q-sort F1 F2 F3 F4
Q01: Provincial planning and development officer 0,876* 0,261 -0,122 -0,182 Q02: National climate change commission officer 0,844* -0,128 -0,198 0,367 Q03: Provincial governance officer 0,723* 0,336 0,043 -0,125 Q04: Regional economic development officer 0,698* -0,381 0,320 0,130 Q05: Regional planning and development officer 0,668* 0,184 -0,116 0,144 Q06: NGO representative 0,601* 0,209 0,155 -0,112 Q07: Provincial environment officer 0,545* -0,131 0,090 0,089 Q08: Environmental NGO representative 0,447* -0,292 0,287 0,426 Q09: People's Organization representative -0,072 0,982* -0,074 -0,071 Q10: Provincial civil society officer -0,027 0,831* -0,066 0,176 Q11: People's Organization representative 0,170 0,659* 0,064 0,071 Q12: People's Organization representative 0,291 0,618* -0,132 0,042 Q13: Municipal Planning and Development Officer -0,098 0,576* 0,116 0,055 Q14: NGO representative 0,428 0,559* -0,014 0,115 Q15: Environmental NGO representative 0,566 0,484* -0,071 -0,113 Q16: Environmental NGO representative 0,213 0,447* 0,503 -0,240 Q17: Environmental NGO representative 0,026 0,007 0,789* 0,121 Q18: Barangay Disaster Risk Reduction Management officer -0,107 0,236 0,709* 0,053 Q19: Barangay Disaster Risk Reduction Management officer 0,275 -0,099 0,704* -0,142 Q20: NGO representative 0,164 -0,36 0,703* 0,312 Q21: Municipal Planning and Development Officer 0,460 -0,113 0,668* -0,207 Q22: Representative of Municipal Planning and Development Officers 0,298 0,158 0,483* 0,059 Q23: Environmental NGO representative 0,075 0,351 0,481* -0,102 Q24: National disaster risk reduction management officer 0,355 -0,056 0,469* -0,050 Q25: People's Organization representative 0,329 0,209 0,464* -0,183 Q26: Municipal Disaster Risk Reduction Management officer -0,122 0,044 -0,089 0,982* Q27: Municipal Planning and Development Officer 0,137 0,095 0,074 0,629* Q28: Barangay representative 0,115 0,223 0,111 0,616*
1
Values grouped by defining sorts (*) then sorted in decreasing order
3 4 5 6 7 8 9 10 11 12 13 14 15 16 17 18 19 20 21 22 23 24 25 26 27 28 29 30 31 32 33 34 35 36 37 38 39 40 41 42 43 44 45 46 47 48 49 50 51 52 53 54 55 56 57 58 59