RESEARCH OUTPUTS / RÉSULTATS DE RECHERCHE
Author(s) - Auteur(s) :
Publication date - Date de publication :
Permanent link - Permalien :
Rights / License - Licence de droit d’auteur :
Dépôt Institutionnel - Portail de la Recherche
researchportal.unamur.be
University of Namur
Bridging the Gap Between Policy-Driven Land Use Changes and Regional Climate
Projections
Berckmans, Julie; Hamdi, Rafiq; Dendoncker, Nicolas
Published in:
Journal of Geophysical Research: Atmospheres
DOI:
10.1029/2018jd029207
Publication date:
2019
Document Version
Publisher's PDF, also known as Version of record
Link to publication
Citation for pulished version (HARVARD):
Berckmans, J, Hamdi, R & Dendoncker, N 2019, 'Bridging the Gap Between Policy-Driven Land Use Changes
and Regional Climate Projections', Journal of Geophysical Research: Atmospheres, vol. 124, no. 12, pp.
5934-5950. https://doi.org/10.1029/2018jd029207
General rights
Copyright and moral rights for the publications made accessible in the public portal are retained by the authors and/or other copyright owners and it is a condition of accessing publications that users recognise and abide by the legal requirements associated with these rights. • Users may download and print one copy of any publication from the public portal for the purpose of private study or research. • You may not further distribute the material or use it for any profit-making activity or commercial gain
• You may freely distribute the URL identifying the publication in the public portal ?
Take down policy
If you believe that this document breaches copyright please contact us providing details, and we will remove access to the work immediately and investigate your claim.
Bridging the Gap Between Policy-Driven Land Use
Changes and Regional Climate Projections
Julie Berckmans1,2 , Rafiq Hamdi1, and Nicolas Dendoncker3
1Royal Meteorological Institute, Brussels, Belgium,2Centre of Excellence PLECO (Plants and Ecosystems), Biology
Department, Antwerp University, Antwerp, Belgium,3Department of Geography, University of Namur, Namur, Belgium
Abstract
Changes in the land surface interact with a changing climate. Moreover, the impact of land surface changes on the local and regional climate can be as large as the impact of increasing greenhouse gas emissions. The land surface-climate interactions are best represented by high-resolution models to capture the mesoscale circulation features. The future land surface changes are preferably represented by scenarios that illustrate plausible storylines. Furthermore, the impact of future urbanization is relevant for the highly urbanized region of Europe. In this study, we assess the interactions between climate and land surface dynamics by modeling the near-future climate state for western Europe based on a policy-driven land use change scenario at high resolution. The global climate model CNRM-CM5.1 has been downscaled to the regional climate of western Europe by using ALARO-SURFEX at 4-km horizontal resolution. SURFEX provides a parameterization of the urban physical properties so that the impact of urban surfaces on the regional climate can be modeled realistically. Results are interpreted with respect to the near-future climate change without land surface changes. The near future presents a uniform temperature increase of 0.3–0.6◦C. This is in contrast to changes by the land surface that are more heterogeneous in space and much stronger at the local scale. Deforestation and conversion to arable land diminishes climate change effects, whereas urbanization results in an enhancing effect of climate change. Moreover, urbanization is as big as the radiative forcing warming for minimum temperature.1. Introduction
Land use and land cover changes (LULCCs) alter the biosphere-atmosphere fluxes through two main mecha-nisms: biogeochemical and biogeophysical processes (Kabat et al., 2004). The biogeochemical mechanism of the LULCC alters the chemical composition of the atmosphere, while biogeophysical mechanisms describe the change of the physical characteristics of the land surface such as albedo, soil moisture, and roughness (Bonan, 2008). The Representative Concentration Pathways (RCPs, Moss et al., 2010) include greenhouse emissions from land use activities. The radiative forcing targets by the RCPs incorporate the carbon emis-sions and uptakes from the LULCC (Davies-Barnard et al., 2014). In general, they consist of deforestation and afforestation, abandonment and recultivation of agricultural land, and urbanization. However, the role of vegetation and of soils is much more than only the assimilation of carbon. They also force changes in the heat and moisture transfer between land and atmosphere, as a result of albedo changes or a modified partitioning in latent and sensible heat fluxes (Pielke & Niyogi, 2010). These biogeophysical mechanisms of the LULCC do not solely affect the radiative process but can significantly influence the local and regional climate.
The production of regional and country-scale high-resolution (i.e., less than 10 km) climate projections is a prerequisite to evaluate impacts of future climate change on human societies and ecosystems and for-mulate adaptation measures. Moreover, to more accurately sifor-mulate climate change, these country-scale climate simulations must not only be run at increased spatial resolution but also integrate the changes of the land surface, that is, the changes in ecosystems, land use, and land cover, which can significantly impact local and regional climates through modification of albedo, roughness length, and evapotranspiration rates. Although many modeling studies of the global (Bathiany et al., 2010; Boisier et al., 2012; Brovkin et al., 2013; de Noblet-Ducoudré et al., 2012; Jones et al., 2012, 2013; Pitman et al., 2012; Pongratz et al., 2010; Winckler et al., 2017) and regional (Burakowski, 2016; Gálos et al., 2011, 2013) biophysical impact of LULCC have been conducted, these studies remain quite limited in their assessment of the interactions between climate
RESEARCH ARTICLE
10.1029/2018JD029207 Key Points:
• Urbanization effect is as big as GHG warming for the near future for minimum temperature • Doubling of the minimum
temperature change is due to urbanization
• Afforestation has positive impact on reducing temperature increase
Correspondence to:
J. Berckmans, [email protected]
Citation:
Berckmans, J., Hamdi, R., & Dendoncker, N. (2019). Bridging the gap between policy-driven land use changes and regional climate projections. Journal of Geophysical
Research: Atmospheres, 124. https:// doi.org/10.1029/2018JD029207
Received 19 JUN 2018 Accepted 23 MAR 2019
Accepted article online 16 MAY 2019
Author Contributions
Conceptualization: Rafiq Hamdi,
Nicolas Dendoncker
Funding Acquisition: Rafiq Hamdi Methodology: Rafiq Hamdi Software: Rafiq Hamdi, Nicolas
Dendoncker
Investigation: Nicolas Dendoncker Project Administration: Rafiq
Hamdi
Resources: Rafiq Hamdi Supervision: Nicolas Dendoncker
©2019. American Geophysical Union. All Rights Reserved.
and land surface dynamics. In fact, they usually use low-resolution models, so that atmospheric processes like regional winds, thunderstorms, or other local convective systems cannot be represented, while these mesoscale circulation features are probably central in governing the land surface-climate feedbacks at the scale of a region or a country (Pitman et al., 2012).
Europe is characterized by a high diversity of urban and rural landscapes. Agriculture is the most important land use and has been developing rapidly in the last 60 years due to changes in technology and management system (Reginster et al., 2010). In parallel to this intensification of agriculture, a general trend of abandon-ing agricultural land has been observed. In the meantime, forest areas have increased slightly by 0.1% in the period of 1990–2000 and impervious surfaces have increased by about 5.4% over this period with an increase in the density of urban areas (Reginster et al., 2010). These changes are likely to continue in the future. The combined effect of climate change and regional land use policies is still poorly understood over Europe. For example, the effect of afforestation in temperate regions is not clear yet. Many studies (Gálos et al., 2011, 2013) have examined the biophysical effects of hypothetically removing or replacing whole ecosystems in order to produce a robust signal; however, a gap remains in examining plausible (storyline/policy-driven) future scenarios of land use change combined with high-resolution climate simulations over Europe. More-over, the impact of future urbanization on mesoscale and potentially regional-scale climate needs additional investigations. In fact, only a few modeling groups working at the regional scale are now beginning to imple-ment urban parameterizations within the land surface model component of their regional climate model (Argüeso et al., 2014; Doan et al., 2016; Georgescu et al., 2013; Grossman-Clarke et al., 2017; Kaplan et al., 2017; Kim et al., 2016; Kusaka et al., 2016; Li et al., 2018). Other groups generally employ a dynamical down-scaling of global climate model information with a nonurbanized regional climate model, while further high-resolution simulations are often performed using some type of statistical and/or dynamical downscal-ing by runndownscal-ing off-line urban modules (Conry et al., 2015; Früh et al., 2011; Hamdi et al., 2016; Hoffmann et al., 2016; Lauwaet et al., 2015; Lemonsu et al., 2013). However, because of the off-line mode of these simulations, the contribution and feedback processes by the UHI and climate change are not taken into account.
Although the large-scale signal from LULCCs on future climates is probably known (Feddema et al., 2005), much higher-resolution model simulations still need to be conducted to build confidence in how LUL-CCs interact with a changing climate at regional scale with a specific background climate (Pitman et al., 2011). The climate change forced by the biogeophysical effects of LULCC can be as large as the forcing by greenhouse gas emissions (Mahmood et al., 2014). A temperature change that is related to a change in evap-otranspiration and/or surface roughness can even compensate the temperature change due to a change in albedo, resulting in a temperature change other than expected (Perugini et al., 2017). As an example, defor-estation leads to higher albedo (forest are generally darker, especially in norther regions) and decreased net radiation with a potential negative temperature change (Bonan, 2008). However, this decrease of temper-ature can be locally offset by the warming effect due a decrease in latent heat flux (Feddema et al., 2005). Furthermore, the quantification of the future climate impact of the biogeophysical effects of LULCC imposes high levels of uncertainty, which results in a low agreement on the net change in global mean temperature (Brovkin et al., 2013).
Although considerable research has been devoted to the biogeophysical effects of LULCC on climate (Mahmood et al., 2014), less attention has been paid to assessments of the LULCC impact on the regional climate for the near future, a period that is most important for decision making and stakeholders. In fact, this study is undertaken under the Belgian project MASC (François, 2015) and funded by the Belgian sci-ence policy with the aim to study the feedbacks between climate changes and land surface changes in order to improve regional climate model projections at the decennial scale over Belgium and western Europe and thus to provide better climate projections and climate change evaluation tools to policy makers, stakehold-ers, and the scientific community. This study was developed by using one model, which can cause model uncertainty that is the dominant cause of uncertainty for near-future climate projections. Besides, one future scenario for both climate change and land use change has been used, but for near-future climate projec-tions the scenario spread determines the uncertainty to a lesser extent than model uncertainty (Hawkins & Sutton, 2009).
Modeling the LULCC impact on the regional climate can be achieved by using LULCC scenarios that repre-sent storylines of future land cover. The scenario approach is recognized as a robust approach for analyzing
Journal of Geophysical Research: Atmospheres
10.1029/2018JD029207
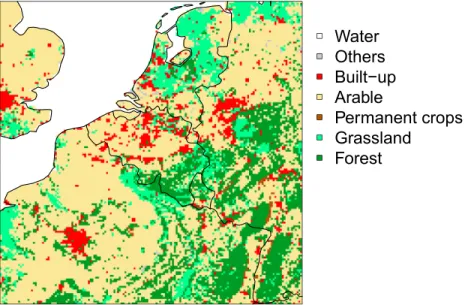
Figure 1. The dominant land cover types in the BASELINE, upscaled to a horizontal resolution of 4×4 km2.
the potential impact of LULCC on the climate system (Lorencová et al., 2016). Due to the large variety of local changes in the landscape of western Europe, the local-scale climate impact by the LULCC can be assessed using high-resolution scenarios. Besides, the local-scale changes in the landscape impose a challenge to the climate model community to parameterize its variability of scales that are smaller than the usual spatial res-olution used by regional climate models. Especially urbanization creates a high alteration of the landscape and requires a proper parameterization of the urban physical properties so that the impact of urban surfaces on the regional climate can be modeled realistically (Masson, 2006; Mahmood et al., 2014).
The local-scale changes in the landscape impose a challenge to the climate model community to parameter-ize this subgrid-scale variability. The use of the high-resolution land surface model SURFace Externalisée (SURFEX, Masson et al., 2013) can overcome this challenge. A specific feature of SURFEX is the represen-tation of the land surface as a patchwork of natural, impervious and water surfaces. The parameterization for urban surfaces within SURFEX (Masson, 2000) is a high advantage for Europe with its strong increase in urban areas (Trusilova et al., 2008).
In this case study, high-resolution climate change simulations have been carried out for western Europe combined with plausible future scenarios of land use change over the next decades. The particular land use changes within this study involve the conversion from grassland to arable land, arable land to urban area, and arable land to forest. Furthermore, this study aims to produce a comprehensive analysis on the interplay between the LULCC and climate change using high-resolution climate simulations coupled with a sophisticated land surface scheme, including a state-of-the-art urban parameterization.
The structure of this paper is organized as follows: The land cover data, experimental setup, and methods are assembled in section 2. Section 3 covers the simulation results. Discussion of the results for three different land use changes is presented in section 4. In section 5, the conclusions are drawn, and the strengths and weaknesses of this experiment are listed.
2. Data and Experimental Setup
2.1. LULCC and Scenarios
Multiple scenarios for the future land surface changes were defined in the ALARM project, an inte-grated project within the Sixth Framework Programme of the European Commission (FP6). The project aimed at providing a tool for the assessment of environmental risks, more specifically for biodiversity loss (Spangenberg et al., 2010). The LULCC scenarios were based on the ALARM socioeconomic storylines and were in agreement with the future trends in European policy that impact the land surface (Reginster et al., 2010). The scenarios have been referenced to a baseline (hereafter called BASELINE, Figure 1), which are observed land covers in the year 2000. The BASELINE has been downscaled to a higher resolution of 250 × 250 m2(Reginster et al., 2010) using the downscaling algorithm of Dendoncker et al. (2006) and is a
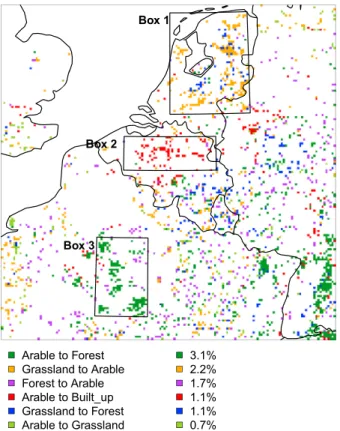
Figure 2. Land cover changes between the BAMBU scenario year 2020 and
the BASELINE at 4-km horizontal resolution. The numbers present the portion of grid boxes that have undergone the particular conversion of the total land area. The three boxes represent areas with one dominant land use and land cover changes: in box 1 grassland to arable, box 2 arable to built-up, and box 3 arable to forest.
reclassification of the Coordination of Information on the Environment (CORINE, Heymann et al., 1994). The resulting land cover is composed of six classes that match the ALARM classes: urban, arable, permanent crops, grassland, forest, and other (Dendoncker & Rounsevell, 2007). Sim-ilarly to the BASELINE approach, the future land cover scenarios have been downscaled for three years: 2020, 2050, and 2080.
The Business-as-might-be-usual (BAMBU) scenario has been selected as it is most relevant for our study domain. The BAMBU scenario fol-lows a reformed agricultural policy with an enforced nature protection by NATURA 2000 (Sundseth, 2008). The largest changes involve the aban-donment of both cropland and grassland, compensated by an increase in forests. The BAMBU scenario follows current and expected trends in EU policies and includes mitigation and adaptation strategies (Lorencová et al., 2016). Furthermore, the BAMBU scenario was developed with the climate input of the Intergovernmental Panel on Climate Change SRES A2 scenario, as it matches the past developments that determine the cli-mate trend (Spangenberg, 2007). The SRES A2 scenario is related to the Shared Socioeconomic Pathway number 3, which describes a world dom-inated by regional rivalry (Riahi et al., 2017). In some way, the A2 SRES scenario is equivalent to the RCP8.5 scenario (Riahi et al., 2011). Despite climate trends have been taken into account in the BAMBU scenario, it is still relevant to combine the BAMBU scenario with an emission scenario when modeling the future climate (Lorencová et al., 2016).
A total of 11.8% of land area changed between the BASELINE and the BAMBU scenario year 2020, of which the most important LULCC is shown in Figure 2. The major LULCC in western Europe is the conversion from arable to forest with 3.1% of the total land area. This type of conver-sion takes place in concentrated regions in the south of the domain, that is, the center of France and southern Germany. The Netherlands is mainly characterized by the conversion from grassland to arable. The conversion from forest to arable is more evenly distributed across the countries. The conversion from arable to built-up occurs mainly in Belgium, more particularly in Flanders and in the northern part of the Walloon region, but also in the Ruhr district in Germany. The areas with high concentrations of one particular LULCC have been selected and were predominantly reflected by changes from grassland to arable in box 1 (in the Netherlands), from arable to built-up in box 2 (in Belgium) and from arable to forest in box 3 (in France; Figure 2). Their extent is 3.3◦E,50.6◦N to 5.8◦E,51.2◦N for box 1, 4.7◦E,51.6◦N to 6.8◦E,53.2◦N for box 2, and 2.7◦E,48.0◦N to 4.1◦E,49.4◦E for box 3. The LULCC accounted for 13.3%, 11.7%, and 42.0% of the total areas in box 1, box 2, and box 3, respectively. They all have a specific biogeophysical impact on the regional climate, by altering the surface energy balance.
2.2. Experimental Setup
We used the ALARO-0 model, a configuration of the Aire Limitée Adaptation Dynamique Développe-ment International (ALADIN) model with improved physical parameterizations (Gerard et al., 2009). The ALADIN model is the limited area model version of the global scale Action de Recherche Petite Echelle Grande Echelle Integrated Forecast system (ARPEGE-IFS; ALADIN International Team, 1997; Bubnovà et al., 1995). ALARO-0 is coupled to the externalized land surface model SURFEX version 5 (Hamdi et al., 2014). To account for subgrid heterogeneities, it uses a tiling approach with each tile providing information by its corresponding parameterization scheme on the surface fluxes according to the type of surface: nature, town, inland water, and sea (Masson et al., 2013). The nature (referred to as vegetation and unmanaged soil) tile is divided into subtiles, referred to as patches to account for the variety in soil and vegetation behav-ior. In SURFEXv5, 12 patches correspond to the plant functional types described in ECOCLIMAP (Masson et al., 2003). ECOCLIMAP is a global land cover database at 1-km horizontal resolution. Each cover type is an ensemble of pixels with similar surface characteristics. The classification was established using land cover maps and satellite observations. Beside this classification ECOCLIMAP provides a data set with sur-face parameters depending on the land covers and plant functional types, such as leaf area index and albedo.
Journal of Geophysical Research: Atmospheres
10.1029/2018JD029207
Figure 3. One-way nesting of the domain at 4-km horizontal resolution centered around 50.57◦N and 4.55◦E within the intermediate domain at 20-km horizontal resolution centered around 46.47◦N and 2.58◦E. The colors represent the orography (m), and the grid is plotted on top at 20-km horizontal resolution.
These physiographic data, together with topography data (GTOPO30, Gesch et al., 1999) and soil properties (IUSS Working Group WRB, 2006), fully interact with SURFEX.
The CNRM-CM5.1 global climate model has been dynamically downscaled to perform simulations with ALARO-SURFEX. The downscaling approach consisted of a daily update of the initial conditions and a continuously evolving land surface (Berckmans et al., 2017). The model allowed for a spin-up period of 3 months to let the atmosphere and land surface advance to an equilibrium state (see Berckmans et al., 2017, for more details on the spin-up period). First, a one-way nesting was applied to perform simulations at 20-km horizontal resolution with its center over western Europe at 46.47◦N and 2.58◦E and a dimension of 149 × 149 horizontal grid points and 46 vertical levels (Figure 3). Next, a one-way nesting was applied to run the model 4-km horizontal resolution with its center over western Europe at 50.57◦N and 4.55◦E and a dimension of 181 × 181 horizontal grid points and 46 vertical levels (Figure 3).
Three simulations have been performed with ALARO-SURFEX for western Europe at 4-km horizontal resolution:
1. A historical simulation for the 30-year period of 1976–2006 without LULCC. This simulation served as the reference for the climate change effect (“CC”) and the combined climate and LULCC effect (“CC+LULCC”; Table 1). This simulation has been validated against E-OBS, a daily high-resolution grid-ded data set (Haylock et al., 2008). The data set consists of the daily mean temperature, the daily maximum and minimum temperature, and the daily precipitation total. The most recent version v14.0 was selected on the 0.22◦rotated pole grid, corresponding to a 25-km horizontal resolution in Europe. It covers the period 1 January 1950 to 30 June 2015.
Table 1
The Three Experimental Designs Applied in This Study to Analyze the Effects of Climate Change (CC), Land Cover Change (LULCC), and the Combined Effect (CC+LULCC)
System Sensitivity experiment
Climate Historical 1976–2005 — RCP8.5 2006–2035 CC
Land use ECOCLIMAP ECOCLIMAP
Climate RCP8.5 2006–2035 — RCP8.5 2006–2035 LULCC
Land use ECOCLIMAP BAMBU
Climate Historical 1976–2005 — RCP8.5 2006–2035 CC+LULCC
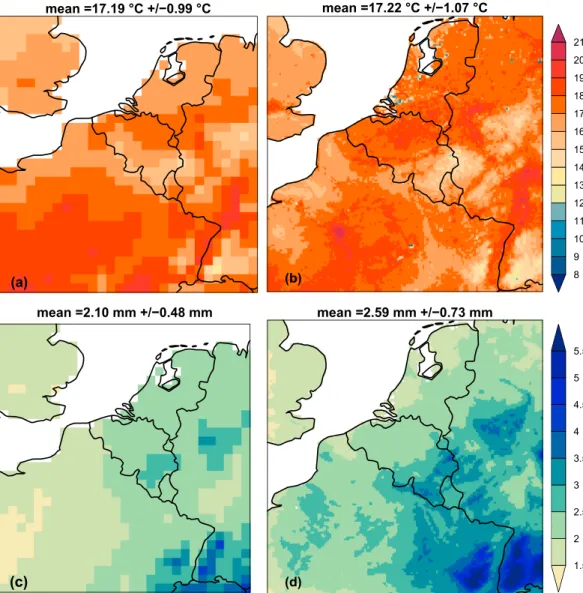
Figure 4. The spatial distribution of the 30-year (1976–2005) summer average daily mean 2-m temperature (◦C) at 4-km horizontal resolution over western Europe by (a) E-OBS, (b) ALARO-SURFEX and daily precipitation totals (mm/day) by (c) E-OBS and (d) ALARO-SURFEX.
2. A simulation in the near future under the RCP8.5 scenario for the 30-year period of 2006–2035 without LULCC (Table 1).
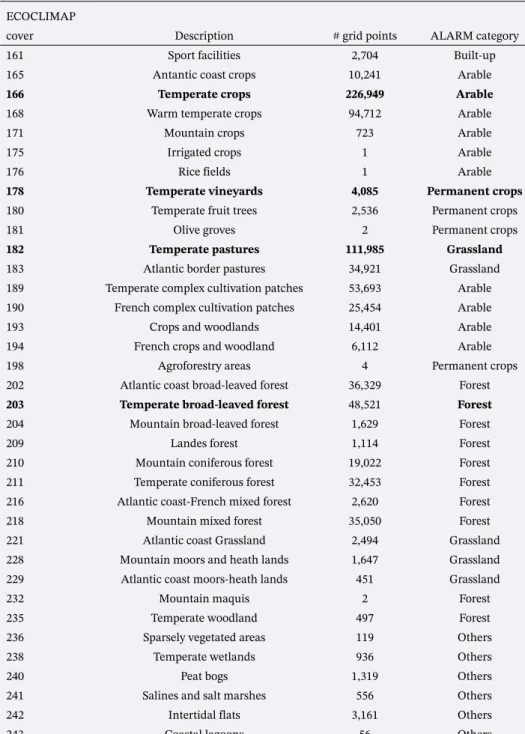
3. A simulation in the near future under the RCP8.5 scenario for the 30-year period of 2006–2035 but chang-ing the underlychang-ing land cover uschang-ing the BAMBU scenario year 2020. The results were compared to the results from the previous simulation to disentangle the LULCC effect in the future (“LULCC”; Table 1). The implementation of the modified land cover data set in the BAMBU scenario has been done in a few steps: (i) the horizontal resolution of the data set was upscaled from 250 m to 1 km (by selecting the most abundant land cover type in a 4 × 4 grid box), corresponding to the resolution of ECOCLIMAP (Masson et al., 2003), (ii) the 50 ECOCLIMAP land covers occurring in our domain have been reclassi-fied to six ALARM categories (Table A1), (iii) the ECOCLIMAP land covers that account for the largest amount of grid points in the six particular categories have been selected, and (iv) the selected ECO-CLIMAP land covers were assigned to the six ALARM categories (Table A1). The dominant ECOECO-CLIMAP land cover classes used within this chapter were inland waters (assigned category “others”), temperate suburban (assigned category “built-up”), temperate crops (assigned category “arable”), temperate vine-yards (assigned category “permanent crops”), temperate pastures (assigned category “grassland”), and temperate broad-leaved forest (assigned category “forest”). Finally, the land cover in each grid box from the ECOCLIMAP data set was replaced by one of the six ALARM categories. Consequently, six
ECO-Journal of Geophysical Research: Atmospheres
10.1029/2018JD029207
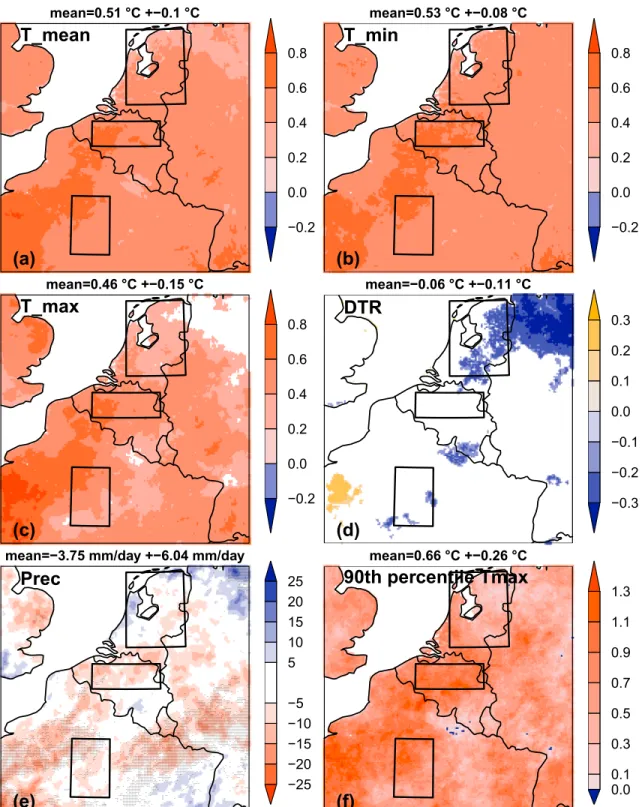
Figure 5. Projected changes of the 30-year summer (June-July-August) daily mean climate parameters for ALARO-SURFEX between the 30-year projected
period (2006–2035) under RCP8.5 without land use and land cover change and the 30-year control period (1976–2005) without land use and land cover change. Changes are shown for western Europe at 4-km horizontal resolution for (a) daily 2-m mean temperature (◦C), (b) daily minimum 2-m temperature (◦C), (c) daily maximum 2-m temperature (◦C), (d) diurnal temperature range (◦C), (e) daily precipitation totals (%), and (f) 90th percentile of daily maximum 2-m temperature (◦C). For the temperature variables, nonsignificant changes are shown in white at 5% significance level. For precipitation, hatched areas indicate regions with statistically significant change at 5% significance level. DTR = diurnal temperature range.
CLIMAP land covers have been used within this study and their corresponding physical parameters, such as albedo, leaf area index, roughness length, and emissivity.
For all simulations, only the summer months (June-July-August) have been analyzed.
3. Results
3.1. Validation Present Climate
We tested the model's capability of correctly simulating the spatial distribution of temperature and precip-itation. The observed spatial distribution over western Europe of the 30-year (1976–2005) summer average of the mean 2-m temperature ranges from 13 to 19◦C with a latitudinal and topographical dependence (Figure 4a). The observed spatial distribution of the 30-year summer average of the daily precipitation totals ranges from 1 to 5 mm/day with higher values occurring at the higher elevations (Figure 4c).
The model represents well the absolute values of the mean temperature, observed gradients and orographic cooling in the southeast of the domain (Figure 4b). Some grid boxes demonstrate much colder temperatures than their neighboring grid boxes. These correspond to rivers and lakes in the model that could not be represented by the observations. The modeled mean temperature shows defined maxima of about 18–20◦C across the country that correspond to urban areas. These local maxima refer to the Urban Heat Island (UHI) effect, and the largest contribution comes from the nighttime temperature. These local maxima over urban surfaces could not be distinguished in the observations as their resolution is too coarse.
The model is able to simulate the orographic forcing for precipitation, although the values are higher than the observed precipitation with an area-averaged mean of 2.59 mm/day compared to 2.10 mm/day (Figure 4d). A careful interpretation of E-OBS is advised, as this gridded data set is in some regions con-structed by interpolation or area averaging of station observations from a small number of stations, which smooths and possibly affects the extreme values within the data set (Hofstra et al., 2010). Besides, the model simulates at a higher spatial resolution in comparison to the coarser resolution of E-OBS.
3.2. Near-Future Climate Change
The results for the near-future period with respect to the control period present the climate change effect. The mean values are around 0.5◦C for mean, minimum, and maximum temperature (Figures 5a–5c). The minimum temperature changes are generally larger than the maximum temperature changes, with larger areas covering a change of 0.5–1◦C. However, the changes in minimum and maximum temperature are still quite similar, resulting in only few significant areas with changes in the diurnal temperature range (Figure 5d). The change in precipitation is small and negative with −3.75 mm/day but with a larger spatial variability (Figure 5e). Significant decreases appear mostly in the southern part of the domain. The 90th percentile of the daily maximum temperatures in summer shows a gradient over our domain with increasing values from northeast to southwest where values occur of 1◦C and more (Figure 5f). Moreover, larger values above 1◦C occur in Belgium and some smaller areas in Germany. Overall, both mean increase and standard deviation is larger for the extreme maximum temperatures with 0.66◦C ± 0.26◦C compared to the mean temperature increases.
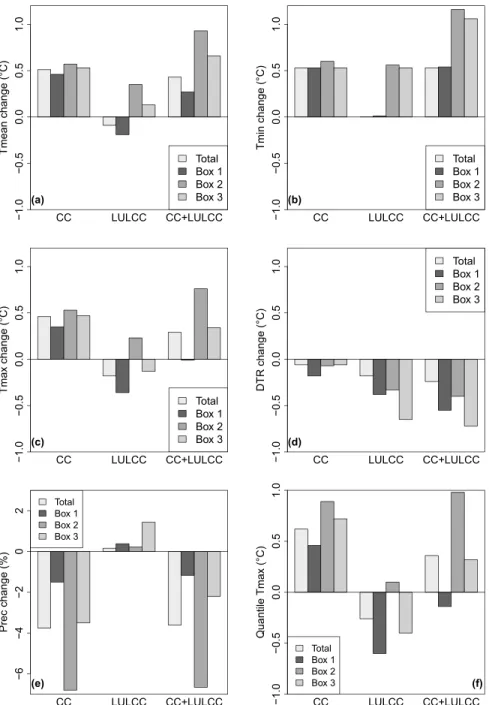
The mean values are demonstrated for the entire domain and the grid boxes in the three boxes defined in section 2.1. The mean, minimum, and maximum temperature change is positive for all boxes with similar values around 0.3–0.6◦C (Table 2 and Figure 6). The standard deviations are an order of magnitude smaller than the mean values with values around 0.05◦C. The precipitation changes in the three boxes are negative with lowest in change in box 1 and largest change in box 2.
3.3. Impacts of LULCC and Emission Change in the Future Climate 3.3.1. Impact of LULCC in the Future Climate
The sign and magnitude of the climate change signals has been determined comparing the simulation results with and without LULCC in the future climate (2006–2035). This strategy was also applied by Gálos et al. (2013) to detect the impact of potential afforestation over Europe, but this study considered a future period of 2071–2090 and a hypothetic increase in forest cover. The effect of LULCC in the future climate is demon-strated by averaging the entire domain and the three grid boxes as described in section 2.1. The changes in the mean temperature by LULCC are largest for box 2 with an average warming of 0.35◦C, mainly deter-mined by an increase in minimum temperature of 0.56◦C (value in bold, Table 2). For box 3, the mean temperature increases with only 0.13◦C. The study of Gálos et al. (2013) presented an opposite signal of
Journal of Geophysical Research: Atmospheres
10.1029/2018JD029207
Table 2
The Changes in the Summer (June-July-August) Daily Mean Climate Parameters for ALARO-SURFEX Between (i) the 30-Year Projected Period (2006–2035) Under RCP8.5 and the Control Period (1976–2005) With ECOCLIMAP (=“CC”), (ii) the Projected LULCC Under RCP8.5 (=“LULCC”), and (iii) the Combined Effect of Both (=“CC + LULCC”)
Parameter Area CC LULCC CC+LULCC
T_mean (◦C) Total +0.51(0.10) −0.09(0.60)a +0.43(0.61)a Box 1 +0.46(0.06)a −0.19(0.68) +0.27(0.68)a Box 2 +0.57(0.05)a +0.35(0.28)a +0.93(0.30)a Box 3 +0.53(0.06)a +0.13(0.32) +0.66(0.34)a T_min (◦C) Total +0.53(0.08)a +0.00(0.54) +0.53(0.54)a Box 1 +0.53(0.05)a +0.01(0.56)a +0.54(0.56)a Box 2 +0.60(0.06)a +0.56(0.41)a +1.16(0.43)a Box 3 +0.53(0.06)a +0.53(0.43)a +1.06(0.45)a T_max (◦C) Total +0.46(0.15)a −0.18(0.75)a +0.29(0.78)a Box 1 +0.35(0.08)a −0.36(0.89) −0.01(0.90)a Box 2 +0.53(0.07)a +0.23(0.25)a +0.76(0.26)a Box 3 +0.47(0.11)a −0.13(0.36) +0.34(0.40)a DTR (◦C) Total −0.06(0.11) −0.18(0.45) −0.24(0.48)a Box 1 −0.18(0.06) −0.38(0.57)a −0.55(0.58)a Box 2 −0.07(0.04) −0.33(0.29)a −0.40(0.30)a Box 3 −0.06(0.07)a −0.65(0.38)a −0.72(0.40)a Prec (%) Total −3.75(−6.04) +0.16(2.06) −3.61(6.12)a Box 1 −1.50(5.13) +0.38(2.53) −1.17(6.07) Box 2 −6.80(3.51) +0.22(2.37) −6.66(3.87) Box 3 −3.50(4.81) +1.43(2.43) −2.20(4.35) 90th percentile T_max (◦C) Total 0.62(0.26) −0.26(1.10) 0.36(1.11)
Box 1 +0.46(0.20) −0.60(1.25) −0.14(1.28) Box 2 +0.89(0.15) +0.10(0.34) +0.98(0.36)
Box 3 +0.72(0.22) −0.40(0.53) +0.32(0.58) Note. Mean changes are shown for daily mean 2-m temperature (T_mean), daily minimum 2-m temperature (T_min), daily maximum 2-m temperature (T_max), diurnal temperature range (DTR), daily precipitation totals (Prec), and 90th percentile of daily maximum 2-m temperature. The values between Brackets are the standard deviations.
aChanges are significant for>50% of the total grid boxes with the particular conversion in the
particular box at a 5% significance level.
temperature decrease of −0.4◦C with afforestation for northeast France and northern Germany. This sen-sitivity study involved a change of only one specific land cover for the far future. This is in contrast to the area that we focus on in box 3 that is also influenced by the surrounding land cover changes that may effect the overall effect on the regional climate. However, the maximum temperature decreases in this area with −0.13◦C due to LULCC (value in bold, Table 2). This means that the climatic effects of emission change can be reduced by forest cover increase during the day, but not during the night.
The mean and maximum temperature decreases in box 1 under LULCC with −0.19 and −0.36◦C, respec-tively, while the minimum temperature change is slightly positive with 0.01 ◦C. Despite temperature decreases for box 1, all domains display significant decreases in the diurnal temperature range by LULCC. More importantly, the standard deviations of the temperature changes are in the same order of magnitude or even larger than the mean changes. This implies that the variability across the region is very large. Besides, the standard deviations by the LULCC effect are an order of magnitude smaller than the standard deviations by the climate change effect only. This suggests that the warming effect by radiative forcing is more uniform than the warming or cooling effect of LULCC. In contrast to temperature, the precipitation change caused by LULCC in the future is negligible.
Figure 6. Projected climate changes (CC) in the 30-year projected period (2006–2035) with respect to the 30-year
control period (1976–2005) in the summer (June-July-August), projected land use and land cover change (LULCC) under RCP8.5 and the combined effect of both for (a) mean 2-m temperature (◦C), (b) minimum 2-m temperature (◦C), (c) maximum 2-m temperature (◦C), (d) diurnal temperature range (◦C), (e) precipitation (%), and (f) 90th percentile of maximum 2-m temperature (◦C).
3.3.2. Impact of Combined LULCC and Emission Change in the Future Climate
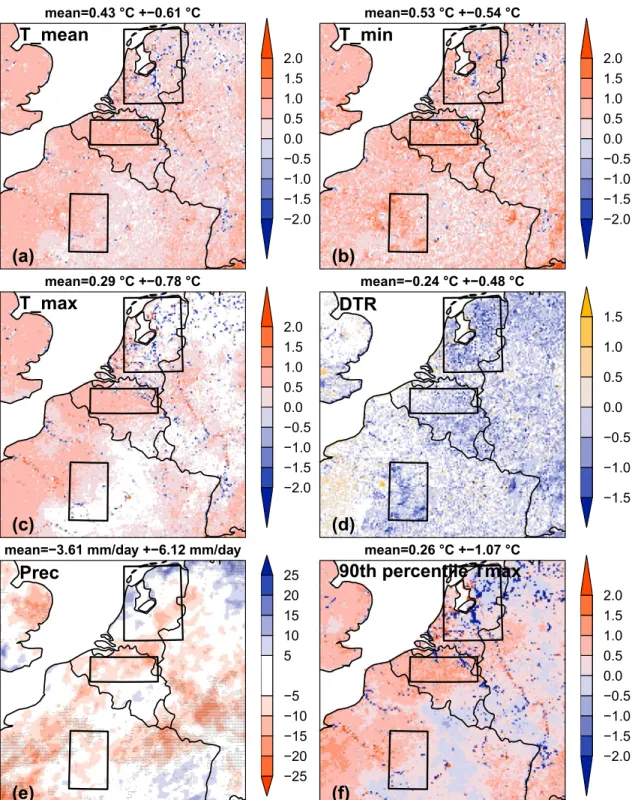
The sign and magnitude of the climate change signals due to potential LULCCs has been determined com-paring the simulation results with LULCC and emission changes in the near future (2006–2035) against the simulation results without LULCC and without emission changes in the past (1976–2005). The regions have been identified where the combined LULCC and climate change shows the largest effects on summer temperature and precipitation (Figure 7). In Belgium, the Ruhr district, United Kingdom, and Paris region, the mean temperature increases with about 1◦C (Figure 7a). The same regions experience higher mini-mum temperature changes of about 1.5◦C (Figure 7b). This means that maximum temperature changes are smaller than the minimum temperature changes (Figure 7c). Only the regions of Flanders (north of
Journal of Geophysical Research: Atmospheres
10.1029/2018JD029207
Figure 7. Projected changes of the 30-year summer (June-July-August) daily mean climate parameters for ALARO-SURFEX between the 30-year projected
period (2006–2035) under RCP8.5 coupled to the BAMBU scenario year 2020 and the 30-year control period (1976–2005) without land use and land cover change. Changes are shown for western Europe at 4-km horizontal resolution for (a) daily 2-m mean temperature (◦C), (b) daily minimum 2-m temperature (◦C), (c) daily maximum 2-m temperature (◦C), (d) diurnal temperature range (◦C), (e) daily precipitation totals (%), and (f) 90th percentile of daily maximum 2-m temperature (◦C). For the temperature variables, nonsignificant changes are shown in white at 5% significance level. For precipitation, hatched areas indicate regions with statistically significant change at 5% significance level. DTR = diurnal temperature range.
Belgium), Paris, and the Ruhr district show significant large positive changes of 0.5–1◦C. The positive and negative changes in minimum temperature and maximum temperature respectively result in an aver-aged decreased diurnal temperature range of −0.24◦C (Figure 7d). Large local decreases of 1 to 1.5◦C and even larger than 1.5◦C appear widespread over the domain and especially in the center of France. The precipitation changes are mostly negative, but many regions are characterized by nonsignificant changes (Figure 7e).
The combined effect of climate change and LULCC in the future climate is further demonstrated by averag-ing the entire domain and the three grid boxes as described in section 2.1. LULCC amplifies the minimum temperature for all boxes, resulting in minimum temperature changes of +1◦C for boxes 2 and 3 (Figure 6b and Table 2, values in bold). This is in contrast to the maximum temperature, which is reduced by LULCC in boxes 1 and 3 (Figure 6c) and 2). Both increased minimum temperatures and decreased maximum tem-peratures lead to a stronger reduction of the diurnal temperature range in the near future combined with LULCC (Figure 6d). The negative precipitation changes under climate change are only slightly reduced by the small positive precipitation changes under LULCC (Figure 6e). Using a climate projection in the far future with more uniform land cover change could result in larger LULCC impacts to the precipitation. In a study by Gálos et al. (2013) half of the climate signal could be relieved by afforestation for the region of northern France.
Changes in the land surface affect not only the climatic means but also the extremes. For the regions of interest in the three boxes, the maximum temperature above the 90th percentile were calculated. The largest maximum temperatures increase faster under climate change than the mean maximum tempera-tures (Table 2 and Figure 6). However, they increase at a lower rate under LULCC for box 2 and decrease at higher rates under LULCC for the other domains. The net increase of the extreme temperature under both climate change and LULCC is highest for box 2 with 0.98◦C (value in bold, Table 2) compared to 0.76◦C for the mean maximum 2-m temperature. The largest benefit of LULCC can be reached in box 3, where more than half of the increase in the number of extremely warm days could be mitigated by the change to forest cover (value in bold, Table 2). This is similar to results for the French region by the end of the century with a land cover scenario of afforestation (Gálos et al., 2013).
4. Discussion
The impacts of LULCC are much more geographically isolated with respect to changes in the radiative forc-ing (Brovkin et al., 2013; Pitman et al., 2012). The regional climatic response to radiative forcforc-ing is not dependent on the spatial pattern of this forcing, whereas the response is more sensitive to the spatial pat-tern of the LULCC (Brovkin et al., 2013). The temperature changes due to LULCC were in the same order of magnitude than the changes due to radiative forcing. This is different for simulations until the end of the century, where the LULCC effects on temperature are relatively small in the order of 0.1 K compared to the effects of radiative forcing being 3.5–3.7 K under RCP8.5 (Brovkin et al., 2013). Besides, the temper-ature changes are statistically significant for many regions, which is different from results in the LUCID experiments as those simulations were done for the end of the century (Brovkin et al., 2013).
The total land area that has undergone a conversion in land cover accounts for about one tenth of the total land area. The most prominent LULCC that took place between the BAMBU scenario year 2020 and the BASELINE were abandonment of arable land in exchange for forests and built-up areas and also deforesta-tion, and conversion of grassland to arable land. A detectable gradient was present in the conversion types from north to south: (i) grassland to arable in the Netherlands, (ii) arable to built-up in Belgium (mainly Flanders) and the Ruhr district, and (iii) arable to forest in the southern part of the domain. Deforestation took place at isolated sites widespread over the domain.
4.1. Grassland to Arable
The LULCC for areas governing conversions from grassland to arable land resulted in a decrease in the maximum temperature and no change in the minimum temperature. Moreover, the extreme maximum temperature was further reduced under LULCC. The LULCC compensated the effect of climate change for the near future, more particularly for the maximum and extreme temperature. This could be related to higher evapotranspiration of the growing crops in summer than that of grasses, thus leading to larger latent heat flux and reduced temperatures during the day. It should be noted that the climatic response is highly dependent on the underlying land cover map and the land surface parameterizations in the model (Boisier et al., 2012).
Journal of Geophysical Research: Atmospheres
10.1029/2018JD029207
4.2. Arable to Built-Up
The areas that represent conversions from arable land to built-up experience increases in minimum and maximum temperature under LULCC. These areas demonstrated the largest enhancements from the three selected areas with values of 0.5◦C. This resulted in an increase in minimum temperature in the near future of 1.16◦C. The conversions from arable land into built-up area lowers the albedo due to specific physical properties of a city such as darker impervious surfaces and lowered the leaf area index because of replacement of vegetated areas by nonvegetated areas (Hamdi & Schayes, 2008). The minimum tempera-ture increased strongly because of less rural areas that could cool faster during the night. Consequently, the LULCC amplified the mean and extreme temperature increase in these areas. Furthermore, the conjunction of urbanization and changing radiative forcing caused an increase in minimum temperature that was con-siderably larger than the increase due to climate change only. Argüeso et al. (2014) also found this for the Sydney region and concluded that the increase in minimum temperature was much higher than the change in maximum temperature. These results is in agreement with many evidences in the recent literature indi-cating that future urbanization may amplify the air temperature in different climatic regions (Mahmood et al., 2014) either under present (Doan et al., 2016; Kaplan et al., 2017; Li et al., 2018) or future conditions (Argüeso et al., 2014; Georgescu et al., 2013; Grossman-Clarke et al., 2017; Kim et al., 2016; Kusaka et al., 2016) with a strong impact on minimum temperatures.
4.3. Arable to Forest
The changes of radiative forcing in simulations for the near future led to temperature increases of about 0.5◦C ± 0.05◦C and were quite uniform over the entire domain. This was in contrast to the LULCC that led to temperature changes of −0.4 to +0.6◦C ± 0.2 to 0.9◦C. Therefore, the impacts of LULCC were much more geographically isolated with respect to changes in the radiative forcing. For example, the LULCC in the area that was dominated by conversion of grassland into arable land forced a decrease in maximum temperature, thus reducing the effect of climate change for the near future. Similarly, the LULCC in the area dominated by conversion of arable land into forest caused a decrease in maximum temperature but an increase in min-imum temperature with similar magnitude as the climate change effect. As a result, the climate change effect was amplified for minimum temperature for the near future but was weakened for the maximum temperature as well as for the extreme temperature. During the day, warming due to radiative forcing of low albedo over forest is compensated by cooling related to increase in evapotranspiration and greater aero-dynamic conductance leading to more efficiently dissipating of heat (Bonan, 2008; Burakowski, 2016). At night, stable conditions over low surface roughness trap cold air at the surface, while forest increases tur-bulence due to higher surface roughness (+0.44-mm average over box3; Lee et al., 2011). Lee et al. (2011) observed an increase in local cooling effect of deforestation at higher latitudes. In a recent study by Gálos et al. (2013) over Europe, large-scale afforestation-induced cooling was quite small (−0.3◦C) compared to the +3◦C emission-induced warming for the period 2071–2090. However, changes in precipitation were relatively larger (−10% to +10% compared to −25% to +25% resulting from increased greenhouse gases). Locally, afforestation-induced rainfall increases can more than compensate the greenhouse gases-induced decrease.
5. Conclusion
The landscape of western Europe has already undergone significant changes due to both biogeochemical and biogeophysical effects of LULCC. The biogeochemical effects that reflect radiative forces are widely accepted and quantified by global and regional models, whereas biogeophysical effects that reflect nonra-diative forces have not been quantified and integrated by the models yet. The land use scenarios of ALARM prescribed realistic storylines of the biogeophysical effects of LULCC that will likely take place in the next decades. This study examined the combined effect of LULCC and climate change by radiative forcing on the regional climate in the near future. One specific land use change scenario “BAMBU” was selected for the year 2020 and only summer period was investigated. The major LULCC was the abandonment of arable land in exchange for forest and urban areas and also deforestation and conversion of grassland into arable land. The near-surface climate under RCP8.5 in the near future was defined by average increases in mean, min-imum, and maximum temperature of around 0.3–0.6◦C. The LULCC showed consistent increases for all regions of interest of the same order of magnitude in the minimum temperature. These changes superim-posed on the climate change signal, resulting in minimum temperature changes of +1◦C for the near future. The grid boxes in the center box with strong urbanization experienced significant increases in both mean,
minimum, and maximum temperature under both climate change and LULCC. Moreover, the extreme tem-perature increased with 0.1◦C for these areas. For the other regions of interest, the impacts of LULCC on maximum temperature were negative, thus diminishing the overall change under both climate change and LULCC. Due to the larger standard deviations by LULCC than by climate change only, the local effect of LULCC on temperature was even larger than the radiative forcing effect. The precipitation was not affected by the LULCC for the near future.
As the impacts of the LULCC on the regional climate were also present outside of the grid cells where the LULCC took place, large-scale variations could occur in the radiative forcing. Thereby, they could force climate feedbacks so that the effects of LULCCs for a specific location were not purely controlled by the LULCC in that grid cell. We recommend to investigate the regional aspect of the LULCC more in depth for areas that do not experience LULCCs themselves but are affected by neighboring LULCCs.
For this study, only six land use and land cover classes were used. It would be beneficial to incorporate more classes in the land use change models in order to have a higher thematic diversity. This is especially true for forest classes to have a distinction between deciduous and needleleaf forests. A similar project that provides a larger thematic diversity is CLUE-S (Verburg & Overmars, 2009).
Finally, this study demonstrated the impact of land use changes in a near-future climate with respect to climate changes only. The results exhibited a strong influence of the land surface on the regional cli-mate highly depending on the local scale. Furthermore, this study emphasized the importance of applying a high-resolution model simulating both future climates without and with land use changes based on a policy-driven land use change scenario. However, one has to keep in mind that this is one regional climate model coupled to one land surface scheme, and therefore, we cannot estimate the results dispersion with respect to alternative climate change pathways, land use change projections, or alternative global climate model (Boisier et al., 2012; Brovkin et al., 2013; de Noblet-Ducoudré et al., 2012). Moreover, since the time frame in this study is the near term future scenario, the uncertainty for the near-future climate projections is dominated by model uncertainty and internal variability and to a lesser extent by scenario spread (Hawkins & Sutton, 2009).
Appendix A
The appendix presents the reclassification done within this study to define the land use categories for the future scenario (Table A1).
Table A1
Reclassification of ECOCLIMAP land covers that occur in the study domain into ALARM scenario categories.
ECOCLIMAP
cover Description # grid points ALARM category
1 Sea and ocean 195,713 None
2 Inland waters 7,224 Others
3 Rivers 1,015 Others
4 Bare land 919 Others
5 Rocks 80 Others
151 Dense urban 5,835 Built-up
153 Temperate suburban 43,210 Built-up
154 Cold suburban 825 Built-up
155 Industries and commercial areas 6,385 Built-up
156 Road and rail networks 451 Built-up
157 Port facilities 546 Built-up
158 Airport 1,286 Built-up
159 Mineral extraction, construction sites 2,113 Built-up
Journal of Geophysical Research: Atmospheres
10.1029/2018JD029207
Table A1 (continued)
ECOCLIMAP
cover Description # grid points ALARM category
161 Sport facilities 2,704 Built-up
165 Antantic coast crops 10,241 Arable
166 Temperate crops 226,949 Arable
168 Warm temperate crops 94,712 Arable
171 Mountain crops 723 Arable
175 Irrigated crops 1 Arable
176 Rice fields 1 Arable
178 Temperate vineyards 4,085 Permanent crops
180 Temperate fruit trees 2,536 Permanent crops
181 Olive groves 2 Permanent crops
182 Temperate pastures 111,985 Grassland
183 Atlantic border pastures 34,921 Grassland
189 Temperate complex cultivation patches 53,693 Arable 190 French complex cultivation patches 25,454 Arable
193 Crops and woodlands 14,401 Arable
194 French crops and woodland 6,112 Arable
198 Agroforestry areas 4 Permanent crops
202 Atlantic coast broad-leaved forest 36,329 Forest
203 Temperate broad-leaved forest 48,521 Forest
204 Mountain broad-leaved forest 1,629 Forest
209 Landes forest 1,114 Forest
210 Mountain coniferous forest 19,022 Forest
211 Temperate coniferous forest 32,453 Forest
216 Atlantic coast-French mixed forest 2,620 Forest
218 Mountain mixed forest 35,050 Forest
221 Atlantic coast Grassland 2,494 Grassland
228 Mountain moors and heath lands 1,647 Grassland 229 Atlantic coast moors-heath lands 451 Grassland
232 Mountain maquis 2 Forest
235 Temperate woodland 497 Forest
236 Sparsely vegetated areas 119 Others
238 Temperate wetlands 936 Others
240 Peat bogs 1,319 Others
241 Salines and salt marshes 556 Others
242 Intertidal flats 3,161 Others
243 Coastal lagoons 56 Others
Note. The covers in bold represent the ECOCLIMAP land covers that were selected to provide the land surface parameter values for the ALARM categories.
References
ALADIN International Team (1997). The ALADIN project: Mesoscale modelling seen as a basic tool for weather forecasting and atmospheric research. WMO Bulletin, 46, 317–324.
Argüeso, D., Evans, J. P., Fita, L., & Bormann, K. J. (2014). Temperature response to future urbanization and climate change. Climate
Dynamics, 42, 2183–2199.
Bathiany, S., Claussen, M., Brovkin, V., Raddatz, T., & Gayler, V. (2010). Combined biogeophysical and biogeochemical effects of large-scale forest cover changes in the MPI earth system model. Biogeosciences, 7, 1383–1399.
Berckmans, J., Giot, O., DeTroch, R., Hamdi, R., Ceulemans, R., & Termonia, P. (2017). Reinitialised versus continuous regional climate simulations using ALARO-0 coupled to the land surface model SURFEXv5. Geoscientific Model Development, 10, 223–238.
Acknowledgments
This research was funded by the Belgian Federal Science Policy Office under the BRAIN.be program as MASC contract BR/121/A2. The used ALADIN codes, along with all related intellectual property rights, are owned by the members of the ALADIN consortium. Access to the ALADIN System, or elements thereof, can be granted upon request and for research purposes only. The used SURFEX codes are freely available, together with the ECOCLIMAP database, at the website (http://www. cnrm-game-meteo.fr/surfex///spip. php?rubrique8). This study is based on large data sets written in .FA and.lfi format. The relevant output is exported to R data sets. Due to licensing restrictions, this model output is not made publicly available. However, for the purpose of the review, the data can be made available for the Editor and reviewer upon request by contacting Julie Berckmans. The used ALARM land use data are freely available by contacting Nicolas Dendoncker.
Boisier, J.-P., de Noblet-Decoudré, N., Pitman, A. J., Cruz, F. T., Delire, C., van den Hurk, B. J. J. M., et al. (2012). Attributing the impacts of land-cover changes in temperate regions on surface temperature and heat fluxes to specific causes: Results from the first LUCID set of simulations. Journal of Geophysical Research, 117, D12116. https://doi.org/10.1029/2011JD017106
Bonan, G. B. (2008). Forests and climate change: Forcings, feedbacks, and the climate benefits of forests. Science, 320, 1444–1449. Brovkin, V., Boysen, L., Arora, V. K., Boisier, J.-P., Cadule, P., Chini, L., et al. (2013). Effect of anthropogenic land-use and land-cover
changes on climate and land carbon storage in CMIP5 projections for the twenty-first century. Journal of Climate, 26, 6859–6881. Bubnovà, R., Hello, G., Bénard, P., & Geleyn, J.-F (1995). Integration of the fully elastic equations cast in the hydrostatic pressure
terrain-following coordinate in the framework of the ARPEGE/Aladin NWP system. Monthly Weather Review, 123, 515–535. Burakowski, E. A. (2016). Evaluating the climate effects of reforestation in New England using a Weather Research and Forecasting (WRF)
model multiphysics ensemble. Journal of Climate, 29, 5141–5156.
Conry, P., Sharma, A., Potosnak, M. J., Leo, L. S., Bensman, E., Hellmann, J. J., & Fernando, H. J. (2015). Chicago's heat island and climate change: Bridging the scales via dynamical downscaling. Journal of Applied Meteorology and Climatololgy, 54, 1430–1448.
Davies-Barnard, T., Valdes, P., Singarayer, J., Pacifico, F., & Jones, C. (2014). Full effects of land use change in the Representative Concentration Pathways. Environmental Research Letters, 9, 1–7.
de Noblet-Ducoudré, N., Boisier, J.-P., Pitman, A., Bonan, G. B., Brovkin, V., Cruz, F., et al. (2012). Determining robust impacts of land-use-induced land-cover changes on surface climate over North America and Eurasia: Results from the first set of LUCID experiments. Journal of Climate, 25, 3261–3281.
Dendoncker, N., Bogaert, P., & Rounsevell, M. (2006). A statistical method to downscale aggregated land use data and scenarios. Journal
of Land Use Science, 1, 63–82.
Dendoncker, N., & Rounsevell, M. (2007). Tested and downscaled land use change scenario maps (pp. 13). Toulouse, France: EU. Doan, Q.-V., Kusaka, H., & Ho, Q.-B (2016). Impact of future urbanization on temperature and thermal comfort index in a developing
tropical city: Ho Chi Minh City. Urban Climate, 17, 20–31.
Feddema, J., Oleson, K., Bonan, G., Mearns, L., Buja, L., Meehl, G., & Washington, W. (2005). The importance of land-cover change in simulating future climates. Science, 310, 1674–1678.
François, L. (2015). Unmasking the climate system—A Belgian project is implementing surface land use and socioeconomic feedbacks in high-resolution climate projections over Belgium and western Europe. PanEuropean Networks: Government, 14, 115.
Früh, B., Becker, P., Deutschländer, T., Hessel, J. D., Kossmann, M., Mieskes, I., et al. (2011). Estimation of climate-change impact on the urban heat load using an urban climate model and regional climate projections. Journal of Applied Meteorology and Climatology, 50, 167–184.
Gálos, B., Hagemann, S., Hänsler, A., Kindermann, G., Rechid, D., Sieck, K., et al. (2013). Case study for the assessment of the biogeophysical effects of a potential afforestation in Europe. Carbon Balance Management, 8, 3.
Gálos, B., Mátyás, C., & Jacob, D. (2011). Regional characteristics of climate change altering effects of afforestation. Environmental Research
Letters, 6, 44010.
Georgescu, M., Moustaoui, M., Mahalov, A., & Dudhia, J. (2013). Summer-time climate impacts of projected megapolitan expansion in Arizona. Nature Climate Change, 3, 37–41.
Gerard, L., Piriou, J.-M., Bruzková, R., Geleyn, J.-F., & Banciu, D. (2009). Cloud and precipitation parameterization in a meso-gamma-scale operational weather prediction model. Monthly Weather Review, 137, 3960–3977.
Gesch, D., Verdin, K., & Greenlee, S. (1999). New land surface digital elevation model covers the Earth. Eos, Transactions American
Geophysical Union, 80, 69–70.
Grossman-Clarke, S., Schubert, S., & Fenner, D. (2017). Urban effects on summertime air temperature in Germany under climate change.
International Journal of Climatololgy, 37, 905–917.
Hamdi, R., Degrauwe, D., Duerinckx, A., Cedilnik, J., Costa, V., Dalkilic, T., et al. (2014). Evaluating the performance of SURFEXv5 as a new land surface scheme for the ALADINcy36 and ALARO-0 models. Geoscientific Model Development, 7, 23–39.
Hamdi, R., Duchêne, F., Berckmans, J., Delcloo, A., Vanpoucke, C., & Termonia, P. (2016). Evolution of urban heat wave intensity for the Brussels Capital Region in the ARPEGE-Climat A1B scenario. Urban Climate, 17, 176–195.
Hamdi, R., & Schayes, G. (2008). Sensitivity study of the urban heat island intensity to urban characteristics. International Journal of
Climatology, 28, 973–982.
Hawkins, E., & Sutton, R. (2009). The potential to narrow uncertainty in regional climate predictions. Bulleting of American Meteorological
Society, 90, 1095–1107.
Haylock, M. R., Hofstra, N., Klein Tank, A. M. G., Klok, E. J., Jones, P. D., & New, M. (2008). A European daily high-resolution gridded data set of surface temperature and precipitation for 1950–2006. Journal of Geophysical Research, 113, D20119. https://doi.org/10.1029/ 2008JD010201
Heymann, Y., Steenmans, C., Croissille, G., & Bossard, M. (1994). CORINE land cover technical guide. Luxembourg: Commission of the European Communities. Office for Official Publication of the European Communities.
Hoffmann, P., Krueger, O., & Schlünzen, K. H. (2016). A statistical model for the urban heat island and its application to a climate change scenario. International Journal of Climatology, 32, 1238–1248.
Hofstra, N., New, M., & McSweeney, C. (2010). The influence of interpolation and station network density on the distributions and trends of climate variables in gridded daily data. Climate Dynamics, 35, 841–858.
IUSS Working Group WRB (2006). World reference base for soil resources 2006 (World Soil Resources Reports. No. 103). Rome: FAO. Jones, A. D., Collins, W. D., Edmonds, J., Torn, M. S., Janetos, A., Calvin, K. V., et al. (2012). Greenhouse gas policy influences climate via
direct effects of land-use change. Journal of Climate, 26, 3657–3670.
Jones, A. D., Collins, W. D., & Torn, M. S. (2013). On the additivity of radiative forcing between land use change and greenhouse gases.
Geophysical Research Letters, 40, 4036–4041. https://doi.org/10.1002/grl.50754
Kabat, P., Claussen, M., Dirmeyer, P., Gash, J, de Guenni, L., Meybeck, M., et al. (2004). Vegetation, water, humans and the climate. Heidelberg, Germany: Springer.
Kaplan, S., Georgescu, M., Alfasi, N., & Kloog, I. (2017). Impact of future urbanization on a hot summer: A case study of Israel. Theoretical
and Applied Climatology, 128, 325–341.
Kim, H., Kim, Y.-K., Song, S.-K., & Lee, H. W. (2016). Impact of future urban growth on regional climate changes in the Seoul Metropolitan Area, Korea. Sciences of the Total Environment, 571, 355–363.
Kusaka, H., Suzuki-Parker, A., Aoyagi, T., Adachi, S. A., & Yamagata, Y. (2016). Assessment of RCM and urban scenarios uncertainties in the climate projections for August in the 2050s in Tokyo. Climatic Change, 137, 427–438.
Lauwaet, D., Hooyberghs, H., Maiheu, B., Lefebvre, W., Driesen, G., Van Looy, S., & De Ridder, K. (2015). Detailed urban heat island projections for cities worldwide: Dynamical downscaling CMIP5 global global climate model. Climate, 3, 391–415.
Journal of Geophysical Research: Atmospheres
10.1029/2018JD029207
Lee, X., Goulden, M. L., Hollinger, D. Y., Barr, A., Black, T. A., Bohrer, G., et al. (2011). Observed increase in local cooling effect ofdeforestation at higher altitudes. Nature, 479, 384–387.
Lemonsu, A., Kounkou-Arnaud, R., Desplat, J., Salagnac, J. L., & Masson, V. (2013). Evolution of the Parisian urban climate under a global changing climate. Climatic Change, 116, 679–692.
Li, X., Mitra, C., Dong, L., & Yang, Q. (2018). Understanding land use change impacts on microclimate using Weather Research and Forecasting (WRF) model. Physics and Chemistry of the Earth, 103, 115–126.
Lorencová, E., Harmácková, Z., Landová, L., Pártl, A., & Vackár, D. (2016). Assessing impact of land use and climate change on regulating ecosystem services in the Czech Republic. Ecosystem Health and Sustainability, 2, 1–12.
Mahmood, R., Pielke, R., Hubbard, K., Niyogi, D., Dirmeyer, P., McAlpine, C., et al. (2014). Land cover changes and their biogeophysical effects on climate. International Journal of Climatology, 34, 929–953.
Masson, V. (2000). A physically-based scheme for the urban energy budget in atmospheric models. Boundary-Layer Meteorology, 94, 357–397.
Masson, V. (2006). Urban surface modeling and the meso-scale impact of cities. Theoretical and Applied Climatology, 84, 35–45. Masson, V., Champeaux, J.-L., Chauvin, F., Meriguet, C., & Lacaze, R. (2003). A global database of land surface parameters at 1 km
resolution in meteorological and climate models. Journal of Climate, 16, 1261–1282.
Masson, V., Le Moigne, P., Martin, E., Faroux, S., Alias, A., Alkama, R., et al. (2013). The SURFEXv7.2 land and ocean surface platform for coupled or offline simulation of earth surface variables and fluxes. Geoscientific Model Development, 6, 929–960.
Moss, R. H., Edmonds, J. A., Hibbard, K. A., Manning, M. R., Rose, S. K., van Vuuren, D. P., et al. (2010). The next generation of scenarios for climate change research and assessment. Nature, 463, 747–756.
Perugini, L., Caporaso, L., Marconi, S., Cescatti, A., Quesada, B, de Noblet-Ducoudré, N., et al. (2017). Biogeophysical effects on temperature and precipitation due to land cover change. Environmental Research Letters, 12, 1–13.
Pielke, R. A., & Niyogi, D. (2010). The role of landscape processes within the climate system. In J.-C. Otto, & R. Dikau (Eds.),
Landform—Structure, evolution, process control(pp. 67–86). Heidelberg, Germany: Springer.
Pitman, A. J., Avila, F. B., Abramowitz, G., Wang, Y. P., Phipps, S. J., & de Noblet-Ducoudré, N. (2011). Importance of background climate in determining impact of land-cover change on regional climate. Nature Climate Change, 1, 472–475.
Pitman, A., de Noblet-Ducoudré, N., Avila, F., Alexander, L., Boisier, J.-P., Brovkin, V., et al. (2012). Effects of land cover change on temperature and rainfall extremes in multi-model ensemble situations. Earth System Dynamics, 3, 213–231.
Pongratz, J., Reick, C. H., Raddatz, T., & Claussen, M. (2010). Biogeophysical versus biogeochemical climate response to historical anthropogenic land cover change. Geophysical Research Letters, 37, L08702. https://doi.org/10.1029/2010GL043010
Reginster, I., Rounsevell, M., Butler, A., & Dendoncker, N. (2010). Land use change scenarios for Europe. In J. Settele, et al. (Ed.), Atlas of
biodiversity risk(pp. 2–7). Sofia, Bulgaria: Pensoft Publishers.
Riahi, K., Rao, S., Krey, V., Cho, C., Chirkov, V., Fischer, G., et al. (2011). RCP8.5—A scenario of comparatively high greenhouse gas emissions. Climate Change, 109, 33–57.
Riahi, K., van Vuuren, D. P., Kriegler, E., Edmonds, J., O'Neill, B. C., Fujimori, S., et al. (2017). The Shared Socioeconomic Pathways and their energy, land use, and greenhouse gas emissions implications: An overview. Global Environmental Change, 42, 153–168. Spangenberg, J. (2007). Integrated scenarios for assessing biodiversity risks. Sustainable Development, 15, 343–356.
Spangenberg, J., Fronzek, S., Hammen, V., Hickler, T., Jäger, J., Jylhä, K., et al. (2010). The ALARM scenarios: Storylines and simulations for assessing biodiversity risks in Europe. In J. Settele, et al. (Eds.), Atlas of biodiversity risk (pp. 10–15): Pensoft Publishers.
Sundseth, K. (2008). NATURA 2000 protecting Europe's biodiversity, Oxford. United Kingdom: Information Press.
Trusilova, K., Jung, M., Churkina, G., Karstens, U., Heimann, M., & Claussen, M. (2008). Urbanization impacts on the climate in Europe: Numerical experiments by the PSU NCAR mesoscale model (MM5). Journal of Applied Meteorology and Climatology, 47, 1442–1455. Verburg, P., & Overmars, K. (2009). Combining top-down and bottom-up dynamics in land use modeling: Exploring the future of abandoned
farmlands in Europe with the Dyna-CLUE model. Landscape Ecology, 24, 1167–1181.
Winckler, J., Reick, C. H., & Pongratz, J. (2017). Why does the locally induced temperature response to land cover change differ across scenarios? Geophysical Research Letters, 44, 3833–3840. https://doi.org/10.1002/2017GL072519