HAL Id: inserm-00148003
https://www.hal.inserm.fr/inserm-00148003
Submitted on 21 Mar 2008HAL is a multi-disciplinary open access archive for the deposit and dissemination of sci-entific research documents, whether they are pub-lished or not. The documents may come from teaching and research institutions in France or abroad, or from public or private research centers.
L’archive ouverte pluridisciplinaire HAL, est destinée au dépôt et à la diffusion de documents scientifiques de niveau recherche, publiés ou non, émanant des établissements d’enseignement et de recherche français ou étrangers, des laboratoires publics ou privés.
Dietary lignan intake and postmenopausal breast cancer
risk by estrogen and progesterone receptor status.
Marina Touillaud, Anne Thiébaut, Agnès Fournier, Maryvonne Niravong,
Marie-Christine Boutron-Ruault, Françoise Clavel-Chapelon
To cite this version:
Marina Touillaud, Anne Thiébaut, Agnès Fournier, Maryvonne Niravong, Marie-Christine Boutron-Ruault, et al.. Dietary lignan intake and postmenopausal breast cancer risk by estrogen and pro-gesterone receptor status.. JNCI Journal of the National Cancer Institute, 2007, 99 (6), pp.475-86. �10.1093/jnci/djk096�. �inserm-00148003�
This is a pre-copy-editing, author-produced PDF of an article accepted for publication in JNCI Journal of the National Cancer Institute following peer review.
The definitive publisher-authenticated version2007 Mar 21;99(6):475-86 is available online at:
h
ttp://jnci.oxfordjournals.org/cgi/content/full/99/6/475Dietary Lignan Intake and Postmenopausal Breast Cancer Risk by
Estrogen and Progesterone Receptor Status
Marina S. Touillaud, Anne C. M. Thiébaut, Agnès Fournier, Maryvonne Niravong,
Marie-Christine Boutron-Ruault, Françoise Clavel-Chapelon
*Institut National de la Santé et de la Recherche Médicale, ERI 20, EA 4045, and Institut Gustave-Roussy, Villejuif, France.
Background Studies conducted in Asian populations have suggested that high consumption of soy-based foods that are rich in isoflavone phytoestrogens is associated with a reduced risk of breast cancer. However, the potential associations of other dietary phytoestrogens — i.e., the lignans or their bioactive metabolites, the enterolignans — with the risk of breast cancer are unclear.
Methods We prospectively examined associations between the risk of postmenopausal invasive breast cancer and dietary intakes of four plant lignans (pinoresinol, lariciresinol, secoisolariciresinol, and matairesinol) and estimated exposure to two enterolignans (enterodiol and enterolactone), as measured with a selfadministered diet history questionnaire, among 58 049 postmenopausal French women who were not taking soy isoflavone supplements. Relative risks (RRs) and 95% confidence intervals (CIs) were estimated using multivariable Cox proportional hazards regression models. Analyses were further stratified by the combined estrogen and progesterone receptor (ER/PR) status of the tumors. Statistical tests were two-sided.
Results During 383 425 person-years of follow-up (median follow-up, 7.7 years), 1469 cases of breast cancer were diagnosed. Compared with women in the lowest intake quartiles, those in the highest quartile of total lignan intake (>1395 μg/day) had a reduced risk of breast cancer (RR = 0.83, 95% CI = 0.71 to 0.95, Ptrend = .02, 376
versus 411 cases per 100 000 person-years), as did those in the highest quartile of lariciresinol intake (RR = 0.82, 95% CI = 0.71 to 0.95, Ptrend = .01). The inverse associations between phytoestrogen intakes and
postmenopausal breast cancer risk were limited to ER- and PR-positive disease (e.g., RR for highest versus lowest quartiles of total plant lignan intake = 0.72, 95% CI = 0.58 to 0.88, Ptrend = .01, 174 versus 214 cases per
100 000 person-years, and RR for highest versus lowest quartiles of total enterolignan level = 0.77, 95% CI = 0.62 to 0.95, Ptrend = .01, 164 versus 204 cases per 100 000 person-years).
Conclusions High dietary intakes of plant lignans and high exposure to enterolignans were associated with reduced risks of ER- and PR-positive postmenopausal breast cancer in a Western population that does not consume a diet rich in soy.
Phytoestrogens are naturally occurring compounds that are found in plants and in most foods of plant origin. Phytoestrogens consist mainly of isoflavones, which are found in high concentrations in soy and legumes, and lignans, which are found in a variety of fruits, vegetables, and cereal products. Because phytoestrogens have a chemical structure that is similar to that of 17 β-estradiol, they may compete with estrogens for binding to estrogen receptors (ERs) and in so doing, may act as weak estrogen agonists or antagonists (1). Therefore, phytoestrogens have been hypothesized to behave like selective estrogen receptor modulators (SERMs) and to play a role in the chemoprevention of breast cancer (1).
However, despite 15 years of epidemiologic research, the possible association between dietary intake of phytoestrogens and the risk of breast cancer remains unclear. Initially, results from international comparisons and studies of migrant populations gave rise to the hypothesis that higher intakes of soy, a primary source of
*
Correspondence to: Françoise Clavel-Chapelon, PhD, Institut National de la Santé et de la Recherche Médicale, ERI 20, Institut
Gustave-Roussy, 39 rue Camille Desmoulins, 94805 Villejuif Cedex, France (e-mail: clavel@igr.fr ).
HAL author manuscript inserm-00148003, version 1
HAL author manuscript
isoflavones, might be associated with a decreased risk of breast cancer (2, 3). Subsequent case–control and cohort studies (4) conducted in Asia generally confirmed that a high consumption of soy-based foods and isoflavones is associated with a lower risk of premenopausal breast cancer, especially if exposure occurs early in life, for instance, during adolescence. However, studies conducted in North America and Europe have been less conclusive than the Asian studies (4). Indeed, they were inconsistent with each other in showing an association between Western intake levels ofisofl avones and breast cancer risk, but they suggested a possibly reduced risk of breast cancer associated with lignan intakes (5, 6). Moreover, limited evidence is available on exposure to the bioactive metabolites of lignans, the enterolignans, which derive from the metabolism of ingested lignans by the gut microflora and are absorbed by the intestinal cells into the circulation (7). To date, 10 biomarker studies (six prospective studies and four case–control studies) have investigated the relationship between circulating or excreted levels of enterolignans and the risk of postmenopausal breast cancer. Among the prospective studies, five (8–12) found no association and one (6) found that a higher plasma level of enterolignans was associated with a reduced risk of breast cancer. The four case–control studies showed a statistically significant inverse association (13–15) or a suggestive trend for an inverse association (16) between higher serum or urinary levels of enterolignans and the risk of postmenopausal breast cancer. Large prospective studies of dietary lignan intake in relation to breast cancer risk are still scarce, and further research is needed to clarify the potential associations of lignans and enterolignans with breast cancer risk.
CONTEXT AND CAVEATS Prior knowledge
High consumption of foods rich in some phytoestrogens, compounds produced by plants that act like estrogens in cells, has been associated with a reduced risk of breast cancer in Asian populations. However, the association between dietary intakes of the lignans, a specific type of phytoestrogen, or their bioactive metabolites and the risk of breast cancer is unclear, particularly among women with intake levels typically found in Western diets. Study design
A large prospective study in a cohort of French women with a wide range of dietary lignan intakes that examined the association between dietary lignans (assessed with the use of a diet history questionnaire) and the risk of postmenopausal invasive breast cancer.
Contribution
Higher dietary lignan intakes were associated with a reduced risk of postmenopausal invasive breast cancers, particularly those positive for the estrogen receptor and progesterone receptor.
Implications
If the association is found to be causal, increasing dietary lignan intake may be a potential preventive approach for reducing the incidence of breast cancer.
Limitations
Exposure misclassification bias may have resulted in an underestimation of the true associations. The authors could not adjust for unknown potential confounders. Endpoint misclassification with respect to estrogen receptor status was likely. The study cohort was based on a selected population, possibly limiting generalizability of the results to the general population.
The hypothesis that phytoestrogen intakes may be associated with a decreased risk in breast cancer is consistent with the possible beneficial effect of plant foods in cancer. However, in a recent large prospective study (17) and a meta-analysis (18), only modest or borderline statistically significant associations between vegetable consumption and breast cancer risk and no consistent associations between fruit consumption and breast cancer risk were reported. Other studies have suggested that the association between vegetable consumption and breast cancer risk may depend on menopausal status (19, 20) or on the hormone receptor level of the tumor (19, 21, 22). In in vitro experimental studies, biologic effects of phytoestrogens on breast cancer also vary according to the hormonal environment and receptor status (1, 23). In addition, there is evidence from human observational studies that phytoestrogens may modulate hormone levels and ER expression (24, 25).
We studied a large cohort of French women to prospectively investigate the association between dietary lignans at intake levels typically found in Western diets and the risk of breast cancer. We specifically examined associations between the risk of postmenopausal invasive breast cancer and the usual dietary intakes of four plant lignans (i.e., pinoresinol, lariciresinol, secoisolariciresinol, and matairesinol). We also examined associations between postmenopausal invasive breast cancer risk and estimated exposures to two enterolignans (i.e., enterodiol and enterolactone), as assessed through a validated dietary questionnaire. Analyses were further stratified according to the combined ER and progesterone receptor (PR) status of the tumor.
Subjects and Methods
Study Population
E3N (Etude Epidémiologique auprès de femmes de la Mutuelle Générale de l’Education Nationale) is an ongoing prospective cohort study that was designed to examine associations between the risks of various cancers and other chronic diseases and dietary, lifestyle, and reproductive factors in women and has been described elsewhere (26). E3N participants who completed the dietary questionnaire were also included in the European Prospective Investigation into Cancer and Nutrition study (27). In brief, the E3N cohort consists of 98 995 French women who were born between 1925 and 1950 and who were enrolled in the health insurance plan for employees of the public education system. Women who replied to a baseline questionnaire and gave written informed consent were enrolled in E3N between February 1989 and November 1991. The E3N study was approved by the French National Commission for Data Protection and Privacy (Commission Nationale Informatique et Libertés). In the baseline and subsequent self-administered questionnaires, participants provided information on demographic and anthropometric characteristics, reproductive history, health status, lifetime use of hormonal treatments (including use of oral contraceptives and hormone replacement therapy), family history of breast cancer, and smoking status. Follow-up questionnaires were sent biennially, on average, to ascertain whether participants had been diagnosed with various diseases and to update data on medication use, menopausal status, and lifestyle factors. A single dietary questionnaire was mailed in June 1993 to assess usual diet. The response rate for the seventh questionnaire, which was mailed to participants in August 2002 and which served as the last contact date for this study, was 82% of the total cohort at baseline.
For this analysis, we first selected all participants who had completed a valid dietary questionnaire (n = 74 524; 81% response rate after two reminders). Among these women, we excluded those who had reported in the baseline questionnaire that they had been diagnosed with a cancer other than a skin basal cell carcinoma or breast lobular carcinoma in situ or who were diagnosed with such a cancer after they had completed the baseline questionnaire and before the start of follow-up for this analysis (n = 4599), women who were lost to follow-up after replying to the dietary questionnaire (n = 926), and women who had reported on the first or second questionnaire that they had never menstruated (n = 23). We also excluded women whose calculated ratio of energy intake to energy requirement fell in the highest or lowest one percentile for the cohort (n = 1367) (28). To ensure that we assessed only the effects of phytoestrogens from food sources, we further excluded women who had reported that they had consumed soy isoflavone dietary supplements before the 2002 end-of-follow-up questionnaire (n = 5089). Finally, we excluded 4471 women who had not reached menopause at the end of follow-up. We defined the date of menopause as the date preceding 12 consecutive months of amenorrhea (among women who had not had a hysterectomy); the date of bilateral oophorectomy; or, in decreasing order of priority, the self-reported date of menopause, the date that hormone replacement therapy use began, the date when menopausal symptoms began, or an imputed date corresponding to age 47 if menopause was due to oophorectomy and to age 51 otherwise (which were the median ages for surgical and natural menopause in the cohort, respectively). Thus, a total of 58 049 women were included in this analysis.
Dietary Data
We assessed the usual diet of each participant during the year preceding her completion of a single validated self-administered diet history questionnaire (29). This questionnaire was mailed to each participant in June 1993 (with a first reminder mailed in July 1994 and a second one mailed in June 1995) and returned to us between 1993 and 1997. The diet history questionnaire evaluated the consumption of 208 food and beverage items. To assess phytoestrogen intake, we updated the E3N food composition table, which was developed on the basis of the national (30) and the Supplémentation en Vitamines et Minéraux Antioxydants study (31) databases, by compiling published databases of the phytoestrogen content of foods common to Western diets (7, 32–40). From
these databases, we selected the original values of phytoestrogen content that were published by individual laboratories or values that originated from food composition tables that cited the original publications from which the values were determined. When different estimates were available for the same food, we selected the highest value. When values were not available for certain foods, we used the values for very similar foods or from calculated recipes (e.g., for bread items) to approximate the unknown value. We used an in vitro fermentation model (7) to indirectly estimate the enterolignan levels produced by the gut microflora from various foods. All values of phytoestrogen content were converted into micrograms of phytoestrogen per 100 mL of liquid or per 100 g of wet food, and, when necessary, water gain during cooking was taken into account. Most phytoestrogens are present in foods as glycosides; once ingested, they undergo hydrolysis in the digestive tract, which removes the sugar moiety, to yield the bioactive (i.e., aglycone) molecules. The food analysis of phytoestrogens therefore includes a hydrolysis process so that the phytoestrogen content of foods can be expressed in aglycone equivalents. Consequently, the phytoestrogen content in the E3N food table was expressed in aglycone equivalents, after we verified that all the food databases we used were expressed in
this same unit.
For each participant, we calculated average daily dietary intakes of energy, alcohol, macronutrients (i.e., carbohydrates, protein, and total fat), fiber, four plant lignans (pinoresinol, lariciresinol, secoisolariciresinol, and matairesinol), and two enterolignans (enterodiol and enterolactone). Total lignan intake was computed for each woman as the sum of her pinoresinol, lariciresinol, secoisolariciresinol, and matairesinol intakes. We also evaluated the consumption of foods or food groups that were the main contributors to lignan intakes in the study population.
Clinical Data
Participants were asked to report any diagnosis of cancer on each follow-up questionnaire, and we systematically requested pathology reports from the patients or their doctors. The reports, which were used to confirm the diagnosis of invasive breast cancer, were obtained for 96% of the incident breast cancer cases included in this analysis. However, we also included the incident breast cancer cases for which no pathology report was available (4% of the incident cases) because the proportion of false-positive self-reports among the documented cases was small (i.e., 3.5%). Information on the combined ER and PR status of the breast tumors was available for 80% of the case subjects.
Endpoints
Person-years of follow-up were calculated from the date of completion of the dietary questionnaire or the date of menopause, whichever occurred last. The endpoint of this analysis was the diagnosis of primary invasive breast cancer after menopause. For case subjects, follow-up stopped on the date of diagnosis of primary invasive breast cancer. For non–case subjects, follow-up stopped on the date
of diagnosis of any primary cancer (other than skin basal cell carcinoma and breast lobular carcinoma in situ), the date that the most recent questionnaire was completed (for women who were lost to follow-up or who had died), or August 21, 2002, whichever came first. In analyses stratified on the combined ER/PR status of the breast cancer tumors, we censored case subjects with missing receptor status or with receptor status other than that under study at the date of diagnosis.
Statistical Analysis
To take into account the moderate to high correlation of lignan and enterolignan intakes with energy intake (Spearman r ranged from .17 to .63 for all lignans and enterolignans), we calculated the residuals of the linear regression of phytoestrogen intakes on energy intake from food (excluding energy from alcohol) and added corresponding mean phytoestrogen intake as a constant, according to the residual method of Willett and Stampfer (41). We then categorized the obtained energy-adjusted phytoestrogen intakes into quartiles according to the distribution observed in the E3N study population. Baseline characteristics of the participants were examined by quartiles of energy-adjusted total lignan intake; P values for differences in characteristics across quartiles were calculated using the global two-sided chi-square test (for nominal variables), the two-sided Mantel–Haenszel chi-square test (for ordinal variables), or the two-sided Wald chi-square test (for continuous variables in the linear regression on quartiles of lignan intake).
Multivariable relative risks (RRs) of invasive breast cancer and 95% confidence intervals (CIs) were estimated for each quartile of phytoestrogen intake compared with the lowest intake quartile by using Cox proportional hazards regression models with age as the underlying time metric and stratification by 5-year birth cohorts (42). With the number of cases accrued, we had 80% statistical power (at a 5% level of statistical significance) to detect a relative risk of 0.81 or lower or of 1.21 or greater for the highest versus
the lowest quartile of total lignan intake or total enterolignan level. We further examined the association between phytoestrogen intakes and the risk of breast cancer according to the combined ER/PR status of the tumor. With the number of cases accrued in the analyses of ER+ tumors, we had 80% statistical power to detect a relative risk
of 0.74 or lower or of 1.30 or greater for ER+/PR+ breast cancer and of 0.58 or lower or of 1.55 or greater for
ER+/PR− breast cancer for the highest quartile versus lowest quartile of total lignan intake. To test for linear
trends across quartiles of phytoestrogen intake, we assigned the median value for the study population to each category and used these values as a continuous variable. We calculated the absolute risk of breast cancer between 1993 and 2002 in the study population in the highest versus the lowest quartiles of dietary intakes of phytoestrogens. We verified that the proportional hazards assumption was not violated for our main exposure or for the other fixed covariates by including the interaction terms for the phytoestrogen intake quartiles (and the other fixed covariates) with age and confirming that the coefficients were not statistically significantly different from zero.
All models were adjusted for the following known risk factors for breast cancer: age at menarche (<13, 13–14, or ≥15 years); height (continuous); body mass index category (time-dependent variable according to height at baseline and weight at each follow-up questionnaire); personal history of benign breast disease (including fibrocystic breast disease, mastosis, and adenoma) or lobular carcinoma in situ (yes or no); family history of breast cancer in first- or second-degree relatives (yes or no); lifetime use of oral contraceptives (ever or never); hormone replacement therapy use initiated before the previous year (as a time-dependent variable, yes or no); age at first full-term birth and number of live births (nulliparous, <30 years of age and 1–2 births, <30 years of age and ≥3 births, or ≥30 years of age and ≥1 birth); age at menopause (<45, 45–55, or ≥56 years); geographic area at baseline; alcohol consumption (continuous); smoking status (never, former, or current); and dietary energy intake from food (continuous) using the residual method. To account for potential confounding by other constituents of plant products, we further adjusted some models for intakes of fiber or vitamin C as continuous variables. We also tested for interactions of phytoestrogen intakes with hormone replacement therapy use by including the interaction term for trend of phytoestrogen intake (median value of each category used as a continuous variable) with hormone replacement therapy use (Wald chi-square test with one degree of freedom). Fewer than 5% of the values of each covariate were missing. We used the modal values observed among the subjects who had complete data to impute the missing values. All analyses were performed using SAS software (version 9.1; SAS Institute, Inc, Cary, NC). All statistical tests were two-sided.
Results
A total of 1469 incident cases of primary invasive breast cancer were diagnosed among 58 049 postmenopausal women during 383 425 person-years of follow-up between June 15, 1993, and August 21, 2002. Participants were aged 41 to 72 years (median 52 years) at baseline and were followed for a median duration of 7.7 years (range = 1 day–9.2 years); median follow-up for case subjects was 4.2 years (range = 9 days–9.1 years). Among the 56 580 women who did not develop invasive breast cancer, 189 were diagnosed with in situ breast cancer, 1404 developed a primary cancer other than breast cancer or basal cell carcinoma, 494 died, 3065 were lost to follow-up, and 51 428 were censored at the end of the study.
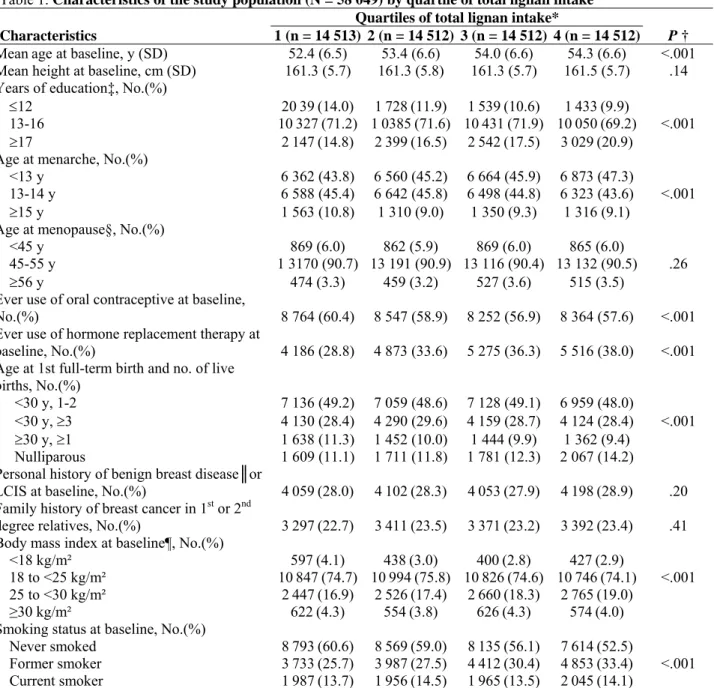
Table 1 presents selected characteristics of the participants at baseline by quartile of energy-adjusted total lignan intake. Compared with women with lowest consumption of dietary lignans, those with higher consumptions were older; better educated; younger at menarche; more likely to have used hormone replacement therapy, to be nulliparous, to be former or current smokers, and to have a slightly higher body mass index; and less likely to have used oral contraceptives (all P<.001). There were no statistically significant differences between low and high consumers of lignans with regard to height at baseline, age at menopause, personal history of lobular carcinoma in situ or benign breast disease, family history of breast cancer in first- or second-degree relatives, or, among parous women, the number of children born and the woman’s age at the first full-term birth. The risk of postmenopausal breast cancer was statistically significantly and positively associated with alcohol
intake, height, menarche before 13 years of age, personal history of benign breast disease or lobular carcinoma in situ at baseline, family history of breast cancer, and use of hormone replacement therapy for more than 1 year (data not shown). Inverse associations were observed for being younger than 30 years at first full-term birth and for reaching menopause before 45 years of age (data not shown).
Table 1. Characteristics of the study population (N = 58 049) by quartile of total lignan intake Quartiles of total lignan intake*
Characteristics 1 (n = 14 513) 2 (n = 14 512) 3 (n = 14 512) 4 (n = 14 512) P †
Meanage at baseline, y (SD) 52.4 (6.5) 53.4 (6.6) 54.0 (6.6) 54.3 (6.6) <.001
Mean height at baseline, cm (SD) 161.3 (5.7) 161.3 (5.8) 161.3 (5.7) 161.5 (5.7) .14 Years of education‡, No.(%)
≤12 2039(14.0) 1728(11.9) 1539(10.6) 1433(9.9)
13-16 10327(71.2) 10385(71.6) 10431(71.9) 10050(69.2) <.001
≥17 2147(14.8) 2399(16.5) 2542(17.5) 3029(20.9)
Age at menarche, No.(%)
<13 y 6 362 (43.8) 6 560 (45.2) 6 664 (45.9) 6 873 (47.3)
13-14 y 6 588 (45.4) 6 642 (45.8) 6 498 (44.8) 6 323 (43.6) <.001
≥15 y 1 563 (10.8) 1 310 (9.0) 1 350 (9.3) 1 316 (9.1)
Age at menopause§, No.(%)
<45 y 869 (6.0) 862 (5.9) 869 (6.0) 865 (6.0)
45-55 y 1 3170 (90.7) 13 191 (90.9) 13 116 (90.4) 13 132 (90.5) .26
≥56 y 474 (3.3) 459 (3.2) 527 (3.6) 515 (3.5)
Ever use of oral contraceptive at baseline,
No.(%) 8 764 (60.4) 8 547 (58.9) 8 252 (56.9) 8 364 (57.6) <.001
Ever use of hormone replacement therapy at
baseline, No.(%) 4 186 (28.8) 4 873 (33.6) 5 275 (36.3) 5 516 (38.0) <.001
Age at 1st full-term birth and no. of live
births, No.(%)
<30 y, 1-2 7 136 (49.2) 7 059 (48.6) 7 128 (49.1) 6 959 (48.0)
<30 y, ≥3 4 130 (28.4) 4 290 (29.6) 4 159 (28.7) 4 124 (28.4) <.001
≥30 y, ≥1 1 638 (11.3) 1 452 (10.0) 1 444 (9.9) 1 362 (9.4)
Nulliparous 1 609 (11.1) 1 711 (11.8) 1 781 (12.3) 2 067 (14.2)
Personal history of benign breast disease║or
LCIS at baseline, No.(%) 4059(28.0) 4102(28.3) 4053(27.9) 4198(28.9) .20
Family history of breast cancer in 1st or 2nd
degree relatives, No.(%) 3297(22.7) 3411(23.5) 3371(23.2) 3392(23.4) .41
Body mass index at baseline¶, No.(%)
<18 kg/m² 597(4.1) 438(3.0) 400(2.8) 427(2.9)
18 to <25 kg/m² 10847(74.7) 10994(75.8) 10826(74.6) 10746(74.1) <.001
25 to <30 kg/m² 2447(16.9) 2526(17.4) 2660(18.3) 2765(19.0)
≥30 kg/m² 622(4.3) 554(3.8) 626(4.3) 574(4.0)
Smoking status at baseline, No.(%)
Never smoked 8793(60.6) 8569(59.0) 8135(56.1) 7614(52.5)
Former smoker 3733(25.7) 3987(27.5) 4412(30.4) 4853(33.4) <.001
Current smoker 1987(13.7) 1956(14.5) 1965(13.5) 2045(14.1)
* Total lignan intakes were computed as the sum of the intakes of pinoresinol, lariciresinol, secoisolariciresinol, and matairesinol and were adjusted for energy intake from food (excluding energy from alcohol from total energy intake) by the residual method (41). The range of each quartile (Q1: <878 μg/day; Q2: 878–1111 μg/day; Q3: 1112–1394 μg/day; Q4: 1395–5701 μg/day) was calculated by adding the residual range to the predicted lignan intake for the mean caloric intake from food (2082 kcal) for the study population according to the linear regression model. SD = standard deviation; LCIS = lobular carcinoma in situ.
† Calculated using the global two-sided chi-square test (for nominal variables), the two-sided Mantel–Haenszel chi-square test (for ordinal variables), or the two-sided Wald chi-square test (for continuous variables in the linear regression on quartiles of lignan intake); the lignan intake quartiles were used as an ordinal variable to which we assigned the median values measured in the population of each category.
‡ The 2378 (4%) missing values (590 in quartile 1, 590 in quartile 2, 560 in quartile 3, and 638 in quartile 4) were assigned the modal value of 13–16 years, which did not change the results.
§ Determined after baseline for women who were premenopausal at the time they completed the dietary questionnaire. || Includes fibrocystic breast disease, mastosis, and adenoma.
¶ Weight in kg/(height in m)2.
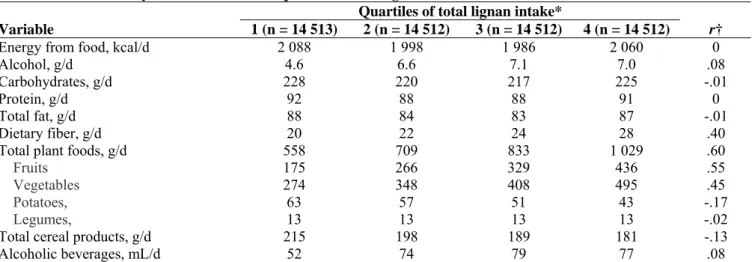
Overall, the median daily dietary intakes were 2031 kcal of energy from food (range = 536–5183 kcal/day), 6 g of alcohol (range = 0–180 g/day), and 23 g of fiber (range = 2–81 g/day). Across all four quartiles of lignan intake, women had generally similar diets in terms of their carbohydrate, protein, and total fat intakes (Table 2). However, higher consumers of lignans drank more alcoholic beverages; ate more fruits, vegetables, and fiber; and consumed smaller amounts of cereal products and potatoes than lower consumers of lignans. Among all participants, median intakes were 1112 μg/day of total lignans (range of residual values = 0–5702 μg/day) and 768 μg/day of total enterolignans (range of residual values = 0–2538 μg/day). Lariciresinol contributed 45% of the total lignan intake, pinoresinol 38%, secoisolariciresinol 16%, and matairesinol 1%; enterolactone contributed 63% of the total estimated enterolignan exposure and enterodiol 37%. Fruits and vegetables were the main sources of lignans (66% of total intake, with 35% of lignans from fruits, 30% from vegetables, 0.6% from potatoes, and 0.2% from legumes), followed by tea (11%), cereal products (7% of total intake, with 4% of lignans from bread, 2% from cold breakfast cereals, and 1% from rice and pasta), coffee (5%), and alcoholic drinks (5%).
Table 2. Median dietary intakes within each quartile of total lignan intake
Quartiles of total lignan intake*
Variable 1 (n = 14 513) 2 (n = 14 512) 3 (n = 14 512) 4 (n = 14 512) r†
Energy from food, kcal/d 2 088 1 998 1 986 2 060 0
Alcohol, g/d 4.6 6.6 7.1 7.0 .08
Carbohydrates, g/d 228 220 217 225 -.01
Protein, g/d 92 88 88 91 0
Total fat, g/d 88 84 83 87 -.01
Dietary fiber, g/d 20 22 24 28 .40
Total plant foods, g/d 558 709 833 1 029 .60
Fruits 175 266 329 436 .55
Vegetables 274 348 408 495 .45
Potatoes, 63 57 51 43 -.17
Legumes, 13 13 13 13 -.02
Total cereal products, g/d 215 198 189 181 -.13
Alcoholic beverages, mL/d 52 74 79 77 .08
* Total lignan intakes were computed as the sum of the intakes of pinoresinol, lariciresinol, secoisolariciresinol, and matairesinol and were adjusted for energy intake from food (excluding energy from alcohol from total energy intake) by the residual method (41). The range of each quartile (Q1: <878 μg/day; Q2: 878–1111 μg/day; Q3: 1112–1394 μg/day; Q4: 1395–5701 μg/day) was calculated by adding the residual range to the predicted lignan intake for the mean caloric intake from food (2082 kcal) for the study population according to the linear regression model.
† Spearman correlation coefficients were computed to assess the overall association between continuous dietary variables and the median value in each quartile of energy-adjusted total lignan intake, which was computed as a continuous variable. As a result of the residual method for energy adjustment, energy intake from food was not correlated with total lignan intake.
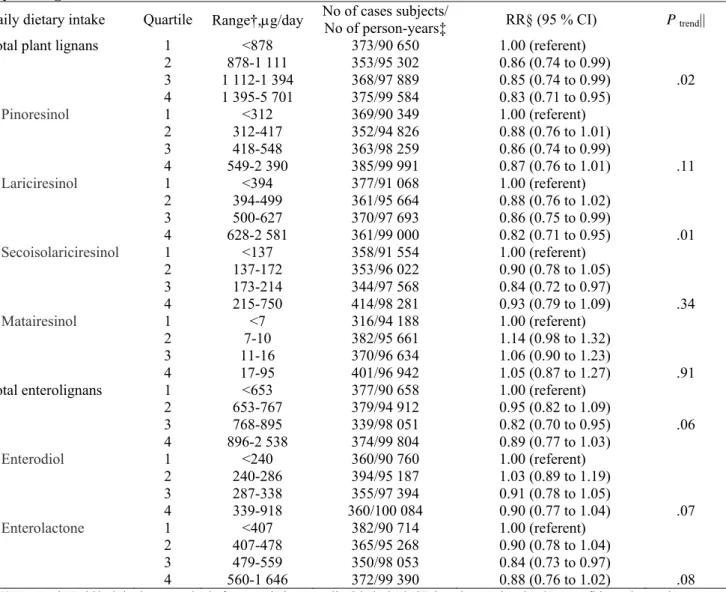
Compared with women in the lowest quartile of plant lignan intake (<878 μg/day), women in the highest quartile ( ≥1395 μg/day) had a statistically significant reduced risk of postmenopausal breast cancer (RR = 0.83, 95% CI = 0.71 to 0.96, Ptrend = .02) (Table 3). The incidence of breast cancer was 8.5% lower among women in
the highest quartile (376 cases per 100 000 person-years) than in the lowest quartile (411 cases per 100 000 person-years) of total lignan intake. Of the individual lignans, only intake of lariciresinol was statistically significantly associated with postmenopausal breast cancer risk (RR = 0.82, 95% CI = 0.71 to 0.95, Ptrend = .01).
Pinoresinol (RR = 0.87, 95% CI = 0.76 to 1.01, Ptrend = .12) and secoisolariciresinol (RR = 0.93, 95% CI = 0.79
to 1.09, Ptrend = .34) showed associations with breast cancer risk similar to that observed for lariciresinol without
reaching statistical significance. Although estimated total enterolignan exposures were well correlated with
lignan intakes (Spearman r = .63), the association between total enterolignan exposure and postmenopausal breast cancer risk was of only borderline statistical significance (RR = 0.89, 95% CI = 0.77 to 1.03, Ptrend = .06,
374 versus 415 cases per 100 000 personyears in the highest versus lowest quartile of intake). There was no interaction between phytoestrogen intakes and hormone replacement therapy use with respect to breast cancer risk (all P values for this interaction were between .10 and .66). Further sequential adjustment of our model of total lignan intakes for intakes of fiber and vitamin C, each of which was correlated with total lignan intake (Spearman r = .42 for fi ber and .71 for vitamin C), did not substantially modify the results (RR for highest versus lowest quartile of lignan intake after adjusting for fiber intake = 0.83, 95% CI = 0.69 to 1.01, Ptrend = .07
and RR for highest versus lowest quartile of lignan intake after adjusting for vitamin C intake = 0.82, 95% CI = 0.68 to 0.99, Ptrend = .08). Intakes of fiber and vitamin C were not associated with postmenopausal breast cancer
risk ( P = .97 and .89, respectively).
Table 3. Relative risk (RR) of breast cancer among 58 049 postmenopausal women in the E3N cohort by quartile of phytoestrogen intake*
Daily dietary intake Quartile Range†,μg/day No of cases subjects/ No of person-years‡ RR§ (95 % CI) P trend||
Total plant lignans 1 <878 373/90 650 1.00 (referent)
2 878-1 111 353/95 302 0.86 (0.74 to 0.99) 3 1 112-1 394 368/97 889 0.85 (0.74 to 0.99) .02 4 1 395-5 701 375/99 584 0.83 (0.71 to 0.95) Pinoresinol 1 <312 369/90 349 1.00 (referent) 2 312-417 352/94 826 0.88 (0.76 to 1.01) 3 418-548 363/98 259 0.86 (0.74 to 0.99) 4 549-2 390 385/99 991 0.87 (0.76 to 1.01) .11 Lariciresinol 1 <394 377/91 068 1.00 (referent) 2 394-499 361/95 664 0.88 (0.76 to 1.02) 3 500-627 370/97 693 0.86 (0.75 to 0.99) 4 628-2 581 361/99 000 0.82 (0.71 to 0.95) .01 Secoisolariciresinol 1 <137 358/91 554 1.00 (referent) 2 137-172 353/96 022 0.90 (0.78 to 1.05) 3 173-214 344/97 568 0.84 (0.72 to 0.97) 4 215-750 414/98 281 0.93 (0.79 to 1.09) .34 Matairesinol 1 <7 316/94 188 1.00 (referent) 2 7-10 382/95 661 1.14 (0.98 to 1.32) 3 11-16 370/96 634 1.06 (0.90 to 1.23) 4 17-95 401/96 942 1.05 (0.87 to 1.27) .91
Total enterolignans 1 <653 377/90 658 1.00 (referent)
2 653-767 379/94 912 0.95 (0.82 to 1.09) 3 768-895 339/98 051 0.82 (0.70 to 0.95) .06 4 896-2 538 374/99 804 0.89 (0.77 to 1.03) Enterodiol 1 <240 360/90 760 1.00 (referent) 2 240-286 394/95 187 1.03 (0.89 to 1.19) 3 287-338 355/97 394 0.91 (0.78 to 1.05) 4 339-918 360/100 084 0.90 (0.77 to 1.04) .07 Enterolactone 1 <407 382/90 714 1.00 (referent) 2 407-478 365/95 268 0.90 (0.78 to 1.04) 3 479-559 350/98 053 0.84 (0.73 to 0.97) 4 560-1 646 372/99 390 0.88 (0.76 to 1.02) .08
* E3N = Etude Epidémiologique auprès de femmes de la Mutuelle Générale de l'Education Nationale; CI = confidence interval.
† The range of each energy-adjusted phytoestrogen quartile was calculated by adding the residual range to the predicted phytoestrogen intake for the mean caloric intake from food (2082 kcal, excluding energy from alcohol from total energy intake) for the whole population according to the linear regression model.
‡ Total number of case subjects/total number of person-years = 1469/383 425.
§ Multivariable Cox regression analyses used age as the underlying time metric, were stratified by 5-year birth cohorts, and were adjusted for age at menarche (<13, 13–14, or ≥15 years); height (continuous); body mass index category (time-dependent variable according to height at baseline and weight at each follow-up questionnaire); personal history of benign breast disease (includes fibrocystic breast disease, mastosis, and adenoma) or lobular carcinoma in situ (yes or no); family history of breast cancer in first- or second-degree
relatives (yes or no); lifetime use of oral contraceptives (ever or never); hormone replacement therapy use initiated before the previous year (as a time-dependent variable, yes or no); age at first full-term birth and number of live births (nulliparous, <30 years and 1–2, <30 years and ≥3, or ≥30 years and ≥1); age at menopause (<45, 4–55, or ≥56 years); geographic area at baseline; alcohol consumption (continuous); smoking status (never, former, or current); and dietary energy intake from food (continuous) using the residual method. || To test for linear trend across phytoestrogen quartiles, we assigned the median value for the study population to each category and used these values as a continuous variable.
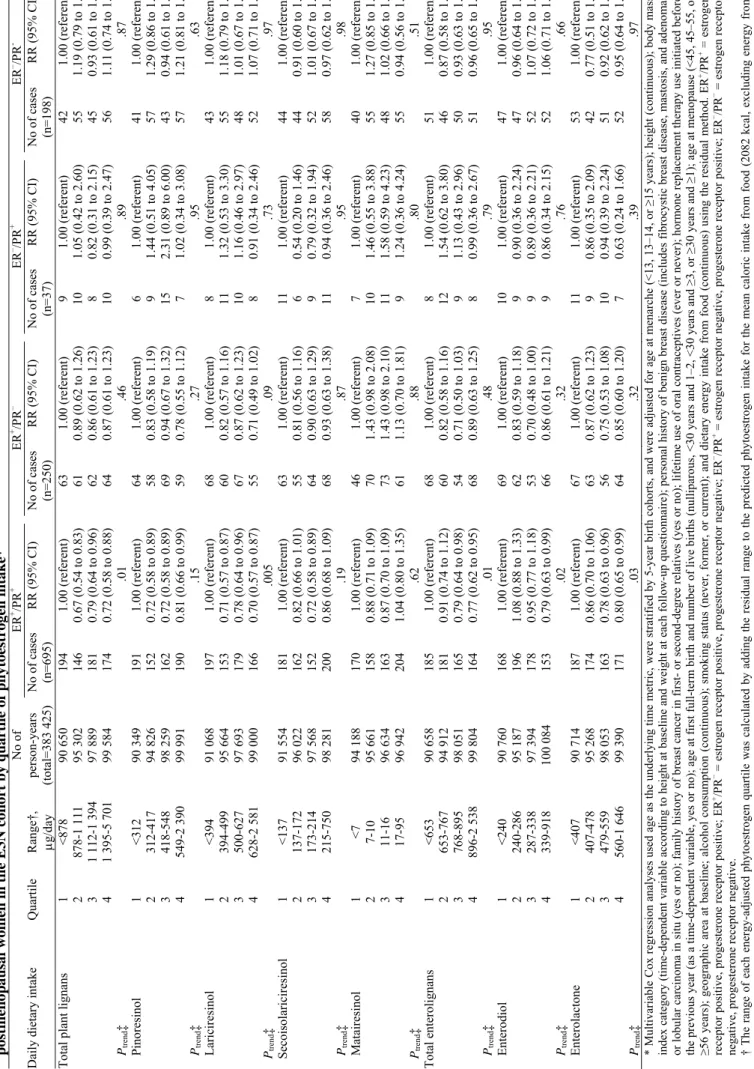
We next stratified the risk analyses according to the combined ER/PR status of the tumor. Among the 1180 breast tumors with known ER and PR status, 695 (59%) were positive for both ER and PR (ER+/PR+), 250 (21%) were positive for ER only (ER+/PR−), 198 (17%) were negative for both ER and PR (ER−/PR−), and 37 (3%) were positive for PR only (ER−/PR+). All of the statistically significant inverse associations we observed
between phytoestrogen intakes and postmenopausal breast cancer risk were limited to ER+/PR+ disease (Table
4). Compared with women in the lowest intake quartiles, women in the highest intake quartiles for total plant lignans and total enterolignans had a statistically significant reduced risk of ER+/PR+ breast cancer (RR = 0.72,
95% CI = 0.58 to 0.88, Ptrend = .01 and RR = 0.77, 95% CI = 0.62 to 0.95, Ptrend = .009, respectively). The
incidence of postmenopausal ER+/PR+ breast cancer was 18.4% lower among women in the highest quartile (174
cases per 100 000 person-years) than in the lowest quartile (214 cases per 100 000 person-years) of total lignan intake; for total enterolignan intake, the absolute risk was 19.5% lower among women in the highest (164 cases per 100 000 person-years) than the lowest (204 cases per 100 000 person-years) quartiles. Among the plant lignans, lariciresinol intake was statistically significantly associated with a reduced risk of ER+/PR+ breast cancer
and pinoresinol and secoisolariciresinol intakes were borderline statistically significantly associated. Estimated exposures to both enterolignans (enterodiol and enterolactone) were statistically significantly associated with a reduced risk of ER+/PR+ breast cancer (Table 4). There was no statistically significant association between
intakes of total plant lignans or estimated total enterolignan exposures and the risks of ER+/PR−, ER−/PR+, or
ER−/PR− breast cancer, although the results for the ER+/PR− tumors suggested an inverse relationship (Table 4).
Discussion
In this large prospective study, women who had the highest dietary intakes of total plant lignans, and of lariciresinol in particular, had a statistically significant lower risk of postmenopausal breast cancer compared with women who had the lowest intakes. These inverse associations were restricted to ER+/PR+ breast cancers,
for which we also observed inverse associations between breast cancer risk and intakes of enterolignans. All studies published to date that have shown that higher levels of circulating or excreted enterolignans are associated with a statistically significant reduction in the risk of postmenopausal breast cancer have been biomarker studies (13, 43, 44). To our knowledge, this is the first prospective study using dietary questionnaire data to show statistically significant inverse associations between dietary lignan intakes or estimated levels of metabolized enterolignans and breast cancer risk in postmenopausal women.
The inverse associations between dietary lignan intakes and postmenopausal breast cancer risk in Western populations have been investigated in two prospective (45, 46) and four case–control (5, 47–49) studies. None of these studies found an overall association, but two studies (45, 48) reported a suggestive trend for an inverse association on the basis of subanalyses of postmenopausal participants. In all six study populations, the levels of dietary lignan intake were defined as the sum of the secoisolariciresinol and matairesinol intakes, which were of the same order of magnitude as the combined secoisolariciresinol and matairesinol intakes in our study (approximately 0 to 0.8 mg/day). Intakes of lariciresinol and pinoresinol were not evaluated in those six previous studies, whereas in our study they accounted for 83% of the plant lignan intake. It is therefore likely that all six previous studies underestimated dietary lignan intake, which may explain why no association with breast cancer risk was detected.
In our study, the median total plant lignan intake was 1.1 mg/day and ranged from approximately 0 to 5 mg/day. The lignans consumed by our cohort originated from a wide variety of sources including fruits, vegetables, tea, coffee, and cereal products, similarly to diets estimated in other studies of Western countries (33, 50, 51); in particular, in this study, the main sources of lariciresinol were cruciferous vegetables, green beans, citrus fruits, pears, tea, coffee, and bread. As for the food sources of lignans, we note that the traditional French diet does not contain flaxseed, which is the food containing the highest concentration of lignans. However, lignan intakes are probably increasing in France, as they are in other Western countries such as Finland and North America, because the recent introduction of flaxseeds in multigrain bread making may provide a major source of lignans (52). Although the main sources of lignans in Western countries probably vary according to the foods eaten there, assessments of more types of lignans in dietary studies might well reveal more consistent associations between phytoestrogen intakes and the risk of breast cancer.
Tabl e 4. Relative risk (RR) of bre a st cancer and 95% confidence inter val (CI) by co m b ined estr oge n and proges terone receptor (E R/PR) s tat us a m o n g 58 049 pos tmen op aus a l w o me n i n t h e E 3 N c o h o rt b y q u ar ti le o f ph y toes tr oge n i n ta ke * No of ER + /PR + ER + /PR – ER – /PR + ER – /PR -D
aily dietary intake
Q uartile Range† , μg/day person-years (total=383 425) No of cases (n=695) RR (95% CI) No of cases (n=250) RR (95% CI) No of cases (n=37) RR (95% CI) No of cases (n=198) RR (95% CI)
Total plant lignan
s 1 <878 90 650 194 1.00 (referent) 63 1. 00 (referent) 9 1.00 (referent) 42 1.00 (referent) 2 878-1 11 1 95 302 146 0.67 (0.5 4 to 0.83 ) 61 0.89 (0.6 2 to 1.26 ) 10 1.05 (0.4 2 to 2.60 ) 55 1.19 (0.7 9 to 1.78 ) 3 1 112-1 394 97 889 181 0.79 (0.6 4 to 0.96 ) 62 0.86 (0.6 1 to 1.23 ) 8 0.82 (0.3 1 to 2.15 ) 45 0.93 (0.6 1 to 1.43 ) 4 1 395-5 701 99 584 174 0.72 (0.5 8 to 0.88 ) 64 0.87 (0.6 1 to 1.23 ) 10 0.99 (0.3 9 to 2.47 ) 56 1.11 (0.7 4 to 1.67 ) Ptrend ‡ .0 1 .46 .89 .87 Pinoresinol 1 <312 90 349 191 1.00 (referent) 64 1.00 (referent) 6 1.00 (referent) 41 1.00 (referent) 2 312-417 94 826 152 0.72 (0.5 8 to 0.89 ) 58 0.83 (0.5 8 to 1.19 ) 9 1.44 (0.5 1 to 4.05 ) 57 1.29 (0.8 6 to 1.94 ) 3 418-548 98 259 162 0.72 (0.5 8 to 0.89 ) 69 0.94 (0.6 7 to 1.32 ) 15 2.31 (0.8 9 to 6.00 ) 43 0.94 (0.6 1 to 1.44 ) 4 549-2 39 0 99 991 190 0.81 (0.6 6 to 0.99 ) 59 0.78 (0.5 5 to 1.12 ) 7 1.02 (0.3 4 to 3.08 ) 57 1.21 (0.8 1 to 1.82 ) Ptrend ‡ .15 .27 .95 .63 Lariciresinol 1 <394 91 068 197 1.00 (referent) 68 1.00 (referent) 8 1.00 (referent) 43 1.00 (referent) 2 394-499 95 664 153 0.71 (0.5 7 to 0.87 ) 60 0.82 (0.5 7 to 1.16 ) 11 1.32 (0.5 3 to 3.30 ) 55 1.18 (0.7 9 to 1.77 ) 3 500-627 97 693 179 0.78 (0.6 4 to 0.96 ) 67 0.87 (0.6 2 to 1.23 ) 10 1.16 (0.4 6 to 2.97 ) 48 1.01 (0.6 7 to 1.52 ) 4 628-2 58 1 99 000 166 0.70 (0.5 7 to 0.87 ) 55 0.71 (0.4 9 to 1.02 ) 8 0.91 (0.3 4 to 2.46 ) 52 1.07 (0.7 1 to 1.61 ) Ptr end ‡ .005 .09 .73 .97 Secoisolariciresinol 1 <137 91 554 181 1.00 (referent) 63 1.00 (referent) 11 1.00 (referent) 44 1.00 (referent) 2 137-172 96 022 162 0.82 (0.6 6 to 1.01 ) 55 0.81 (0.5 6 to 1.16 ) 6 0.54 (0.2 0 to 1.46 ) 44 0.91 (0.6 0 to 1.38 ) 3 173-214 97 568 152 0.72 (0.5 8 to 0.89 ) 64 0.90 (0.6 3 to 1.29 ) 9 0.79 (0.3 2 to 1.94 ) 52 1.01 (0.6 7 to 1.51 ) 4 215-750 98 281 200 0.86 (0.6 8 to 1.09 ) 68 0.93 (0.6 3 to 1.38 ) 11 0.94 (0.3 6 to 2.46 ) 58 0.97 (0.6 2 to 1.53 ) Ptrend ‡ .19 .87 .95 .98 M atairesinol 1 <7 94 188 170 1.00 (referent) 46 1.00 (referent) 7 1.00 (referent) 40 1.00 (referent) 2 7-10 95 661 158 0.88 (0.7 1 to 1.09 ) 70 1.43 (0.9 8 to 2.08 ) 10 1.46 (0.5 5 to 3.88 ) 55 1.27 (0.8 5 to 1.92 ) 3 11-16 96 634 163 0.87 (0.7 0 to 1.09 ) 73 1.43 (0.9 8 to 2.10 ) 11 1.58 (0.5 9 to 4.23 ) 48 1.02 (0.6 6 to 1.57 ) 4 17-95 96 942 204 1.04 (0.8 0 to 1.35 ) 61 1.13 (0.7 0 to 1.81 ) 9 1.24 (0.3 6 to 4.24 ) 55 0.94 (0.5 6 to 1.56 ) Ptr end ‡ .62 .88 .80 .51 Total enterolignans 1 <653 90 658 185 1.00 (referent) 68 1.00 (referent) 8 1.00 (referent) 51 1.00 (referent) 2 653-767 94 912 181 0.91 (0.7 4 to 1.12 ) 60 0.82 (0.5 8 to 1.16 ) 12 1.54 (0.6 2 to 3.80 ) 46 0.87 (0.5 8 to 1.30 ) 3 768-895 98 051 165 0.79 (0.6 4 to 0.98 ) 54 0.71 (0.5 0 to 1.03 ) 9 1.13 (0.4 3 to 2.96 ) 50 0.93 (0.6 3 to 1.39 ) 4 896-2 53 8 99 804 164 0.77 (0.6 2 to 0.95 ) 68 0.89 (0.6 3 to 1.25 ) 8 0.99 (0.3 6 to 2.67 ) 51 0.96 (0.6 5 to 1.43 ) Ptrend ‡ .0 1 .48 .79 .95 Enterodiol 1 <240 90 760 168 1.00 (referent) 69 1.00 (referent) 10 1.00 (referent) 47 1.00 (referent) 2 240-286 95 187 196 1.08 (0.8 8 to 1.33 ) 62 0.83 (0.5 9 to 1.18 ) 9 0.90 (0.3 6 to 2.24 ) 47 0.96 (0.6 4 to 1.44 ) 3 287-338 97 394 178 0.95 (0.7 7 to 1.18 ) 53 0.70 (0.4 8 to 1.00 ) 9 0.89 (0.3 6 to 2.21 ) 52 1.07 (0.7 2 to 1.59 ) 4 339-918 100 08 4 153 0.79 (0.6 3 to 0.99 ) 66 0.86 (0.6 1 to 1.21 ) 9 0.86 (0.3 4 to 2.15 ) 52 1.06 (0.7 1 to 1.59 ) Ptrend ‡ .02 .32 .76 .66 Enterolactone 1 <407 90 714 187 1.00 (referent) 67 1.00 (referent) 11 1.00 (referent) 53 1.00 (referent) 2 407-478 95 268 174 0.86 (0.7 0 to 1.06 ) 63 0.87 (0.6 2 to 1.23 ) 9 0.86 (0.3 5 to 2.09 ) 42 0.77 (0.5 1 to 1.15 ) 3 479-559 98 053 163 0.78 (0.6 3 to 0.96 ) 56 0.75 (0.5 3 to 1.08 ) 10 0.94 (0.3 9 to 2.24 ) 51 0.92 (0.6 2 to 1.36 ) 4 560-1 64 6 99 390 171 0.80 (0.6 5 to 0.99 ) 64 0.85 (0.6 0 to 1.20 ) 7 0.63 (0.2 4 to 1.66 ) 52 0.95 (0.6 4 to 1.40 ) Ptrend ‡ .03 .32 .39 .97
* Multivariable Cox regression analyses used age as the underly
ing ti m e m etri c, w ere st ratified by 5-year bi rth cohorts, and we re adjusted for age at m enarche ( < 13, 1 3–14, or ≥ 15 y ear s) ; height ( continuo us) ; body m as s
index category (ti
m
e-dependent vari
able acco
rding to height at baseline
and weight
at each f
ollow-up questionnaire); personal h
istor y of benign br east disease ( includes fibr ocy stic br east disease, m astos is, and adeno m a) or lobular car cinom a in situ (y es or no) ; fam ily history of br east cancer in fir or second-degr ee r elatives (y es or no) ; lif eti m e use of
oral contraceptives (ever or ne
ver); hor m one r eplace m ent the rapy u se initiated bef or e
the previous year
(as a ti
m
e-dependent va
riable,
yes or
no); age at first full-ter
m
birth and num
be r of live births (nulliparou s, <30 y ear s and 1–2, <30 y ear s and ≥3, or ≥ 30 y ear s and ≥1) ; age at m enopause ( < 45, 45–55, or ≥56 y ear s) ; geogr aphic ar ea at baseline; alc ohol cons um ption ( continuou s) ; s m oking status ( never , form er , or cur re nt) ; and dieta ry ener gy intake fr om food ( contin uous) usin g the r esidual m ethod. E R +/PR + = estr ogen
receptor positive, progesterone receptor positive; ER
+/PR − = estrogen receptor positive,
prog
esterone receptor negative; ER
−/PR + = estrogen receptor negative,
progest
erone receptor pos
itive; ER
−/PR − = estrogen receptor
negative, progesterone receptor negati
ve.
† The range of ea
ch energy-adj
usted phytoestrogen quartile was cal
culated by adding t
he residual
range to the predicted phytoes
tr ogen intake for the m ean calor ic intake fr om food ( 2082 kcal, excludi ng ener gy fro m alcohol fro m total energy
intake) for the whole
populati on according to th e linear regression m odel .
‡ To test for linear trend across phy
to estr ogen quartiles, we assigned the m edian va
lue for the study
population t
o each catego
ry
an
d used these values as a continuous v
ar
iable.
Our findings of inverse associations between enterolignan exposure and the risk of postmenopausal breast cancer are consistent with those of the four case–control studies of serum or urinary biomarkers conducted to date (13–16), even though ours are based on indirectly estimated enterolignan levels. Of six prospective biomarker studies (6, 8–12), only one (6) reported an inverse association between plasma enterolactone concentrations and postmenopausal breast cancer risk; it is unclear why the five other studies (8–12) did not detect any association, especially because the level of enterolignan exposure was consistent across all biomarker studies.
It may be argued that lignan and enterolignan information is redundant in our study and that lignans alone should be considered because those are compounds provided by the diet. Nevertheless, we examined enterolignans as well as plant lignans to provide two different approaches to study the effects of dietary lignans and also because enterolignans are the bioactive components relevant to cancer prevention (1). The amounts of enterolignans that are produced from different foods have been measured by a technique that involves in vitro fermentation of plant foods with human fecal microbiota, which simulates colonic fermentation (7). In this study, we used enterolignan values estimated by this technique to indirectly estimate all lignans (precursors of the enterolignans) present in foods. Total enterolignan values estimated by this technique integrate other lignans and unknown precursors that cannot be assessed otherwise due to the unavailability of food composition data. For example, the lignins, which are polyphenolic plant constituents responsible for the rigidity of wood, were suggested to be major dietary precursors of enterolignans, at least in rats (53), but have never been analyzed in foods.
Our finding that all of the statistically significant inverse associations we observed between phytoestrogen intakes and postmenopausal breast cancer risk were restricted to ER+/PR+ breast cancers supports
a differential role of phytoestrogens or their food sources according to hormonal receptor status as has been previously suggested (1, 19, 21, 22). This finding is consistent with that of a large case–control study (19) that reported a reduced risk of postmenopausal ER+/PR+ breast cancer associated with higher intakes of leafy or
yellow vegetables. The authors of that study found no clear association between the risk of postmenopausal ER+/PR+ breast cancer and the carotenoids contained in such vegetables. By contrast, our results suggest that
lignans, especially lariciresinol, might be among the bioactive plant compounds involved in reducing postmenopausal ER+/PR+ breast cancer risk. These results differ from those of a large prospective study (21),
which showed a reduced risk of ER− postmenopausal breast cancer with higher intakes of fruits, vegetables, and
whole grains after adjustment for hormonal exposure factors, and from another prospective study, which reported a reduced risk of ERα-negative postmenopausal breast cancer associated with a higher consumption of fruits and vegetables (22) or higher plasma enterolactone concentrations (6). One case–control study (49) and two prospective studies (11, 46) found no association between postmenopausal ER+ or ER− breast cancer risk
and dietary, plasma, or urinary lignans; however, those studies had limited statistical power to detect such associations because the dietary lignan intakes were relatively low and too homogeneous (46, 49) or because of a small study size (11).
We cannot conclude definitely from our results that lignans have specific biologic effects that influence their association with breast carcinogenesis or that they are good biomarkers for particular nutrients or food sources. However, our finding that adjustments for fiber and vitamin C intakes did not remove the statistical significance for the association between lignan intake and postmenopausal breast cancer risk suggests that lignans have specific biologic effects. Furthermore, the inverse associations we observed between lignan intakes and risk of ER+/PR+ breast cancer suggest that the biologic effects may be mediated through hormonal receptors,
a plausible interpretation given that phytoestrogens have hormone-like properties whereas vitamins, which did not show any association with breast cancer risk (19), do not (54). Because of their structural similarity to 17 β-estradiol, phytoestrogens are natural ligands of ERs and are believed to be naturally existing SERMs (1). They might therefore act as anticarcinogens, either through antiestrogenic actions (e.g., by competing with estradiol to bind ERs) or by initiating their own anticarcinogenic effects (e.g., by recruiting specific transcriptional coregulators to phytoestrogen-activated ERs). Finally, phytoestrogens or their plant sources might modulate ER protein expression and degradation and therefore influence the hormonal status of both normal tissues and tumors, as has been previously suggested (25, 55), just as estradiol decreases expression of ER (56).
This study found no statistically significant association between lignan or enterolignan intakes and ER+/PR– postmenopausal breast cancer risk. Given the small number of ER+/PR– tumors and the magnitude of
the risks for these cases, low statistical power is probably a large part of the reason for these non–statistically
significant associations. An alternative explanation would be based on molecular aspects. In this study, ER status most likely referred to the expression of the nuclear α subtype of the receptor, the predominant subtype in breast tissue and the subtype commonly detected by the analytical methods used in clinical practice. Because PR expression mostly depends on ERα activity (57), our observation that there were no inverse associations between phytoestrogen intakes and the risk of postmenopausal breast cancer in the absence of PR despite ERα expression (i.e., ER+/PR− tumors) agrees with the molecular theories that, in the absence of PR expression, ER is
nonfunctional (57) or other growth factor receptor pathways are activated (58). In other words, it is possible that ER+/PR− tumors are “resistant” to phytoestrogens, just as they are to SERM therapy (57).
The strengths of our study include the large population, the long follow-up, and the use of a comprehensive food composition table for lignans and enterolignans. The resulting large range of intakes provided increased statistical power to detect associations other than those that occurred by chance. Because we included lariciresinol and pinoresinol, whose associations with breast cancer risk were evaluated here for the first time, to our knowledge, the estimated lignan intakes were much higher than those reported in previous dietary studies. The prospective design of our study precluded differential recall bias between case subjects and non– case subjects. Finally, we adjusted for a large number of hormonal factors that could have acted as potential confounders, including age at menarche and at menopause, parity, age at first full-term birth, and lifetime use of exogenous hormones (oral contraceptive and hormone replacement therapy).
Our study also has limitations related to exposure misclassification, confounding, endpoint misclassification, and generalizability of the results. First, we cannot exclude possible misclassification bias arising from reporting error although this would most likely result in the underestimation of the true association. In general, we assumed that the diet reported over the previous year reflected long-term dietary habits. However, we were not able to assess possible changes in dietary habits during the follow-up period. As for lignans specifically, our use of a simple summation of four lignans to provide a total lignan intake did not account for other lignans or other potential enterolignan precursors, such as lignins, for which food composition data are not available; therefore, we also evaluated each individual lignan in risk analyses. Our estimates of lignan dietary intakes were also potentially limited by the food database used in this study. We had to rely on data compiled from various sources because, at present, there is no complete food composition database for lignans. The values assigned to the foods were based on food supplies that originated from different countries and on different analytical techniques and were estimated in different laboratories. Although values for the same foods may vary in the literature according to the source of data, most of the different values available for one food were consistent with each other. As for enterolignans, our indirect estimation of enterolignan exposures from the dietary intake data did not take into account interindividual differences in the characteristics of intestinal microflora or in enterolignan metabolism, such as absorption and excretion rates (1); however, enterolignan production obtained via the in vitro method has been shown to be well correlated with urinary lignan excretion (7). Also, we do not know the relative bioactivity of each enterolignan but the summation of all enterolignans would likely result in misclassification bias and would decrease the statistical power.
Second, as in other observational studies, we cannot rule out that the associations we observed have resulted from confounding bias, although we adjusted the analyses for known risk factors of breast cancer, in particular hormonal factors. With respect to phytoestrogens specifically, we note that our dietary questionnaire did not cover soy foods. However, given that soy foods were probably consumed at very low levels by our study population (59), it is unlikely that their omission from the dietary questionnaire affected our assessment of lignan intake or was a potential confounding factor in this study of lignan intake and breast cancer risk. Third, endpoint misclassification may have hampered our analysis of breast cancer by receptor status because assessment of ER status probably referred only to the expression of ERα and not ERβ, which is the subtype of ER that phytoestrogens preferentially bind (60). However, our results are relevant to breast carcinogenesis because ERα is the predominant form of the receptor expressed in normal breast tissue and its level increases dramatically in premalignant tissues (61). Fourth, the women in our cohort were self-selected volunteers who were recruited from among employees of the public education health system or their families and thus were not a representative sample of the general French population. The cohort members were highly educated and, compared with nationally representative samples of the French population, had higher rates of breast cancer (62) even though they may have had more health-conscious dietary practices. Thus, as is true for many other large cohort studies based on selected populations, it may not be possible to extrapolate our findings to the general population.
However, if the association between dietary lignan intakes and breast cancer risk in our population reflects a true biologic mechanism, this mechanism may be relevant to the general population.
In conclusion, the results of this large prospective study of French women showed that higher dietary intakes of lignans were associated with a reduction in the risk of postmenopausal breast cancers, particularly those positive for both ER and PR. This finding is potentially important for public health policies because the increasing ER+/PR+ subtype incidence rates are thought to explain most of the increasing incidence of breast
cancer in Western countries (63) and the higher rates in Western countries than in Asia (64). Although the possible role of plant foods in breast cancer prevention is still debated, increasing dietary lignan intake may be an interesting potential preventive approach. In particular, individual differences in the metabolism of plant lignans into enterolignans and the mechanisms behind the potential biologic actions of enterolignans in breast carcinogenesis need to be better understood. In view of the epidemiologic results of this study, the recommendation that women should consume diets that consist largely of fruits, vegetables, and cereals (65) — all foods rich in lignans— should continue.
References
(1) Tham DM, Gardner CD, Haskell WL. Clinical review 97: potential health benefits of dietary phytoestrogens: a review of the clinical, epidemiological, and mechanistic evidence. J Clin Endocrinol Metab 1998;83:2223–35. (2) Deapen D, Liu L, Perkins C, Bernstein L, Ross RK. Rapidly rising breast cancer incidence rates among
Asian-American women. Int J Cancer 2002;99:747–50.
(3) Ziegler RG, Hoover RN, Pike MC, Hildesheim A, Nomura AM, West DW, et al. Migration patterns and breast cancer risk in Asian-American women. J Natl Cancer Inst 1993;85:1819–27.
(4) Trock BJ, Hilakivi-Clarke L, Clarke R. Meta-analysis of soy intake and breast cancer risk. J Natl Cancer Inst 2006;98:459–71.
(5) McCann SE, Muti P, Vito D, Edge SB, Trevisan M, Freudenheim JL. Dietary lignan intakes and risk of pre- and postmenopausal breast cancer. Int J Cancer 2004;111:440–3.
(6) Olsen A, Knudsen KE, Thomsen BL, Loft S, Stripp C, Overvad K, et al. Plasma enterolactone and breast cancer incidence by estrogen receptor status. Cancer Epidemiol Biomarkers Prev 2004;13:2084–9.
(7) Thompson LU, Robb P, Serraino M, Cheung F. Mammalian lignan production from various foods. Nutr Cancer 1991;16:43–52.
(8) Hulten K, Winkvist A, Lenner P, Johansson R, Adlercreutz H, Hallmans G. An incident case-referent study on plasma enterolactone and breast cancer risk. Eur J Nutr 2002;41:168–76.
(9) Grace PB, Taylor JI, Low YL, Luben RN, Mulligan AA, Botting NP, et al. Phytoestrogen concentrations in serum and spot urine as biomarkers for dietary phytoestrogen intake and their relation to breast cancer risk in European prospective investigation of cancer and nutrition-Norfolk. Cancer Epidemiol Biomarkers Prev 2004;13:698–708. (10) Zeleniuch-Jacquotte A, Adlercreutz H, Shore RE, Koenig KL, Kato I, Arslan AA, et al. Circulating enterolactone
and risk of breast cancer: a prospective study in New York. Br J Cancer 2004;91:99–105.
(11) den Tonkelaar I, Keinan-Boker L, van’t Veer P, Arts CJ, Adlercreutz H, Thijssen JH, et al. Urinary phytoestrogens and postmenopausal breast cancer risk. Cancer Epidemiol Biomarkers Prev 2001;10:223–8.
(12) Kilkkinen A, Virtamo J, Vartiainen E, Sankila R, Virtanen MJ, Adlercreutz H, et al. Serum enterolactone concentration is not associated with breast cancer risk in a nested case–control study. Int J Cancer 2004;108:277– 80.
(13) Ingram D, Sanders K, Kolybaba M, Lopez D. Case–control study of phyto-oestrogens and breast cancer. Lancet 1997;350:990–4.
(14) Pietinen P, Stumpf K, Mannisto S, Kataja V, Uusitupa M, Adlercreutz H. Serum enterolactone and risk of breast cancer: a case–control study in eastern Finland. Cancer Epidemiol Biomarkers Prev 2001;10:339–44.
(15) Boccardo F, Lunardi G, Guglielmini P, Parodi M, Murialdo R, Schettini G, et al. Serum enterolactone levels and the risk of breast cancer in women with palpable cysts. Eur J Cancer 2004;40:84–9.
(16) Dai Q, Franke AA, Jin F, Shu XO, Hebert JR, Custer LJ, et al. Urinary excretion of phytoestrogens and risk of breast cancer among Chinese women in Shanghai. Cancer Epidemiol Biomarkers Prev 2002;11:815–21.
(17) van Gils CH, Peeters PH, Bueno-de-Mesquita HB, Boshuizen HC, Lahmann PH, Clavel-Chapelon F, et al. Consumption of vegetables and fruits and risk of breast cancer. JAMA 2005;293:183–93.
(18) Riboli E, Norat T. Epidemiologic evidence of the protective effect of fruit and vegetables on cancer risk. Am J Clin Nutr 2003;78:559S–69S.
(19) Gaudet MM, Britton JA, Kabat GC, Steck-Scott S, Eng SM, Teitelbaum SL, et al. Fruits, vegetables, and micronutrients in relation to breast cancer modified by menopause and hormone receptor status. Cancer Epidemiol Biomarkers Prev 2004;13:1485–94.
(20) Malin AS, Qi D, Shu XO, Gao YT, Friedmann JM, Jin F, et al. Intake of fruits, vegetables and selected micronutrients in relation to the risk of breast cancer. Int J Cancer 2003;105:413–8.
(21) (21) Fung TT, Hu FB, Holmes MD, Rosner BA, Hunter DJ, Colditz GA, et al. Dietary patterns and the risk of postmenopausal breast cancer. Int J Cancer 2005;116:116–21.
(22) Olsen A, Tjonneland A, Thomsen BL, Loft S, Stripp C, Overvad K, et al. Fruits and vegetables intake differentially affects estrogen receptor negative and positive breast cancer incidence rates. J Nutr 2003;133:2342–7.
(23) Messina MJ. Legumes and soybeans: overview of their nutritional profi les and health effects. Am J Clin Nutr 1999;70:439S–50S.
(24) Low YL, Taylor JI, Grace PB, Dowsett M, Scollen S, Dunning AM, et al. Phytoestrogen exposure correlation with plasma estradiol in postmenopausal women in European Prospective Investigation of Cancer and Nutrition-Norfolk may involve diet-gene interactions. Cancer Epidemiol Biomarkers Prev 2005;14:213–20.
(25) Touillaud MS, Pillow PC, Jakovljevic J, Bondy ML, Singletary SE, Li D, et al. Effect of dietary intake of phytoestrogens on estrogen receptor status in premenopausal women with breast cancer. Nutr Cancer 2005;51 :162–9.
(26) Kesse E, Boutron-Ruault MC, Clavel-Chapelon F. Regional dietary habits of French women born between 1925 and 1950. Eur J Nutr 2005;44:285–92.
(27) Riboli E. Nutrition and cancer: background and rationale of the European Prospective Investigation into Cancer and Nutrition (EPIC). Ann Oncol 1992;3:783–91.
(28) Ferrari P, Slimani N, Ciampi A, Trichopoulou A, Naska A, Lauria C, et al. Evaluation of under- and overreporting of energy intake in the 24-hour diet recalls in the European Prospective Investigation into Cancer and Nutrition (EPIC). Public Health Nutr 2002;5:1329–45.
(29) van Liere MJ, Lucas F, Clavel F, Slimani N, Villeminot S. Relative validity and reproducibility of a French dietary history questionnaire. Int J Epidemiol 1997;26 Suppl 1:S128–36.
(30) Favier JC, Ireland-Ripert J, Toque C, Feinberg M. Répertoire Général des Aliments. Table de composition (composition tables). INRA, CIQUAL-REGAL, editors. 2nd ed. Paris (France): Tec & Doc Lavoisier;1995.
(31) Su.Vi.Max. Table de composition des aliments. Paris (France): Economica;2006.
(32) Adlercreutz H, Mazur W. Phyto-oestrogens and Western diseases. Ann Med 1997;29:95–120.
(33) Keinan-Boker L, van der Schouw YT, de Kleijn MJ, Jacques PF, Grobbee DE, Peeters PH. Intake of dietary phytoestrogens by Dutch women. J Nutr 2002;132:1319–28.
(34) de Kleijn MJ, van der Schouw YT, Wilson PW, Adlercreutz H, Mazur W, Grobbee DE, et al. Intake of dietary phytoestrogens is low in postmenopausal women in the United States: the Framingham study. J Nutr 2001;131:1826–32.
(35) Liggins J, Bluck LJ, Runswick S, Atkinson C, Coward WA, Bingham SA. Daidzein and genistein contents of vegetables. Br J Nutr 2000;84:717–25.
(36) Mazur W. Phytoestrogen content in foods. Baillieres Clin Endocrinol Metab 1998;12:729–42.
(37) Antignac JP, Cariou R, Le Bizec B, André F. New data regarding phytoestrogens content in bovine milk. Food Chem 2004;87:275–81.
(38) Kiely M, Faughnan M, Wahala K, Brants H, Mulligan A. Phyto-oestrogen levels in foods: the design and construction of the VENUS database. Br J Nutr 2003;89 Suppl 1: 808–13.
(39) Milder IE, Arts IC, van de PB, Venema DP, Hollman PC. Lignan contents of Dutch plant foods: a database including lariciresinol, pinoresinol, secoisolariciresinol and matairesinol. Br J Nutr 2005;93: 393–402.
(40) Liggins J, Bluck LJ, Runswick S, Atkinson C, Coward WA, Bingham SA. Daidzein and genistein content of fruits and nuts. J Nutr Biochem 2000;11:326–31.
(41) Willett W, Stampfer M. Implications of total energy intake for epidemiologic analyses. In: Willett W, editor. Nutritional epidemiology. 2nd ed. New York (NY): Oxford University Press;1998. p. 273–301.
(42) Korn EL, Graubard BI, Midthune D. Time-to-event analysis of longitudinal follow-up of a survey: choice of the time-scale. Am J Epidemiol 1997;145:72–80.
(43) Adlercreutz H, Fotsis T, Heikkinen R, Dwyer JT, Woods M, Goldin BR, et al. Excretion of the lignans enterolactone and enterodiol and of equol in omnivorous and vegetarian postmenopausal women and in women with breast cancer. Lancet 1982;320:1295–9.
(44) Dai Q, Franke AA, Yu H, Shu XO, Jin F, Hebert JR, et al. Urinary phytoestrogen excretion and breast cancer risk: evaluating potential effect modifiers endogenous estrogens and anthropometrics. Cancer Epidemiol Biomarkers Prev 2003;12:497–502.
(45) Keinan-Boker L, van der Schouw YT, Grobbee DE, Peeters PH. Dietary phytoestrogens and breast cancer risk. Am J Clin Nutr 2004;79:282–8.
(46) Horn-Ross PL, Hoggatt KJ, West DW, Krone MR, Stewart SL, Anton H, et al. Recent diet and breast cancer risk: the California Teachers Study (USA). Cancer Causes Control 2002;13:407–15.
(47) Horn-Ross PL, John EM, Lee M, Stewart SL, Koo J, Sakoda LC, et al. Phytoestrogen consumption and breast cancer risk in a multiethnic population: the Bay Area Breast Cancer Study. Am J Epidemiol 2001;154:434–41.