HAL Id: cea-01823368
https://hal-cea.archives-ouvertes.fr/cea-01823368
Submitted on 16 Jul 2019
HAL is a multi-disciplinary open access
archive for the deposit and dissemination of
sci-entific research documents, whether they are
pub-lished or not. The documents may come from
teaching and research institutions in France or
abroad, or from public or private research centers.
L’archive ouverte pluridisciplinaire HAL, est
destinée au dépôt et à la diffusion de documents
scientifiques de niveau recherche, publiés ou non,
émanant des établissements d’enseignement et de
recherche français ou étrangers, des laboratoires
publics ou privés.
R. Coulon, Vladimir Kondrasovs, J. Dumazert, E. Rohée, S. Normand
To cite this version:
R. Coulon, Vladimir Kondrasovs, J. Dumazert, E. Rohée, S. Normand. Nuclear counting filter based on
a Centered Skellam Test and a double Exponential Smoothing. 2015 4th International Conference on
Advancements in Nuclear Instrumentation Measurement Methods and their Applications (ANIMMA),
Apr 2015, Lisbon, Portugal. pp.7465500, �10.1109/ANIMMA.2015.7465500�. �cea-01823368�
Abstract— Online nuclear counting represents a challenge due
to the stochastic nature of radioactivity. The count data have to be filtered in order to provide a precise and accurate estimation of the count rate, this with a response time compatible with the application in view.
An innovative filter is presented in this paper addressing this issue. It is a nonlinear filter based on a Centered Skellam Test (CST) giving a local maximum likelihood estimation of the signal based on a Poisson distribution assumption. This nonlinear approach allows to smooth the counting signal while maintaining a fast response when brutal change activity occur. The filter has been improved by the implementation of a Brown’s double Exponential Smoothing (BES).
The filter has been validated and compared to other state of the art smoothing filters. The CST-BES filter shows a significant improvement compared to all tested smoothing filters.
Index Terms— Nuclear, Measurement, Filter, Signal Processing.
I. INTRODUCTION
UCLEAR counting signal could be considered as a time-dependent random variable 𝑥𝑡 taking its value into a Poisson distribution 𝒫 with a parameter 𝜆𝑡 (see Eq. 1) [1]. The
expected count number 𝜆𝑡 has to be estimated at each time 𝑡.
𝑥𝑡~𝒫(𝜆𝑡) (1)
If the activity is constant ( 𝜆𝑡= 𝛾
0), the maximum
likelihood estimation of 𝜆𝑡 is given by the average of the measured data 𝑥𝑡. In the case of time varying activity the
count rate could be estimated by a Single Moving Average (SMA) or an Exponential Moving Average (EMA). The tradeoff between precision and response time is set by the preset time 𝜃 of the SMA estimate 𝜆̂𝑆𝑀𝐴𝑡 and the forgetting factor 𝛼 of the EMA estimates 𝜆̂𝐸𝑀𝐴𝑡 such as presented in Eq.
2-3.
Authors are with the French Alternative Energies and Atomic Energy Commission (CEA) F-91191 Gif-sur-Yvette, France.
(e-mail: [email protected]) 𝜆̂𝑆𝑀𝐴𝑡 = 1 𝜃∑ 𝑥𝑡 𝑡 𝑡−𝜃 = 𝜆̂𝑆𝑀𝐴𝑡−1 + 1 𝜃(𝑥𝑡− 𝑥𝑡−𝜃) (2) 𝜆̂𝐸𝑀𝐴𝑡 = 𝛼𝑥𝑡+ (1 − 𝛼)𝜆̂𝐸𝑀𝐴𝑡−1 (3)
These linear low-pass filters are commonly implemented into ratemeters [2-6]. Nonlinear filters are also in development since many years to address the issue of nuclear counting smoothing [7-10]. A hypothesis test is performed in order to determine where the activity is changing and then make a decision on the time constant to set into the moving average filter. For this purpose, it has been proven that the Centered Skellam Test (CST) is an efficient filter to detect changes into the Poisson counting [11-12]. By its simplicity, it could easily be implemented into embedded electronics assuming real time processing.
The data are record in a buffer with a size 𝑀. The integration time constant 𝜃𝑡 is set following the result of the test as detailed in Eq. 4-5 where 𝐿 is the vector of results from the test and 𝑄 is the parameter of the filter. The hypothesis test carried on the Poisson statistics assumption and a property associated with the Skellam distribution. Further details are mentioned in [12]. 𝐿 = arg𝑖{| ∑𝑡 𝑥𝑡 𝑡−𝜃𝑡−1 𝜃𝑡−1 − ∑𝑡 𝑥𝑡 𝑡−𝑖 𝑖 | − 𝑄√ ∑𝑡 𝑥𝑡 𝑡−𝜃𝑡−1 (𝜃𝑡−1)2 + ∑𝑡 𝑥𝑡 𝑡−𝑖 𝑖2 > 0} (4) 𝜃𝑡= 𝜃𝑡−1− dim(𝐿) + 1 (5)
At the current time 𝑡, the count rate is estimated as presented in Eq. 6 by an SMA filter where 𝜃𝑡 is the time-dependent integration time. In the absence of detection, the value dim(𝐿) is equal to zero, and then the time constant 𝜃𝑡 is
extended. When a change in 𝜆𝑡 is detected the value of dim(𝐿) provides an indication about the credibility of the detection, and then the time constant 𝜃𝑡 is reduced.
Nuclear Counting Filter Based on a Centered
Skellam Test and a Double Exponential
Smoothing
Romain Coulon, Vladimir Kondrasovs, Jonathan Dumazert, Emmanuel Rohée, and Stephane
Normand
CEA, LIST, Laboratoire Capteurs et Architectures Electroniques, F-91191 Gif-sur-Yvette, France.
𝜃
𝑡−𝜃𝑡
It has been proven in [12] that the CST estimates the counting signal with a better performance compared to SMA or EMA filters at count rate above 1 cps. An improvement is considered in this new work by the adding of recursive smoothing on the CST output estimates. The method is details on next section and the filter will be benchmark with other filters in order to highlight its advantages and limitations.
II. METHOD
Based on the original CST filter presented and pre-validated in [12], some optimizations are now presented in this chapter. Two figures of merits 𝐹𝑂𝑀1 and 𝐹𝑂𝑀2 are used as
performance indicators.
The first one 𝐹𝑂𝑀1(𝜆̂𝑋/𝜆̂𝑌) indicated the behavior of the filter
X in comparison with the filter Y when a brutal change into the
signal intensity occurs. It is minimized when the precision of the measurement 𝑃(𝜆̂𝑋) and the response times to brutal change 𝜏𝑖(𝜆̂𝑋) and 𝜏𝑑(𝜆̂𝑋) are the lowest (see Eq. 8). The
relative standard deviation 𝑃(𝜆̂𝑋) is defined as the ratio
between the observed standard deviation 𝜎(𝜆̂𝑋) and the empirical mean 𝜆̂̅̅̅ of the output signal during a constant 𝑋
activity such as: 𝜆𝑡= 𝛾
0 (see Eq. 7). The response time to an
increase step 𝜏𝑖(𝜆̂𝑋) and to a decrease step 𝜏𝑑(𝜆̂𝑋) are
defined as times required to achieve the final value 𝜆𝑡= 𝛾1 starting from the original count rate value 𝜆𝑡= 𝛾0 (details
on their calculation are mentioned in [12]). The value of 𝛾1 is
set as a function of the Signal to Noise Ratio SNR such as: 𝛾1= 𝛾0+ 𝑆𝑁𝑅 √𝛾0. 𝑃(𝜆̂𝑋) = 𝜎(𝜆̂𝑋) 𝜆̂𝑋 ̅̅̅ (7) 𝐹𝑂𝑀1(𝜆̂𝑋/𝜆̂𝑌) = 𝑃(𝜆̂𝑋) (𝜏𝑖(𝜆̂𝑋) + 𝜏𝑑(𝜆̂𝑋)) 𝑃(𝜆̂𝑌) (𝜏𝑖(𝜆̂𝑌) + 𝜏𝑑(𝜆̂𝑌)) (8)
The second figure of merit 𝐹𝑂𝑀2(𝜆̂𝑋/𝜆̂𝑌) has been built in order to account for the accuracy of the filter output with regards to the trend phenomenon. The accuracy is defined as the relative error of the output estimates compared to the expected value which following a trend such as: 𝜆𝑡= 𝛾0+ 𝐶𝑡 where 𝐶 is the slope of the trend.
𝐴(𝜆̂𝑋) = |𝜆̂𝑋− 𝜆𝑡| 𝜆𝑡 (9) 𝐹𝑂𝑀2(𝜆̂𝑋/𝜆̂𝑌) = 𝑃(𝜆̂𝑋)𝐴(𝜆̂𝑋) 𝑃(𝜆̂𝑌)𝐴(𝜆̂𝑌) (10)
FOM below 1 quantifies the improvement ensured by the filter X.
A. Optimization of the original CST filter
An implementation of the CST filter with an infinite buffer size is considered here, to get rid of any memory limitations. It has been shown in previews works [12] that the parameter 𝑄 of the CST filter found its optimal value between 1 and 2. A more accurate estimation has been calculated and presented into the Fig. 1. A value of 1.6 seems to give optimal performance whatever the activity characteristics are. This value will be considered in the following of the study.
Fig. 1. Estimation of the 𝐹𝑂𝑀2 as a function of the CST parameter 𝑄
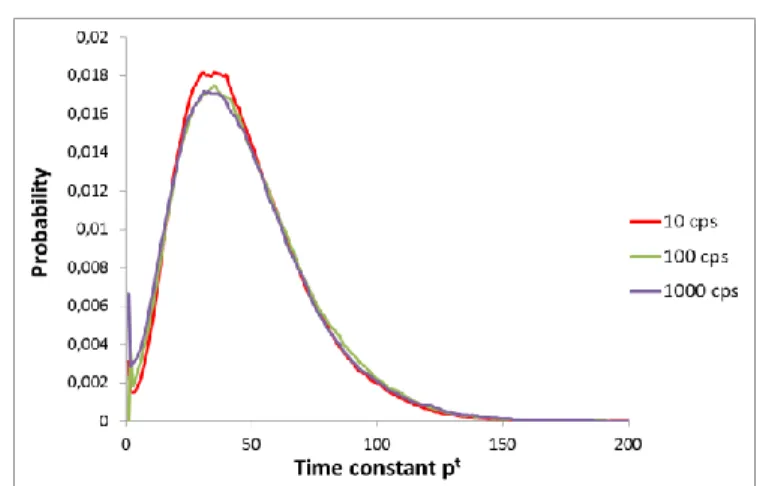
The distribution of the integration time constant 𝜃𝑡 for different activity magnitudes is now studied. The Fig. 2 shows that the time constant is comprised between 1 and 150 with a mean value equal to 47. We can deduce that the buffer size of the system does not need to be higher than 200 to ensure a convenient operation of the filter. A buffer size equal to 200 will therefore be considered in this study.
Fig. 2. Distribution of the value of the time constant 𝜃𝑡 for different activity
B. The exponential smoothing
The output signal provided by CST filtering cannot be described by a determined distribution. The data have then to be processed by implementing a technique for smoothing this indeterminate series containing a potential trend. The Brown’s double Exponential Smoothing (BES) is largely used in economics, and allows forecasting futures values and then anticipating a trend [13-14]. This approach has been chosen since it is a simple and then compatible with real time and embedded requirements of ratemeter. The value of the trend is estimated by the difference between a simple exponential smoothing 𝜆̂𝐸𝑀𝐴𝑡 and a double exponential smoothing 𝜆̂𝐷𝐸𝑀𝐴𝑡 as presented in the regressive formulae Eq. 12-13. The time constant of exponential smoothing 𝛼𝑡 is set with regards to the
value of the CST time constant 𝜃𝑡 as presented in the Eq. 11,
where 𝛽 is the parameter of the exponential smoothing part. Thus, the time constants of the final filter will be linked together within the same meaning.
𝛼𝑡= [1 − exp (− 1
𝛽(𝜃𝑡−1))] (11) 𝜆̂𝐸𝑀𝐴𝑡 = 𝛼𝑡𝜆̂𝐶𝑆𝑇𝑡 + (1 − 𝛼𝑡)𝜆̂𝑡−1𝐶𝑆𝑇 (12)
𝜆̂𝑡𝐷𝐸𝑀𝐴= 𝛼𝑡𝜆̂𝐸𝑀𝐴𝑡 + (1 − 𝛼𝑡)𝜆̂𝑡−1𝐸𝑀𝐴 (13)
The BES estimate at the current time 𝑡 is given by the following formula:
𝜆̂𝑡𝐵𝐸𝑆= 2𝜆̂𝑡𝐸𝑀𝐴− 𝜆̂𝐷𝐸𝑀𝐴𝑡 (14)
This estimate allows a nonbiased smoothing of the signal for constant or soft slope. When a brutal change and a hard trend slope occur, a lag time and then a lack of accuracy steel appear. In order to process in a better way the signal, an alternative estimation will be done when significant changes are detected. A Moving Average Convergence Divergence 𝑀𝐴𝐶𝐷𝑡 indicator is defined as the difference between the
EMA and DEMA estimates. The relative trending indicator 𝜌𝑡 is adapted to our problematics by a specific normalization
as presented in Eq. 15.
𝜌𝑡=𝜆̂𝐸𝑀𝐴𝑡 − 𝜆̂𝐷𝐸𝑀𝐴𝑡
√𝜆̂𝐷𝐸𝑀𝐴𝑡
(15)
The indicator 𝜌𝑡 is used to detect the presence of a trend into
the signal with regards to a threshold value κ. The final estimation 𝜆̂𝑡𝐶𝑆𝑇∗ is calculated as presented in Eq. 15. If 𝜃𝑡 exceeds the threshold κ, the CST output is directly corrected by adding the trending correction. A gain in accuracy and response time is attempted by the lag time reduction. If 𝜃𝑡 is
under the threshold κ, the BES estimate is applied ensuring a gain in precision.
{
𝜆̂𝐶𝑆𝑇∗𝑡 = 𝜆̂𝑡𝐶𝑆𝑇+ 𝜌𝑡√𝜆̂𝐷𝐸𝑀𝐴𝑡 ∀𝜌𝑡≥ κ
𝜆̂𝑡𝐶𝑆𝑇∗= 𝜆̂𝑡𝐸𝑀𝐴+ 𝜌𝑡√𝜆̂𝐷𝐸𝑀𝐴𝑡 ∀𝜌𝑡< κ
(15)
Fig. 4 shows the probability distribution of the 𝜌𝑡 indicator in
the case of constant activity and in the case of a trend contained into the signal. The threshold κ has to be chosen to detect a trend with a maximum of true detections and a minimum of false detections. From the Fig. 4. a value of 0.3 has been chosen as optimal.
Fig. 4. Probability distribution of the 𝜌𝑡 indicator in the case of constant activity and in the case of a trend contained into the signal.
C. Optimization of the β parameter
The parameter 𝛽 used into the exponential smoothers has also to be optimized. The figure of merits 𝐹𝑂𝑀1 and𝐹𝑂𝑀2 are
estimated as a function of the smoother parameter 𝛽 for different level of activities 𝛾0, relative slope 𝐶 and signal to
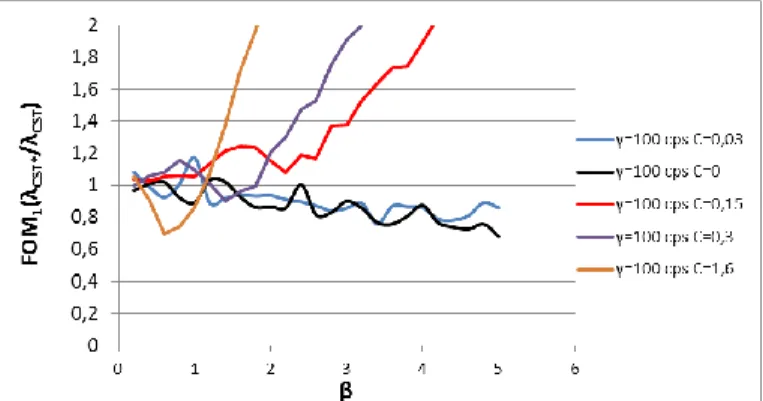
noise 𝑆𝑁𝑅 values. Some of these curves are reported in Fig. 6-9 and a value equal to 1.5 can be considered as an optimal value maintaining a compromise between accuracy and precision.
Fig. 6. Figures of merit obtained as a function of the parameter 𝛽 for a base line count rate 𝛾0= 10 𝑐𝑝𝑠 and for different value of the slope 𝐶.
Fig. 7. Figures of merit obtained as a function of the parameter 𝛽 for a base line count rate 𝛾0= 100 𝑐𝑝𝑠 and for different value of the slope 𝐶.
Fig. 8. Figures of merit obtained as a function of the parameter 𝛽 for a base line count rate 𝛾0= 10 𝑐𝑝𝑠 and for different value of the SNR value.
Fig. 9. Figures of merit obtained as a function of the parameter 𝛽 for a base line count rate 𝛾0= 100 𝑐𝑝𝑠 and for different value of the SNR value.
III. RESULTS
The filter CST* has been defined in the previous chapter and is now compared with some other smoothing filters implemented for nuclear counting. The studied filters are listed below:
● The SMA filter described in Eq. 2 with a time constant 𝜃 = 100.
● The EMA filter described in Eq. 3 with a time constant 𝛼 = 0.7.
● The CST filter described in [12] and I. with a parameter 𝑄 = 1.6.
has been calculated as a function of the baseline signal amplitude 𝛾0. SMA is chosen as the reference filter because of
its usual implementation in ratemeters. Fig. 10 shows the values of 𝐹𝑂𝑀1(𝜆̂𝑋/𝜆̂𝑆𝑀𝐴) for a brutal change in amplitude corresponding to a 𝑆𝑁𝑅 = 10. The CST filters exhibits better performances than SMA and EMA filters as already demonstrated in [12]. The CST* allows an improvement to be made in comparison to the original version of the CST filter when the activity falls bellow 10 cps. This gain at low count rate is also observed at lower SNR as seen in Fig.11 where the CST* maintains a lower FOM while CST has poorer performances than the EMA in this case.
Fig. 10. Figures of merit obtained as a function of the baseline count rate for a brutal jump corresponding to a SNR equal to 10.
Fig. 11. Figures of merit obtained as a function of the baseline count rate for a brutal jump corresponding to a SNR equal to 5.
Fig. 12 shows the values of 𝐹𝑂𝑀2(𝜆̂𝑋/𝜆̂𝑆𝑀𝐴) for a signal containing a trend with a slope C=0.2 and 0.3. As already seen with 𝐹𝑂𝑀1, the performance below 10 cps are improved without any discrepancy observed at higher count rate.
Fig. 12. Figures of merit obtained as a function of the baseline count rate for a trend with a slope C equal to 0.2.
Fig. 13. Figures of merit obtained as a function of the baseline count rate for a trend with a slope C equal to 0.3.
The CST* version allows to process the counting signal on a larger range of count rate levels. The superiority of nonlinear filters as the CST* compared to traditional linear filtering is confirmed by those results.
As an illustration, temporal profiles are presented in the Fig. 14-16 in the case of very low count rates. In Fig. 13, the CST* exhibits a faster response to the increase step while smoothing the signal with a better precision. In Fig. 14, the trend is followed by the CST* without any lag times giving performance closed to CST ones. Finally a constant count rate is presented in the Fig. 15. The CST* provides a more precise estimate than the CST and exhibits a behavior closer to the highly destructive SMA low-pass filter.
Fig. 14. Example of temporal profiles obtained by SMA, EMA, CST and CST* for a brutal change set of with an SNR equal to 5 and a baseline count rate of 0.1
Fig. 15. Example of temporal profiles obtained by SMA, EMA, CST and CST* for a trend set of with an slope equal to 0.15 and a baseline count rate of 0.1
Fig. 16. Example of temporal profiles obtained by SMA, EMA, CST and CST* for a constant count rate of 0.1
IV. DISCUSSION
The nonlinear CST* filter has recently been tested for spectroscopy applications. It is applied to each energy channel
j of a temporal spectrum 𝜑𝑗𝑡 as seen in Eq. 16 where 𝜓𝑗𝑡 is the
output smoothed spectrum.
∀𝑗 ∈ [1, 𝑛𝑗] , 𝜓𝑗𝑡= 𝐶𝑆𝑇∗(𝜑𝑗𝑡) (16)
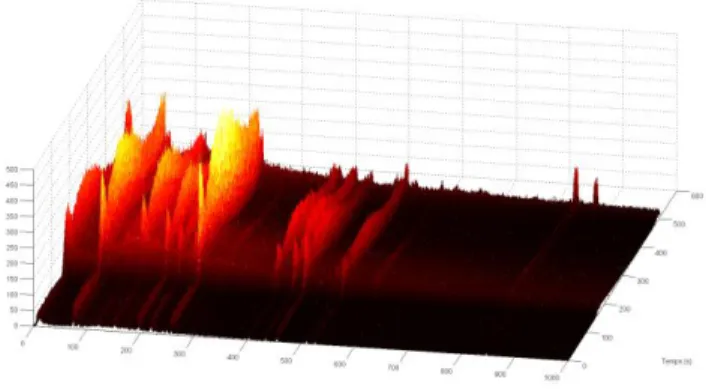
Fig. 16 shows a row temporal gamma spectrum obtained during a clad failure experiment conducted at the OSIRIS testing reactor where an elementary integration time equal to 5 s is considered [15-16]. The large fluctuations induced difficulties for the fitting of the Gaussian peak required to quantify isotope activities. Fig. 15 shows the same temporal gamma spectrum after being processed by the CST* filter. The time preserving smoothing ensured by the CST* filter makes the analysis of the temporal spectrum easier.
Fig. 14. Row temporal spectrum measured at the OSIRIS reactor during an experimental clad failure.
Fig. 15. Filtered temporal spectrum measured at the OSIRIS reactor during an experimental clad failure.
The filter will also be implemented as a critical building block into current R&D projects such as an innovative compensation system addressing neutron detection [17-18] and into a system allowing moving sources to be detected by a sensor network [19-20]. The stability of the CST* filter with regards to drifts in the Poisson assumption (pile-up, correlation) will be studied in future works.
V. CONCLUSION
The filter has been optimized to process the counting signal using a filtering part based on a Skellam centered hypothesis test with a law assumption and a smoothing part using a Brown’s double exponential recursive smoothing. The version of the filter including the exponential smoothing part has improved the performance (response time vs. precision tradeoff) at very low count rate (below 1 cps).
The figures of merits obtained by the implementation of the filter are dramatically better than conventional single and exponential moving average smoothers over a very large range of count rates.
This approach provides an efficient smoother ensuring an accurate and precise estimation of the count rate whatever the trend of the signal or any brutal change occurring. It is well suited for embedded and real time requirements associated with nuclear instruments.
REFERENCES
[1] G.F. Knoll, “Radiation Detection Measurement”, 4th ed.,
John Wiley & Sons, Hoboken, pp. 65-105, 2010.
[2] C.H. Vincent, “The relationship between the speed of the response of a linear ratemeter and the amplitude of its random fluctuation.” Nuclear Instruments and Methods, 23:193-196, 1963.
[3] I.D. Vankov, G.S. Ganev, M. Ivanov and M. Müller, “Self adapting ratemeter”. Nuclear Instruments and Methods, 214:395-400, 1983.
[4] V. Arandjelovic, A. Koturovic and R. Vukanovic, “A generalization of the preset count moving average algorithm for digital rate meters” Nuclear Instruments and Methods in
Physics Research A, 481:769-772, 2002.
[5] Z. Savic, “Some software algorithms for microprocessor ratemeters”. Nuclear Instruments and Methods in Physics
Research A, 301:517-522 , 1991.
[6] H.-J. Jeong, et. al, “Statistical approaches to forecast gamma dose rates by using measurements from the atmosphere,” Radiation Protection Dosimetry, pp. 1–9, 2008. [7] K. Coop, “Monte Carlo simulation of the sequential probability ratio test for radiation monitoring”. IEEE
Transaction on Nuclear Science, 32:934-938, 1985.
[8] P.E. Fehlau, “Comparing a recursive digital filter with the moving-average and sequential probability ratio detection methods for SNM portal monitors”. IEEE Transaction on
Nuclear Science, 40:420-424, 1993.
[9] A. Collura, et. al, “Variability analysis in low count rate sources,” The Astrophysical Journal, vol. 315, pp. 340–348, 1987.
[10] G. Apostolopoulos, “On-line statistical processing of radiation detector pulse trains with time-varying count rates,”
Nuclear Instruments and Methods in Physics Research A,
vol. 595, pp. 464–473, 2008.
[11] V. Kondrasovs, R. Coulon and S. Normand, “An Adaptive Smoother for Counting Measurements,” Proceeding
of ANIMMA, paper 1018, 2013.
[12] R. Coulon, et. al., “Nonlinear Filter Implementing a Centered Skellam Test for On-line Nuclear Counting Measurements”, Radiation Measurement, Submitted, 2015. [13] R.G. Brown, “Smoothing, Forecasting and Prediction of Discrete Time Series”, Prentice-Hall: New Jersey, 1962.
[14] E.S. Gardner, “Exponential smoothing: The state of the art – Part II.”, International Journal of Forecasting, vol. 22:637-666, 2006.
[15] R. Coulon et. al., “Delayed Gamma Power
Measurement for Sodium-cooled Fast Reactor”, Nuclear
Engineering and Design, vol. 241 (339-348), 2011.
[16] E. Rohée, R. Coulon, F. Carrel, S. Normand, C. Jammes, T. Dautremer, E. Barat and T. Montagu, “Qualitative and quantitative validation of the SINBAD code on complex HPGe gamma-ray spectra”, Proceeding of ANIMMA, paper 105, 2015.
[17] G.H.V. Bertrand, J. Dumazert, F. Sguerra, R. Coulon, G. Corre and “Understanding behavior of different metals in loaded scintillators: discrepancy between gadolinium and bismuth”, Journal of Chemical Materials C, submitted 2015. [18] J. Dumazert, R. Coulon, G.H.V. Bertrand, M. Hamel, F. Sguerra, C. Dehé-Pittance, S. Normand and L. Méchin. “Gadolinium-loaded plastic scintillators for thermal neutron detection and counting using photon response compensation.”,
Proceeding of ANIMMA, paper 118, 2015.
[19] R. Coulon, V. Kondrasovs, K. Boudergui, and S. Normand, “Moving Sources Detection Algorithm for Radiation Portal Monitors Used in a Linear Network”, IEEE
Transaction on Nuclear Science, 61:2189-2194, 2014.
[20] J. Dumazert, R. Coulon, V. Kondrasovs, K. Boudergui, G. Sannié, J. Gameiro, S. Noramnd, and L. Méchin. “Hypothesis tests for the detection of constant speed radiation moving sources”, Proceeding of ANIMMA, paper 120, 2015.