USE OF MATHEMATICAL MODELLING TO STUDY THE BEHAVIOR OF A HORIZONTAL
ANODE BAKING FURNACE
Yasar Kocaefe1, Noura Oumarou1, Mounir Baiteche1, Duygu Kocaefe1
Brigitte Morais2, Marc Gagnon2
1University of Quebec at Chicoutimi, Dept. of Applied Sciences, 555, boul. De l’Université, Chicoutimi, Quebec, Canada G7H 2B1 2Aluminerie Alouette Inc., 400, Chemin de la Pointe-Noire, C.P. 1650, Sept-Îles, Quebec, Canada, G4R 5M9
Keywords: Mathematical modelling, horizontal anode baking furnace, anode baking, carbon anodes, design model, process model Abstract
Large numbers of carbon anodes are used in aluminum industry. The manufacture of carbon anodes involves the preparation of a paste (a mixture of coke, pitch, and recycled material), the production of green anodes via mixing and compaction of this paste, followed by cooling and baking of the green anodes. Anode baking is carried out in large furnaces. Any modification to design or operation would require a careful study of its impact on anode quality. In recent years, mathematical models have been used effectively to complement the experimental work in order to improve furnace operation and design. A design model and a process model are being developed to study the behavior of a horizontal anode baking furnace and to determine the necessary improvements. In this article, these models and their use for the study of a furnace will be described, and the results of the numerical simulations will be presented.
Introduction
Aluminum is a lightweight metal with many desirable properties: high resistance to corrosion, excellent conductor of heat and electricity, high workability (ductility), and easy recyclability. Aluminum production requires the use of carbon anodes which supply the carbon required for the reduction of alumina by electrolysis in the Hall-Héroult process. Carbon anodes are an important part of the primary aluminum production, and their quality is important. High quality anodes (low electrical resistivity, low reactivity, and low impurity level, etc.) help maintain stable cell operation, reduce energy consumption and environmental emissions, yield better quality metal, and consequently lower the cost.
Green anodes are manufactured by mixing the granular material (coke, crushed butts, recycled anodes) with a binder (pitch) and then by forming the resulting paste in a vibrocompactor or a press. The green anodes are cooled and stored until they are baked in large furnaces. The most costly step of the anode manufacturing process is the baking step. The anode quality depends on the raw material properties as well as all the process parameters. The baking is the last determining step and affects the anode quality significantly.
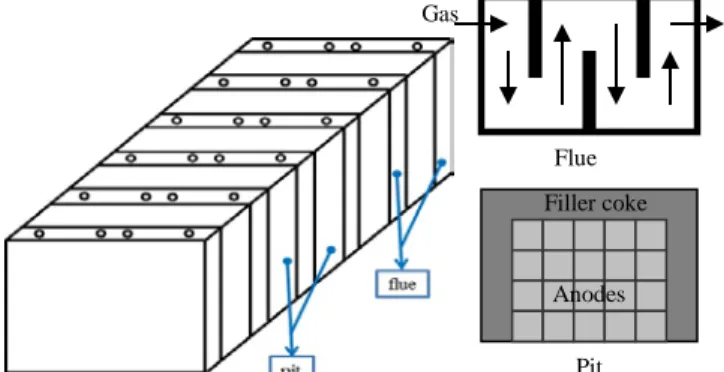
In general, two types of furnaces are used: horizontal and vertical. These furnaces are arranged in sections (usually 34-56) in two rows, each one accommodating two to three fire cycles at a time. Each section consists of pits that contain anodes surrounded by packing coke and the adjacent channels through which the gas is circulated. These two parts are separated by a brick (refractory) wall. The anodes are heated and cooled by the circulating gas. In the horizontal baking furnaces, the pits are filled with anodes in multiple rows and columns depending on the size of the anodes and the pit dimensions. The remaining volume as well as the tops
of the anodes is filled with coke to support the anode, to provide a medium for heat transfer, and to minimize the infiltration of air to the anode surfaces. The pits are surrounded by channels for gas flow, called flue (see Figure 1). In the flue, baffles and tie bricks are used to eliminate dead zones and to have a reasonable gas velocity in order to improve the heat transfer to the refractory surfaces and to provide a uniform heat flow distribution for the baking of anodes.
Figure 1 Schematic views of a section of a horizontal anode baking furnace, a flue, and a pit.
Anodes are heated at a certain rate from room temperature to about 1100°C and then cooled slowly. The entire cycle could take from two to three weeks. Each cycle consists of 13-17 sections (see Figure 2). The furnace acts as a counter-current heat exchanger. Since anodes cannot be moved, the ramps on the gas side are shifted after each fire cycle (approximately 20-30 hours). In Figure 2, there are 3 preheating, 3 heating, and 6 cooling sections. The anodes in section 13 are ready to be removed. The section preceding section 1 contains anodes that are ready to be baked.
Figure 2. A schematic view of a fire cycle.
Energy required for heating comes from essentially three sources: fuel (oil or natural gas), volatiles coming from the anodes (tar, methane, and hydrogen that are produced when the pitch is heated), and the combustion of packing coke (which is undesirable, but unavoidable). The amount of energy released from the combustion of volatiles is usually enough for the baking of anodes; however, more than twice that amount is used to meet
Pit Anodes Filler coke
Flue Gas
the large losses from the furnace. Detailed information on design and construction of these furnaces can be found in reference [1]. Plant trials on such furnaces are quite costly and may cause the loss of production. Mathematical modeling is a highly useful tool to carry out such trials (testing of different designs or changes in operating conditions) without any risk to the operation of a furnace and to reduce the cost of experimental work significantly. It is important to note that any modification to design or operation has to be tested in the plant, and thus the mathematical modeling complements the experimental work. In general, it is difficult to make detailed measurements around the furnace due to limited accessibility or costs involved; the models fill this void by giving an insight into such details as the distribution of temperature and flow. A comprehensive review of various modelling approaches is given in reference [2].
The active work on mathematical modelling of the anode baking furnaces started at the beginning of the 1980’s with relatively simple approaches [3-5]. With the developments in numerical modelling and computing capacity (memory and speed), more sophisticated models have appeared [6-9]. In mid-1990’s, a full 3D transient model was reported [10]. Later on, many models of varying complexity, but similar in nature to these early works have been published [11-14]. Mathematical modelling has become a key tool in the improvement furnace operation and design.
Mathematical Models
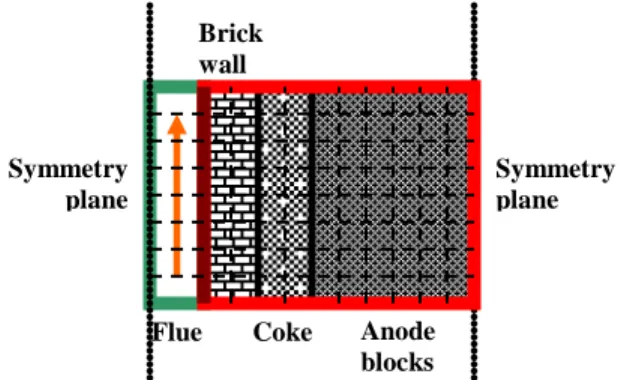
The operation of anode baking furnaces is transient in nature and has to be taken into account in the model. Also, using the assumption of symmetry, only half of a pit and half of a flue can be modelled. Pit and flue have completely different characteristics: the time constant of the pit is much greater than that of the gas (i.e., gas responds to changes rapidly whereas the pit side takes a long time to respond to the variation in boundary conditions); the heat transfer in the pit can be solved as a conduction problem, but reacting flow (combusting medium) combined with heat transfer has to be solved in the flue; properties are considerably different for gas and solids. Thus, the global model of a baking furnace is divided into two sub-models: gas and pit (brick wall, packing coke, and anodes). These sub-models are developed separately and then coupled through an interface at the brick surface on the flue side (see Figure 3). This modular approach makes it easier to develop and modify each part. Also, if needed, each sub-model could be used exclusively for testing options in one part of the furnace (such as the flow distribution in the flue for a given geometry).
Figure 3. Description of the two sub-models and their coupling.
The phenomena that are occurring on the flue side: - gas flow including pressure drop in the flue, - conductive, convective, and radiative heat transfer, - combustion of fuel and volatiles,
- suction of volatiles from the pit through the slits, - air infiltration from various openings,
- heat losses from the top (to the air) and the bottom (to the foundation;
and, on the pit side:
- conductive heat transfer (coke is a porous media, effective thermal conductivity is used),
- devolatilization from the anodes (hydrogen, methane, and tar),
- combustion of coke
- air infiltration through packing coke (porous media) - heat losses from the top (to the air) and the bottom (to
the foundation.
There are also geometric parameters that need to be considered: - Flue side: dimensions of entrance, exit, baffles, tie
bricks; positions of tie bricks and slits; dimensions of flue itself.
- Pit side: dimensions of anodes and brick wall; space for packing coke; thickness of packing coke above anodes; dimensions of pit itself.
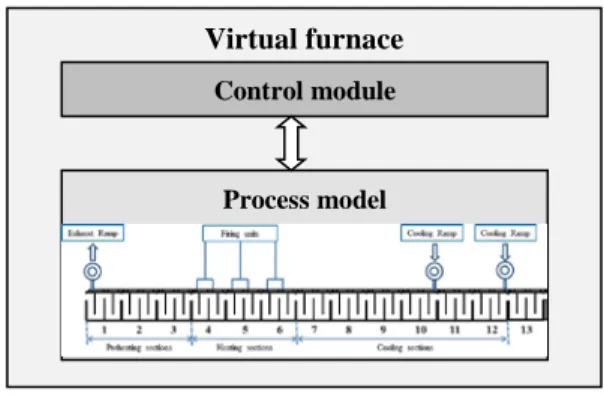
Even though highly developed computing equipment and commercial numerical simulation codes are available today, it is still difficult and time consuming to solve all of the above phenomena including all operational and geometric parameters in detail. For design changes such as the modification of the flue geometry, multi-dimensional modelling (mainly 3D, but 2D may suffice for some applications) is necessary even if some simplifications are made. These types of models give detailed information (for example, temperature distribution everywhere as a function of time), but usually take many hours of computation time. To simulate the operation, and especially if the furnace control is to be included in the model, simpler approaches are used by eliminating such details as 3D velocity distribution or by neglecting gradients in certain directions and reducing the number of dimensions in the solution of equations. A process model with a control module acts as a virtual furnace (see Figure 4).
Figure 4. Structure of a virtual furnace.
The design and process models are described in the following section. In both models, the temperature distribution on the brick wall (at the interface) calculated by the pit sub-model is used as the boundary condition for the flue sub-model, and the heat flux distribution calculated on the brick wall (at the interface) by the flue model is used as the boundary condition for the pit
sub-Virtual furnace Process model Control module Flue sub-model Gas Pit Sub-model Anodes Packing coke Interface
(Brick wall surface on flue side)
B r i c k Interface temperature
model (see Figure 3). Using the symmetry, half of the pit and half of the flue are considered in both models. A measurement campaign is being planned to validate the models.
Design Model
In the flue, the Navier-Stokes, continuity, chemical species (for gas components), and energy equations are solved with k-ε turbulence model, all in 3D and transient, considering all the details of the geometry. The contribution by radiative heat transfer is added to the energy equation which accounts for the radiative exchange between all components of the flue (gas and wall). In the pit, the transient conduction heat transfer equation is solved in 3D including the detailed geometry as well. The volatile evolution from the anodes is calculated using the kinetic equations. The volatiles are then transferred to the flue where their combustion is determined using a kinetic expression for their combustion. The fuel combustion in the flue is also calculated based on similar kinetic expressions. The combustion of packing coke in the pit is handled semi-empirically and is based on the temperature distribution in the coke.
The air infiltration is calculated based on the difference between the pressure inside the flue (near the wall where the opening is) and the atmospheric pressure in a way similar to orifice flow. Heat losses based on the overall heat transfer between the boundaries and external system (foundation or air) are included as boundary conditions.
Because of the details included in the design model, it is not possible to simulate the entire cycle (memory limitation due to large grid); thus, only one section is simulated at a time. Then the outlet conditions from that section is used as the inlet conditions for the simulation of the following section. This is continued until the entire cycle is covered. For a specific study, it is also possible to simulate only one section or a few sections relevant to the subject in question.
The design model gives a detailed image of all phenomena. The model gives: the temperature, pressure, velocity, and species concentration distributions in 3D in the flue; the temperature distributions in the brick wall, packing coke, and anodes. Volatile evolution as well as volatile and fuel combustion patterns are also determined. The partial differential equations are solved using the code ANSYS 12.
Process Model
In the flue, the flow has to be simplified. In most of the previous works, the flow was not considered at all; at best, it was taken as a 1D flow in the horizontal direction. The actual flow, however, is mainly vertical due to the presence of baffles as indicated in Figure 5; and, in the current work, it was taken as such. The advantage is that the temperature distribution in the flue (gas and brick wall) is represented in 2D (variation in the vertical and horizontal direction). This gives a more realistic representation of the phenomena taking place in the flue. Powerful computing and numerical simulation tools available today allow the inclusion of more complexity in process modelling.
Figure 5. Flow representation in the flue of the process model
The pressure drop is calculated assuming flow through a channel with a hydraulic radius. The air infiltration is solved in a manner similar to the one in the design model since the pressures are available at positions where the infiltration occurs. Each flue consists of four parts (the space between baffles), and each part is divided vertically into many cells. On each cell, overall mass, chemical species, and energy balances are carried out assuming pseudo steady-state condition. This is updated at each time step which accounts for the transient nature of the process. The devolatilization in the pit, the transfer of volatiles from pit to flue, and the combustion of volatiles, fuel in the flue and packing coke in the pit are treated in a similar manner to the design model. In the pit sub-model, the 2D transient conduction heat transfer is solved on vertical plane using a mesh with a large number of cells as shown in Figure 6 (the mesh is finer than the one seen in this figure, but it was reduced for clarity). During simulation, the calculations on the flue side are carried out for the entire cycle (i.e., including all sections) using the brick wall temperatures as the boundary condition. Then, using the heat fluxes as the boundary conditions, pit side equations are solved on a number of selected vertical planes. This could be four planes per section (corresponding to the four parts of the flue sub-model) or only one plane per section (based on the average of four parts at any height in the flue).
The equations are solved using a program based on FORTRAN developed in our lab. Later on, a control module will be incorporated into the model, which will become a virtual furnace.
Figure 6. Details of the mesh for the models (red: pit sub-model, green: flue sub-sub-model, brown: interface).
Results and Discussion Some results of the simulations are presented below. Design Model
The flue geometry has a significant impact on the flow field and temperature distribution. The baffles create low-velocity zones behind them due to the recirculation of flow. Therefore, tie bricks are used to distribute the flow as much as possible to break down these zones and to increase the velocity. A design model is an ideal tool for this type of study.
Figure 7 shows the flow pattern in a flue for three different tie brick arrangements: ones series, two series, and three series between the baffles and walls. Blue-colored zones indicate the low velocity zones. Use of double (Figure 7b) or triple series (Figure 7c) of bricks seem to break down the large blue zones of single series of bricks (Figure 7a); however, it is not clear whether double or triple series is better.
Anode blocks Coke Brick wall Flue Symmetry plane Symmetry plane
Figure 7: The flow pattern on the symmetry plane in a flue (the middle of the flue) for geometries using (a) one series of bricks,
(b) two series of bricks, and (c) three series of bricks (the geometry is taken from [15]).
The velocity distributions are further analyzed and the results in Figure 8 are obtained. The volume fraction as a function of the average velocity corresponding to that volume fraction is plotted. It can be seen that the geometries one (Figure 7a) and two (Figure 7b) give better results because of a larger volume fraction of similar velocities. Comparing Figures 7a and 7b, blue zones are smaller and dispersed for the second geometry (Figure 7b). The best geometric configuration is the second one among the three compared.
The third geometry shows that the increase in the number of tie bricks does not necessarily improve the flow pattern; the positions of the tie bricks are as important. Normally, such geometry would not be used in industry due to increased cost and the success with two series of bricks in general. It was included to demonstrate the point above.
The pressure drop across the flue is also important for the blower power requirement to circulate the gas. The pressure drop values corresponding to the geometries one, two, and three are 18.5,
18.7, and 23.5 Pa, respectively. The use of two series of tie bricks increases the pressure drop slightly; however, the use of three series causes a significant jump (about 27%).
The above calculations were carried out based on the steady-state and isothermal flow version of the design model. Even though the heat transfer is not included, this approach gives a good indication of the effectiveness of the geometry chosen.
Figure 8: The distribution of velocities for the three geometries given in Figure 7, the volume fraction vs. velocity corresponding
to that volume fraction.
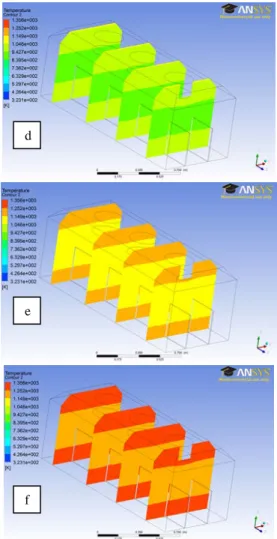
A study was carried out for the heating of an industrial anode in conditions similar to those found in a pit, i.e., heating from both sides corresponding to heat transfer from two flues adjacent to the pit. Results are shown in Figure 9. Variable properties were used. a b c a b c
Figure 9: The anode surface temperatures after heating for (a) 75h, (b) 100h, and (c) 120h; the temperature profiles on four vertical planes inside the anodes for cases corresponding to above
heating periods of (d) 75h, (e) 100h, and (f) 120h. In Figures 9a, 9b, and 9c, the anode surface temperatures are shown after a heating period of 75h, 100h, and 120h, respectively. Figures 9d, 9e, and 9f give the inside profiles for the corresponding cases, i.e., after heating 75h, 100h, and 120h, respectively. After 75 hours of heating there is a gradient of 200-250°C between the surface and center temperatures. This reduces to about 100°C after 100h and less than 100°C after 120h of heating. The temperature gradients inside the anodes could cause cracks due to thermal and mechanical stresses. Using this model, desired anode heating rates could be adjusted and corresponding temperature gradients could be verified.
Process Model
Various simulations were carried out with the process model. Some results are presented in this section showing the impact of using variable properties vs. constant properties. Figure 10 shows the temperature history at the center of the pit (in the middle of the anode blocks). Some differences are seen at the beginning (preheating) and end (cooling) of the baking cycle.
Figure 11 shows the temperature profiles along the centerline of the pit as a function of time. The impact of the variable vs. constant properties is demonstrated. As indicated by Figure 10,
significant differences are seen at earlier times; however, they reduce to negligible levels during heating period. This happens due to non-linearity of the properties as a function of temperature. Figure 12 presents the average anode temperatures along the furnace after 20 hours of a fire cycle. The differences seem less pronounced; however, the local gradients are important. The variables properties are used in the model.
Figure 10: Impact of the variable properties on the temperature history at the center of the anode block (shown by red dot).
Figure 11: Impact of the variable properties on the temperature profile along the central line of the pit (shown by red line).
Figure 12: Impact of the variable properties on the average anode temperatures for a given gas temperature profile. d
e
Conclusions
An overall view of the horizontal anode baking furnace modeling is presented. Two models (design and process) are described and discussed. Each model serves a different purpose. Design model gives a detailed image of the furnace, and major modifications to design need to be simulated using this type of model. Changes in operation and control are better simulated using the process model which gives fewer details, but requires much less computation time. Some examples for the application of both models are also presented and discussed.
Acknowledgements
The technical and financial support of Aluminerie Alouette Inc. as well as the financial support of the National Science and Engineering Research Council of Canada (NSERC), Développement économique Sept-Îles, the University of Québec at Chicoutimi (UQAC), and the Foundation of the University of Québec at Chicoutimi (FUQAC) are greatly appreciated.
References
1. Keller, F. and Sulger, P.O., “Anode Baking”, R&D Carbon, 2nd Edition, Sierre, Switzerland, 2008.
2. Charette, A., Kocaefe, Y, Kocaefe, D., “Le carbone dans l’industrie d’aluminium”, La Presses de l’aluminium (PRAL), Chicoutimi, Quebec, Canada, 2012.
3. Furman A., Martirena, H., “A Mathematical Model Simulating an Anode Baking Furnace”, Light Metals (AIME), 1980, 545-552.
4. Thibault, M.A., Bui, R.T., Charette, A., Dernedde, E., “Simulating the dynamics of the anode baking furnace”, Light Metal, 1985, 1141-1151.
5. Bui R.T., Charette A. and Bourgeois T., “Performance analysis of the ring furnace used for baking industrial carbon electrodes”, The Canadian Journal of Chemical Engineering, 1987, 65, 96-101
6. Bourgeois T., Bui R.T., Charette A., Sadler B.A. and Thomsett A.D., “Computer Simulation of a vertical ring furnace”, Light Metals, 1990, 547-552.
7. Jacobsen M., Melaaen M. Chr., “Heat and Mass Transfer in Anode Materials During Baking”, Light Metals, 1995, 681-690.
8. Ouellet R., Jiao Q., Chin E., Celik C., Lancaster D., Wilburn D., “Anode baking furnace modeling for process optimization”, Light Metals, 1995, 653-662.
9. Bui, R.T., Peter S., Charette A., Tomsett A.D., Potocnik V., “Modelling of heat transfer and gas flow in the vertical flue anode baking furnace”, Light Metals, 1995, 663-671. 10. Kocaefe Y., Dernedde E., Kocaefe D., Ouellet R., Jiao Q.,
Crowell W.F., “A 3D mathematical model for the horizontal anode baking furnaces”, Light Metals,1996, 529-534. 11. Zhang L., Zheng C., Xu M., “Simulating the heat transfer
process of horizontal anode baking furnace”, Dev. Chem. Eng. Mineral Process., 2004, 12(3/4), 427-440.
12. Severo D. S., Gusberti V., Pinto E. C. V., “Advanced 3D modelling for anode baking furnaces”, Light Metals, 2005, 697-702.
13. Keller F., Mannweiler, U., Severo D. S., “Computational Modeling in Anode Baking”, R&D Carbon Ltd., Sierre, Switzerland, August 2006, 1-12.
14. Severo D. S., Gusberti V., Sulger P., Keller F., Meier M.W., “Recent developments in anode baking furnace design”, Light Metals, 2011, 853-858.
15. Chen, E.S, “Thermomecanical improvement of a flue wall in anode baking furnace”, Unitecr’95, vol. 3, 1995, pp. 432-433.