A DYNAMIC PROCESS MODEL FOR PREDICTING THE PERFORMANCE OF HORIZONTAL ANODE BAKING FURNACES
Noura Oumarou
1, Yasar Kocaefe
1, Duygu Kocaefe
1Brigitte Morais
2Jacques Lafrance
21
University of Québec at Chicoutimi, Dept. of Applied Sciences, 555, boul. de l’Université, Chicoutimi, Québec, Canada G7H 2B1
2
Aluminerie Alouette Inc., 400, Chemin de la Pointe-Noire, C.P. 1650, Sept-Îles, Québec, Canada, G4R 5M9
Keywords: Horizontal anode baking furnace, carbon anodes, process model, predicting furnace performance Abstract
Anode manufacturing is an important step during the production of primary aluminum, and baking is the costliest stage of the anode manufacturing process. The industrial challenge resides in obtaining a good anode quality while keeping the energy consumption, environmental emissions, and cost to minimum.
A dynamic process model has been developed for horizontal anode baking furnaces. It covers all important phenomena such as fuel combustion, generation and combustion of volatiles (tar, methane, and hydrogen), air infiltration, and heat losses to the atmosphere and the foundation. The model was built using two coupled sub-models of the flue and the pit and was validated using the plant data. It simulates the dynamic behavior of the furnace and gives a prediction of its operation and performance.
In this article, the modelling approach will be described, and the results of a number of case studies will be presented.
Introduction
The Hall-Héroult process is the main technology used in industry for the primary aluminum production and uses carbon anodes for the reduction of alumina to aluminum. During the anode manufacturing, after the mixing and compacting operations, the green anodes are cooled and stored until they are baked in large furnaces (horizontal or vertical). The green anode is typically composed of a mixture of 85% dry aggregate (about 65% calcined petroleum coke and 20% recycled butts and anodes) and 15%
liquid pitch [1]. The green anode quality depends on the properties of raw materials and the process parameters during its production. The anode baking stage is the most costly step of the anode manufacturing process and affects the final anode quality significantly. Also, attention must be paid during the anode baking process to maintain or improve the anode quality while minimizing energy consumption.
The green anodes are baked in immense furnaces, called also ring furnaces. There are generally two distinctly different baking furnace designs that are found in the aluminum industry: the horizontal furnace (open top) and the vertical furnace (closed top).
These furnaces act as high temperature heat exchangers involving indirect heating by the combustion of gas and volatile matter. One furnace can include 34 (two fire cycles) to 70 (four fire cycles) sections arranged in two parallel rows connected at each end by crossover. One section contains four to eight parallel pits, each one enclosed in between two flues. After placing in the pits, the green anode blocks are surrounded by packing coke to protect them against oxidation, to support them mechanically, and to provide heat transfer from the flue wall to the anodes block. After each fire cycle, the ramps of burners along with exhaust and cooling manifolds are shifted to the following section in the flue gas flow direction. This operation is called fire permutation.
During the baking process, the anode temperature rises as the burner ramps approach (preheating) and reaches its highest value
(1000 to 1200°C) when the burner ramps are in that section (heating). The fuel consumption depends on the green anode properties, furnace design, anode baking procedure (maximum temperature, baking cycle time, etc.), and furnace operating conditions. The anode baking furnace must to be optimized to be able to obtain the best possible anodes properties (required for the reduction of alumina in electrolysis) and to minimize the energy consumption.
The mathematical modeling became an important tool for the study of the behavior of anode baking furnaces and for optimizing different parameters or testing design changes. In general, it is difficult to make detailed measurements around the furnace due to limited accessibility, high cost, and duration involved. This limitation could be alleviated by mathematical modeling which provides information on furnace performance, including the distribution of solid and gas temperatures during baking. A comprehensive review of various modelling approaches is given in reference [2].
A detailed investigation of anode baking process began in 1980s first with a mathematical model proposed by Furman [3] and second with an American patent [4]. Since then, the research in this field is constantly growing. Mathematical models with various approaches (simple or complex) were reported. Some models provide only the temperature history during baking by only solving the transient heat conduction equation for the solid parts (anodes block, packing coke, and refractory brick) [5-8]. In some models, the baking process is modelled in more detail, including the flue gas flow and the heat conduction through the solids. Some authors considered the anode baking furnace as a counter-flow heat exchanger where the solids were treated in a way as if they moved in the opposite direction of the gas flow [9- 21]. In these models, the mass and energy balance equations were solved in one direction along the furnace length and the heat conduction through the solids (anodes bloc, packing coke, and refractory wall) in one or two directions. They became a useful tool in understanding and improving furnace operation.
The developments in numerical modelling and computer capacity
(memory and speed) became increasingly significant. As a
consequence, a full 3D transient model was reported in mid-
1990’s [22]. The progress in mathematical modelling continued to
grow, and many models of varying complexity, but similar in
nature to these early works have been reported [23-28]. These
models (in 2D or 3D) included most of the numerous phenomena
taking place in the anode baking furnace. Models of greater
complexity are useful for changing or improving the furnace
design; however, due to high memory and computation time
requirement, the evaluation of the overall furnace operation is
difficult. The process models use a number of simplifications, but
give a good representation of the baking process in the furnace
including all sections of a fire cycle. Thus, they can be used to
predict the furnace behavior during operation [21].
A dynamic process model was developed to study the behavior of horizontal anode baking furnaces in order to determine the impact of various operational parameters and consequently to improve the baking process. In most of process models reported in the literature, the flue gas flow was considered as horizontal along the furnace length. The main difference was the treatment of solids.
The heat transfer trough the solids was solved either in the vertical direction [29] or on a vertical [16, 18] or a horizontal plane [21].
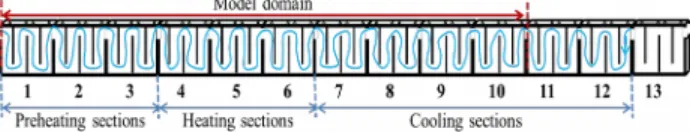
In the actual horizontal baking furnace, due to the presence of baffles, the flow in the flue is not horizontal (see Figure 1). In this work, to have a more realistic representation of the flow in the flue, the gas flow is considered vertical as shown in Figure 1. The model is described in the following section.
Figure 1: Schematic view of a fire cycle in a horizontal anode baking furnace
Mathematical Model
Mathematical modelling has become an important tool for the understanding, testing, and optimization of various parameters of the anode baking process in a horizontal furnace. The dynamic process model was built in two steps for flexibility reasons. First the pit sub-model and the flue sub-model were developed separately and then the two sub-models were coupled through an interface at the refractory surface on the flue side.
The baffles divide the flue into four parts. In each part, the flow is considered vertical (in alternate directions) as shown in Figure 2a.
The heat transfer in solids is solved on vertical planes perpendicular to the gas flow direction as shown in Figure 2b (P1 to P4) because the heat transfer in solids in the direction parallel to the gas flow is much less than in the other directions. Four planes corresponding to four parts are considered in each section (see Figure 2b). The advantage of the flow representation in Figure 2a is that the temperature distribution in the flue gas could be obtained in two directions (variation in the vertical and horizontal directions along the furnace). This also leads to two- dimensional temperature distribution on the refractory wall (on the flue side). Therefore, since the heat transfer equation is solved on a vertical plane across the solids using the vertical temperature distribution on the flue wall, a more realistic temperature distribution is obtained in the solids.
Figure 2: Schematic representation of the model For the flue sub-model, each of the four parts in a section is divided into many cells in the vertical direction. On each cell, overall mass, chemical species, and energy balances were solved assuming pseudo steady-state conditions. These were updated at
each time step accounting for the transient nature of the process.
The energy balance includes the heat transfer by convection and radiation. The combustion of fuel is imposed in the sections where the burners are. The volatiles (hydrogen, methane, and tar) coming from anodes are directly transferred to the flue and burned. The heat losses from the top (to the ambient atmosphere) and the bottom (to the foundation) were considered in the model.
The overall mass balance for each cell is given as follows (the total mass flow out of a cell is equal to the sum of all mass flows coming in):
m ˙
g(out )− ∑
i
( m ˙
g(in) )
i=0
(1) Similar equations were written for the chemical species. The energy balance is expressed as follows:
m ˙
gC
pgT (out )= ∑
i
( m ˙
gC
pgT )
i+ ∑
j
( m ˙
gΔH )
j−2 A ( h
conv+h
rad)( T
g−T
Wall) −Q
F−lost(2) where
i fuel, tar, hydrogen, methane or infiltration, j fuel, tar, hydrogen or methane.
T temperature [K]
m
ggas mass flow rate [kg s
-1] C
pggas specific heat [J kg
-1K
-1] T
ggas temperature [K]
T
Wallwall temperature [K]
h
convconvective heat transfer coefficient [W m
-2K
-1] h
radradiative heat transfer coefficient [W m
-2K
-1] ΔH heat of combustion [J kg
-1]
Q
F-lostheat loss from the top and bottom of the flue [W m
-1] The pressure variation along the furnace was determined using the pressure drop equation resulting from a flow in a duct.
ΔP=f L Dh
m ˙
g 22ρAt2
(3)
where
ΔP pressure drop [Pa]
f Darcy-friction factor ρ fluid density [kg m
-3]
g gravitational acceleration [m s
-2] L flue length [m]
D
hhydraulic diameter [m]
A
tflow area between two baffles [m
2]
The pit sub-model solves the conduction heat transfer through the solids (refractory wall, packing coke, and anode block) on each vertical plane. Each section has four such planes. Thus, in the model, the number of vertical planes on which the transient differential conduction equation is solved is equal to four times the number of sections considered (for example, if 10 sections are considered in a fire cycle, temperature profiles are obtained on 40 vertical planes). This sub-model takes into account also the volatile evolution from anodes (tar, methane, and hydrogen) and the heat losses from the top to ambient air and from the bottom to the foundation [30]. Each plane is divided into a large number of cells in 2D. The equation can be written as:
(a) (b)
ρ
sC
ps∂ T
s∂ t = ∂
∂ z ( k
s∂ ∂ T z
s) + ∂ ∂ y ( ks∂ ∂ T y
s) −QP−lost
(4) where
s refractory wall, packing coke or anodes block ρ density [kg m
-3]
k thermal conductivity [W m
-1K
-1] C
pspecific heat [J kg
-1K
-1]
Q
P-lostheat loss to atmosphere and foundation [W m
-3]
T temperature [K]
y coordinate along the pit height [m]
z coordinate along the pit width [m]
t time [s]
The volatile evolution is calculated from the following kinetic equation:
dX
dT =k
0exp ( −E
0/ RT ) ⋅ ( 1−X )
n⋅ ( dT dt )−1
(5) where
X fractional conversion of a volatile component, k
0pre-exponential factor [s
-1],
E
0activation energy [J mol
-1], R universal gas constant [J mol
-1K
-1], n reaction order for a volatile component, T anode temperature in the pit [K]
dT/dt the heating rate calculated during the simulation [K s
-1].
t time [s]
Each volatile is assigned an ignition temperature [31]. In the model, it was assumed that the volatiles are burned instantaneously at the same rate as they are released from the anode (if the gas temperature is above their ignition temperatures).
However, different combustion patterns could be implemented depending on the baking process.
The two sub-models (pit sub-model and flue sub-model) are coupled via an interface located at the refractory wall surface on the flue side. The model calculations start with an imposed temperature distribution on the refractory wall surface. Then, the calculations on the flue side are carried out for all sections, i.e., on the entire fire cycle. Then, using the heat fluxes resulting from the calculated gas temperatures as the boundary conditions, the pit side equations are solved on the vertical planes in the pit sub- model. This gives a new temperature distribution on the refractory wall surface. This procedure is repeated at each time step until the end of the fire cycle is reached. The model was validated using the plant data obtained from a number of measurement campaigns.
Results and discussions
Various simulations were carried out with the model. The results of one of the simulations are given in Figures 3 to 9. Figure 3 shows the normalized average temperature variation for the gas, the refractory wall and the anodes along the furnace after 8 hour of heating following the permutation (the beginning of a firing cycle) as well as at the end of one complete firing cycle. After permutation, the temperature profiles vary as a function of time reaching their final values at the end of the firing cycle.
The model also gives two-dimensional distribution of the gas temperature in the flue of each section of the fire cycle along the furnace and two-dimensional temperature distributions on
numerous verticals planes across the solids (refractory wall, packing coke, and anodes). All of these distributions are determined at a number of time steps and thus are available as a function of time. The results are presented for sections 2 (preheating), 5 (heating), and 8 (cooling).
The 2-D gas temperature distributions are shown in Figures 4, 6, and 8, in sections 2, 5, and 8, respectively, after 8 hours of heating and at the end of one fire cycle. The temperature varies clearly along both the length and the height of the furnace. In sections 2 and 5 (preheating and heating sections, respectively), the temperature decreases in the direction of gas flow due to the transfer of heat to the solids at a given time. Also, the temperatures increase with time. In section 8 (cooling section), the gas temperature increases in the gas flow direction due to the cooling of the solids at a given time, and the temperatures decrease as a function of time.
Figure 3: The average temperature profile for gas, refractory wall, and anode after 8 hours following the permutation and at the end of one fire cycle (time FC); (Ch: chamber or section).
Gas flow
Figure 4: 2D gas temperature distribution in section 2: (a) 8 hours after permutation and (b) at the end of one fire cycle.
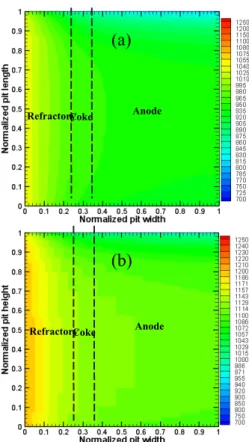
Figures 5, 7, and 9 give the 2-D temperature distributions within the solids on the vertical plane P4 (see Figure 2) in sections 2, 5, and 8, respectively. The solid temperature decreases from the refractory wall surface to the anode center in sections 2 and 5 (preheating and heating sections, respectively) due to the heat transfer from the gas to the solids. In the cooling section however (section 8), the temperature increase is in the direction of anodes to flue since the heat is transferred from hot anodes to colder flue gas. Such results can be obtained from the model for all sections in the fire cycle.
Figure 5: 2D distribution of the solid temperatures on the vertical plane P4 in the second section (Ch2, see Figure 3): (a) 8 hours after permutation and (b) at the end of one fire cycle.
Figure 1: 2D gas temperature distribution in section 5: (a) 8 hours after permutation and (b) at the end of one fire cycle.
Gas flow
Gas flow
Gas flow
Gas flow RefractoryCoke Anode
RefractoryCoke Anode
(a)
(b)
(a)
(b)
(b)
(a)
Figure 7: 2D distribution of the solid temperatures on the vertical plane P4 in the fifth section (Ch5, see Figure 3): (a) 8 hours after permutation and (b) at the end of one fire cycle.
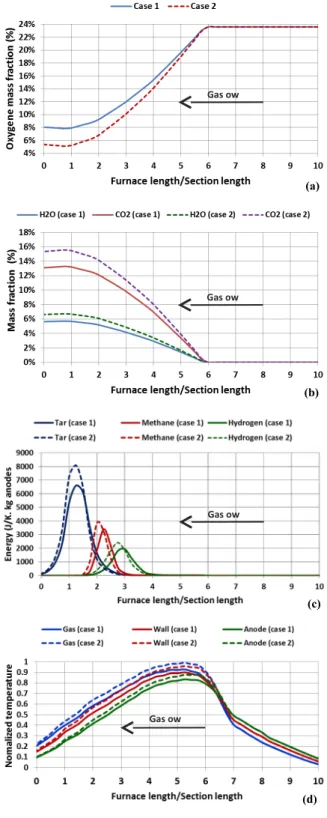
Depending on the baking process or the pitch properties in green anodes, the amount of the volatiles released could vary during baking. To determine its impact, two cases were studied; the total amount of volatiles released was taken as 5.4% (Case 1) and 6.6%
(Case 2) of the total green anode weight. Figure 10 shows the variation of the gas mass fractions (oxygen: Figure 10(a), CO
2, and H
2O: Figure 10b) and the energy provided due to the volatile combustion (Figure 10c). Compared to Case 1, the oxygen mass fraction decreases and the combustion gas mass fractions (CO
2and H
2O) increase for Case 2 due to the greater contribution of combustion. Figure 10d presents the resulting average gas, refractory wall, and anode temperatures along the furnace for the two cases. The temperatures are also affected due to the change in the combustion pattern.
Conclusions
The process model developed is a useful tool to investigate the horizontal anode baking furnace performance. The model allows the 2-D visualization of flue gas temperature distribution within any section at any time during baking. It gives also the 2-D temperature distribution on a large number of vertical planes across the solids (refractory wall, packing coke, and anode blocks) along the furnace. This model serves as a powerful tool to determine the impact of various operational parameters on the furnace performance and to carry out parametric studied to optimize the baking process.
Figure 8: 2D gas temperature distribution in section 8: (a) 8 hours after permutation and (b) at the end of one fire cycle.
Figure 9: 2D distribution of the solid temperatures on the vertical plane P4 in the eighth section (Ch8, see Figure 3): (a) 8 hours after permutation and (b) at the end of one fire cycle.
Gas flow
Gas flow RefractoryCoke Anode
RefractoryCoke Anode
RefractoryCoke Anode
RefractoryCoke Anode
(a)
(b)
(a)
(b)
(b)
(a)
Figure 10: Comparison of the two cases studied: variation along the furnace length of (a) the oxygen mass fraction, (b) the CO
2and H
2O mass fractions, (c) the energy provided due to volatile combustion, and (d) the average gas, refractory wall, and anode temperatures.
Acknowledgements
The technical and financial support of Aluminerie Alouette Inc. as well as the financial support of the National Science and Engineering Research Council of Canada (NSERC), Développement économique Sept-Îles, the University of Québec at Chicoutimi (UQAC), and the Foundation of the University of Québec at Chicoutimi (FUQAC) are greatly appreciated.
References
1 Fisher W.K., Mannweiler U., Keller F., Perruchoud R.C., and Bûhler U., Anodes for the aluminium industry (Sierre, Switzerland, R&D Carbon Ltd. 1995) 394.
2 Charette, A., Kocaefe, Y, Kocaefe, D., “Le carbone dans l’industrie d’aluminium”, La Presses de l’aluminium (PRAL), Chicoutimi, Quebec, Canada, (2012).
3 Furman A., Martirena, H., “A Mathematical Model Simulating an Anode Baking Furnace,” Light Metals (AIME), (1980), 545-552.
4 Benton, et al., Method and apparatus for producing uniformly baked anodes (United States Patent 1982) (4) 354-828 5 Hurlen J., Lid O., Naterstad T., Utne P., “Operation
characteristics of a vertical flue ring furnace,” Light Metals, (1981), 569−581.
6 Fernandez, E., Marletto J., Martirena H., “Combined mathematical simulation and experimental studies on a closed baking furnace,” Light Metals, (1983), 805−817.
7 López Hercules J. R., Vargas Sarmiento P. A., “Mathematical model for a ring type anode baking furnace,” Light Metals, (1988), 315−323.
8 Ordronneau F., Gendre M., Pomerleau L., Backhouse N., Berkovich A., Huang X., “Meeting the challenge of increasing anode baking furnace productivity,” Light Metals, (2011), 865−870.
9 Keller F. Disselhorst J. H. M., “Modern anode bake furnace developments,” Light Metals (1981), 611−621.
10 Bui R. T., Charette A., Bourgeois T., “Simulating the process of carbon anode baking used in the aluminum industry”
Metall. Mater. Trans. B 15 (3) (1984), 487−492.
11 Bui R.T., Charrette A. and Bourgeois T., “Simulating the process of carbon anode baking used in the aluminum industry,” Metallurgical Transactions B, 15 (1984), 487-492.
12 Bui R.T., Charette A. and Bourgeois, T., “A computer Model for the Horizontal Flue Ring Furnace,” IEEE Transactions on Industry Applications, 20 (4) (1984), 894-901.
13 Bui R. T., Dernedde E., Charette A. and Bourgeois T.,
“Mathematical simulation of horizontal flue ring furnace,”
Light Metals, (1984), 1033-1040.
14 Charette A., Bui R. T., Bourgeois T., “Modeling the heat transfer in a ring furnace,” IEEE Transactions on Industry Applications, 20 (4) (1984), 902−907.
15 Thibault M., Bui R. T., Charette A., Dernedde E., “Simulating the dynamics of the anode baking ring furnace,” Light Metals, (1985), 1141−1151.
16 Bui R.T., Charette A., Bourgeois T., Dernedde E.,
“Performance analysis of the ring furnace used for baking industrial carbon electrodes,” Canadian Journal of Chemical Engineering, 65 (1) (1987), 96−101.
17 Bourgeois T., Bui R. T., Charette A., Sadler B., “Computer simulation of a vertical ring furnace,” Light Metals, (1990) 547−552.
18 Ouellet R., Jiao Q., Chin E., Celik C., Lancaster D., Wilburn D., “Anode baking furnace modelling for process optimization,” Light Metals, (1995), 653−662.
Gas flow
Gas flow Gas flow Gas flow