HAL Id: hal-00302576
https://hal.archives-ouvertes.fr/hal-00302576
Submitted on 8 Feb 2007HAL is a multi-disciplinary open access
archive for the deposit and dissemination of sci-entific research documents, whether they are pub-lished or not. The documents may come from teaching and research institutions in France or abroad, or from public or private research centers.
L’archive ouverte pluridisciplinaire HAL, est destinée au dépôt et à la diffusion de documents scientifiques de niveau recherche, publiés ou non, émanant des établissements d’enseignement et de recherche français ou étrangers, des laboratoires publics ou privés.
Modelling the global tropospheric ozone budget:
exploring the variability in current models
O. Wild
To cite this version:
O. Wild. Modelling the global tropospheric ozone budget: exploring the variability in current models. Atmospheric Chemistry and Physics Discussions, European Geosciences Union, 2007, 7 (1), pp.1995-2035. �hal-00302576�
ACPD
7, 1995–2035, 2007 Sensitivities in modelling global tropospheric ozone O. Wild Title Page Abstract Introduction Conclusions References Tables Figures ◭ ◮ ◭ ◮ Back CloseFull Screen / Esc
Printer-friendly Version Interactive Discussion
EGU Atmos. Chem. Phys. Discuss., 7, 1995–2035, 2007
www.atmos-chem-phys-discuss.net/7/1995/2007/ © Author(s) 2007. This work is licensed
under a Creative Commons License.
Atmospheric Chemistry and Physics Discussions
Modelling the global tropospheric ozone
budget: exploring the variability in
current models
O. Wild1,*
1
Frontier Research Center for Global Change, JAMSTEC, Yokohama, Japan
*
now at: Centre for Atmospheric Science, University of Cambridge, UK
Received: 11 January 2007 – Accepted: 6 February 2007 – Published: 8 February 2007 Correspondence to: O. Wild ([email protected])
ACPD
7, 1995–2035, 2007 Sensitivities in modelling global tropospheric ozone O. Wild Title Page Abstract Introduction Conclusions References Tables Figures ◭ ◮ ◭ ◮ Back CloseFull Screen / Esc
Printer-friendly Version Interactive Discussion
EGU
Abstract
What are the largest uncertainties in modelling ozone in the troposphere, and how do they affect the calculated ozone budget? Published chemistry-transport model stud-ies of tropospheric ozone differ significantly in their conclusions regarding the impor-tance of the key processes controlling the ozone budget: influx from the stratosphere,
5
chemical processing and surface deposition. This study surveys ozone budgets from previous studies and demonstrates that about two thirds of the increase in ozone pro-duction seen between early assessments and more recent model intercomparisons can be accounted for by increased precursor emissions. Model studies using recent estimates of emissions compare better with ozonesonde measurements than studies
10
using older data, and the tropospheric burden of ozone is closer to that derived here from measurement climatologies, 335±10 Tg. However, differences between individ-ual model studies remain large and cannot be explained by surface precursor emis-sions alone; cross-tropopause transport, wet and dry deposition, humidity, and light-ning make large contributions to the differences seen between models. The importance
15
of these processes is examined here using a chemistry-transport model to investigate the sensitivity of the calculated ozone budget to different assumptions about emissions, physical processes, meteorology and model resolution. The budget is particularly sen-sitive to the magnitude and location of lightning NOx emissions, which remain poorly constrained; the 3–8 TgN/yr range in recent model studies may account for a 10%
20
difference in tropospheric ozone burden and a 1.4 year difference in CH4 lifetime. Dif-ferences in humidity and dry deposition account for some of the variability in ozone abundance and loss seen in previous studies, with smaller contributions from wet de-position and stratospheric influx. At coarse model resolutions stratospheric influx is systematically overestimated and dry deposition is underestimated; these differences
25
are 5–8% at the 300–600 km grid-scales investigated here, similar in magnitude to the changes induced by interannual variability in meteorology. However, a large proportion of the variability between models remains unexplained, suggesting that differences in
ACPD
7, 1995–2035, 2007 Sensitivities in modelling global tropospheric ozone O. Wild Title Page Abstract Introduction Conclusions References Tables Figures ◭ ◮ ◭ ◮ Back CloseFull Screen / Esc
Printer-friendly Version Interactive Discussion
EGU model chemistry and dynamics have a large impact on the calculated ozone budget,
and these should be the target of future model intercomparisons.
1 Introduction
Ozone is an important greenhouse gas, a major component of photochemical smog, and the primary source of hydroxyl radicals which control the oxidizing capacity of the
5
troposphere (e.g.,Prather and Ehhalt,2001). The abundance of O3in the troposphere is controlled by transport from the O3-rich stratosphere, by chemical production follow-ing the oxidation of hydrocarbons and CO in the presence of nitrogen oxides (NOx) and by removal via chemical destruction or dry deposition. The magnitudes of these sources and sinks have not been reliably quantified, and observational constraints on
10
them remain poor. The chemical lifetime of O3 in the troposphere, typically days to weeks, is similar in magnitude to the dynamical timescales for transport and mixing, and thus the factors controlling O3 are not easily separable. The net effects of chem-ical processing are dependent on the balance between large production and destruc-tion terms which dominate in different regions of the troposphere, and the importance
15
of stratosphere-troposphere exchange (STE) is similarly dependent on the balance be-tween downward transport of O3 from the stratosphere, mostly at mid-latitudes, and a smaller upward flux in tropical regions. The equilibrium between these chemical and dynamical fluxes constitutes a buffering of tropospheric O3, and poor estimates of one or more of these governing processes may be masked by readjustment of the others so
20
that the abundance of O3in the troposphere is not greatly affected. However, a quan-titative understanding of the processes controlling the production, redistribution and fate of O3in the troposphere is required before a reliable assessment can be made of how O3may respond to changes in anthropogenic emissions of trace gases or global climate.
25
Global chemistry-transport models (CTMs) that simulate the chemical and dynami-cal processes controlling O3provide a self-consistent estimate of the key budget terms.
ACPD
7, 1995–2035, 2007 Sensitivities in modelling global tropospheric ozone O. Wild Title Page Abstract Introduction Conclusions References Tables Figures ◭ ◮ ◭ ◮ Back CloseFull Screen / Esc
Printer-friendly Version Interactive Discussion
EGU Most CTMs can reproduce the seasonality and distribution of tropospheric O3
mea-sured by ozonesondes in a climatological sense, but assessments of the relative im-portance of the controlling processes vary widely (Prather and Ehhalt,2001). Recent model intercomparison studies estimate a net O3 influx of 550 Tg/yr from the strato-sphere and a surface removal of 1000 Tg/yr by dry deposition, with net chemical
pro-5
duction making up the balance of 450 Tg/yr (Stevenson et al.,2006). However, there are large differences between individual model studies in the importance of these terms reflecting differences in their treatments of chemical and dynamical processes. These differences highlight significant imperfections in our current understanding of the key factors involved (e.g., in the magnitude and distribution of emissions, chemical
process-10
ing, and convection) and in their numerical representation at computationally-tractable temporal and spatial scales. CTMs are typically focussed on global-scale issues such as attribution of climate impacts due to changing patterns of fossil fuel combustion (Gauss et al., 2003;Dentener et al., 2006a), or assessment of the policy impacts of intercontinental transport of oxidants on air quality (e.g.,Holloway et al.,2003). Many
15
of the chemical and dynamical processes controlling O3 in the troposphere occur at much smaller temporal and spatial scales than can be resolved in these models, and thus important processes are parameterized, introducing additional uncertainty. Never-theless, improved understanding of the interactions between tropospheric composition and climate, and in particular of how changes in climate may affect the sources and
20
fate of tropospheric O3, requires that the principal terms in the O3budget can be quan-tified in a reliable and consistent way so that the sensitivity of the budget to changes in transport, convection, chemistry and deposition can be evaluated reliably. Recent model intercomparison exercises have suggested that this may not currently be the case (Prather and Ehhalt,2001;Stevenson et al.,2006).
25
The aims of this paper are to explore the differences seen in previous model esti-mates of the source and fate of tropospheric O3, and to investigate to what extent these arise from the use of different input conditions or from differences in model formulation. Differences in precursor emissions or meteorological data may mask the more
sub-ACPD
7, 1995–2035, 2007 Sensitivities in modelling global tropospheric ozone O. Wild Title Page Abstract Introduction Conclusions References Tables Figures ◭ ◮ ◭ ◮ Back CloseFull Screen / Esc
Printer-friendly Version Interactive Discussion
EGU tle differences that reflect improved scientific understanding or deficiencies in process
representation. Identifying the source of these differences is important for reducing the uncertainty in the modelled response of tropospheric O3 to applied changes and for interpreting the results of multi-model “ensemble” studies. The sensitivity of the budget terms to key model processes is explored here in a consistent way with a single model.
5
Section2reviews tropospheric O3 budgets from published studies and highlights the origins of some of the differences between them. Section3describes the limited obser-vational constraints on the O3 budget. Section4 then examines the sensitivity of the budget terms to emissions, meteorology, and key physical processes and interprets the variability seen in previous studies in light of these results. The implications of the
10
results for future model intercomparison studies are outlined in Sect.5.
2 Tropospheric ozone budgets in global models
A comparison of O3 budgets from published global model studies is presented in Ta-ble1. The studies are ordered chronologically by publication date, and statistics from earlier studies summarised in the Intergovernmental Panel on Climate Change (IPCC)
15
Third Assessment Report (TAR)Prather and Ehhalt (2001) are compared with those published since 2000 to show how the calculated O3 budget has evolved. There are large differences in the key terms between individual model studies: STE fluxes vary by a factor of four (340–1440 Tg/yr), deposition fluxes vary by almost a factor of three (530–1470 Tg/yr), and gross chemical production varies by a factor of two
20
(2330–5260 Tg/yr). The tropospheric burden of O3 varies between 240 and 380 Tg. However, these studies vary widely in their precursor emissions and in model formu-lation and resolution. Many of the pioneering early studies used simplified chemistry schemes omitting oxidation of non-methane hydrocarbons (NMHC), and a number of them had unreasonably high estimates of stratospheric influx; compensation between
25
the key terms in the budget leads several studies to conclude that the troposphere is a net chemical sink of O3. Recent studies have benefited from more detailed
chemi-ACPD
7, 1995–2035, 2007 Sensitivities in modelling global tropospheric ozone O. Wild Title Page Abstract Introduction Conclusions References Tables Figures ◭ ◮ ◭ ◮ Back CloseFull Screen / Esc
Printer-friendly Version Interactive Discussion
EGU cal schemes, improved understanding of the emissions of key precursor species, and
better quality meteorological data at higher spatial resolution. This has reduced the variability in independent studies published since 2000 compared with those surveyed in the IPCC-TAR, but the 1σ variability remains large: STE 530±100 Tg/yr, chemistry 400±250 Tg/yr, and deposition 950±220 Tg/yr. It is not clear how much of this
variabil-5
ity is due to the use of different input data (e.g., emissions or meteorological data) and how much is down to different model treatments of the key processes involved. These studies have typically used their own definitions of the tropopause and of the chemical fluxes constituting O3 production, making direct comparison of O3 burdens, lifetimes and tendencies particularly difficult.
10
A recent model intercomparison coordinated by the European Union project Atmo-spheric Composition Change: the European Network of Excellence (ACCENT) in-volved many of the models shown in Table1and aimed to reduce these uncertainties by constraining precursor emissions and applying consistent tropopause diagnostics across all participating models (Dentener et al.,2006a;Stevenson et al.,2006). The
15
budget terms calculated in this study were higher than those from previous studies, and the variability in the terms was also larger, despite the more tightly constrained conditions. In particular, there is an increase in gross production between the IPCC-TAR (3450 Tg/yr), studies published since 2000 (4470 Tg/yr) and the ACCENT inter-comparison (5110 Tg/yr), which is accompanied by a 10% increase in O3 burden, a
20
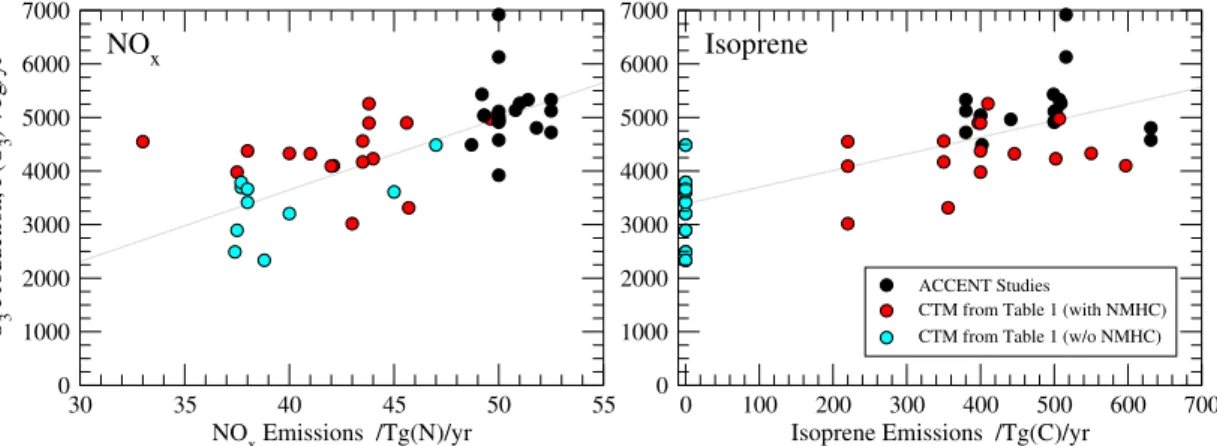
20% increase in deposition, and a drop in the tropospheric lifetime of O3 from 24 to 22 days. Higher estimates of precursor emissions make a substantial contribution to the increased production, as noted in regression analyses byWu et al. (2006). The sensitivity of gross O3 production to surface emissions of NOxand isoprene (C5H8) is shown in Fig.1for published studies and for individual models contributing to the
AC-25
CENT intercomparison. While the strong dependence on surface emissions is clear, there is a large scatter in these plots, even for the relatively well-constrained ACCENT studies, indicating that other factors have an important influence on the budget. A major goal of the present study is to investigate the effects of these processes more closely
ACPD
7, 1995–2035, 2007 Sensitivities in modelling global tropospheric ozone O. Wild Title Page Abstract Introduction Conclusions References Tables Figures ◭ ◮ ◭ ◮ Back CloseFull Screen / Esc
Printer-friendly Version Interactive Discussion
EGU using the tighter constraints imposed by application of a single model framework, and
ensuring that comparison of budget terms is fully self-consistent.
3 Constraints from observations
Of the budget terms considered here only influx of O3from the stratosphere has been adequately estimated from observational data. Murphy and Fahey (1994) used
ob-5
served mid-latitude N2O–O3 correlations and an upward flux of N2O derived from a budget analysis to derive a net downward flux of O3of 450 Tg/yr, with a range of 200– 870 Tg/yr. Gettelman et al. (1997) used lower stratospheric O3 measurements and calculations of the residual circulation to derive a net downward flux of 510 Tg/yr at 100 hPa (with a range of 450–590 Tg/yr). McLinden et al. (2000) reduced the
uncer-10
tainty in the analysis of Murphy and Fahey (1994) by considering the tighter N2O– NOy and NOy–O3 relationships separately, estimating a flux of 475±120 Tg/yr, and further refinements byOlsen et al.(2001) led to the best estimate currently available, 550±140 Tg/yr. Most model studies published since 2000 fall within this range, and the mean influx from the ACCENT model intercomparison was 552 Tg/yr. However, This
15
agreement masks significant differences in the magnitude of gross cross-tropopause fluxes and in treatment of stratospheric O3, and does not constitute an independent comparison as some models apply a flux constraint through use of tuned upper bound-ary conditions or an artificial stratospheric O3 tracer such as Synoz (McLinden et al., 2000).
20
In the absence of reliable observation-based estimates of global deposition fluxes or chemical production, the best remaining constraint is on the abundance of O3itself. Without details of the seasonal, geographical and altitudinal variations in O3from pre-vious studies only a simple comparison of the mean annual global tropospheric burden is possible here. However, the tropospheric O3burden and its dependence on the
defi-25
nition of the tropopause has not been evaluated previously. The tropospheric burden is estimated here from three different climatologies built from available ozonesonde,
satel-ACPD
7, 1995–2035, 2007 Sensitivities in modelling global tropospheric ozone O. Wild Title Page Abstract Introduction Conclusions References Tables Figures ◭ ◮ ◭ ◮ Back CloseFull Screen / Esc
Printer-friendly Version Interactive Discussion
EGU lite and surface measurements, and using a number of different dynamical and thermal
definitions of the tropopause, see Table 2. The climatologies were interpolated onto a common 4◦×5◦ grid and integrated from the surface to a tracer tropopause defined by a given abundance of O3 (100, 120 or 150 ppb), a thermal tropopause based on a lapse rate of 2 K km−1 following the WMO definition, or a dynamical tropopause based
5
on potential vorticity (PV) using the lower of the PV=2.0 surface and the tropical 380 K isentrope. For comparison, a cold-point tropopause based on the tropical temperature minimum is shown (a WMO thermal tropopause was applied in the extra-tropics), and a stepped-isobaric tropopause typical of crude model diagnostics is also used (100 hPa in the tropics and 250 hPa poleward of 30◦). Thermal and dynamical tropopauses
10
were calculated using monthly-mean data for year 2000 from the European Centre for Medium-Range Weather Forecasts (ECMWF); burdens calculated with 1997 data dif-fer by less than 2 Tg (<1%). These comparisons provide only crude estimates of the true tropospheric burden, neglecting temporal or spatial variations in tropopause height which may bias it high or low, but they provide a convenient benchmark against which
15
model simulations can be compared.
Use of a tracer tropopause provides the greatest consistency in O3 burden for the different climatologies, as differences in O3distribution are suppressed. This definition is the simplest to employ when comparing model studies, and based on the 150 ppb level recommended byPrather and Ehhalt(2001) suggests a tropospheric burden of
20
335±10 Tg for the three climatologies used here. Thermal definitions generally give higher burdens, as noted byBethan et al.(1996), and are more sensitive to O3 differ-ences in the tropopause region and thus more variable; the WMO lapse-rate definition gives a burden of about 352±30 Tg. Interestingly, the crude pressure tropopause gives very similar burdens to the WMO lapse-rate tropopause for all three climatologies used
25
here, but note that they are quite different for typical model fields (discussed below), highlighting systematic differences in O3 distribution between modelled and climato-logical fields. The PV=2.0 dynamical tropopause gives similar burdens to the 150 ppb tracer tropopause for both model and climatological fields, and burdens are consistently
ACPD
7, 1995–2035, 2007 Sensitivities in modelling global tropospheric ozone O. Wild Title Page Abstract Introduction Conclusions References Tables Figures ◭ ◮ ◭ ◮ Back CloseFull Screen / Esc
Printer-friendly Version Interactive Discussion
EGU lower than with the WMO lapse-rate definition.
There is considerable uncertainty in these estimates due to the sparse coverage of ozonesonde sites, but the O3burdens derived here are generally lower than the 370 Tg burden recommended byPrather and Ehhalt(2001). The dynamical tropopause is rep-resented well by the 150 ppb O3 tracer tropopause, and the mean burden of 344 Tg
5
from the ACCENT model intercomparison (reduced to 336 Tg after removing model outliers) (Stevenson et al.,2006) is in good agreement with the 335±10 Tg range es-timated here from measurement climatology. The variability in burden for a single O3 distribution based on different definitions of the tropopause is as much as ±15%, sug-gesting that differences in definition make an important contribution to the differences
10
between model burdens shown in Table1.
4 CTM sensitivity studies
The dependence of the calculated O3budget on precursor emissions and on physical and meteorological variables is investigated here with a global CTM. Altering variables independently allows an assessment of their contributions to the model differences
15
seen in Table1, and use of a single model framework ensures that the comparison of their relative importance is self-consistent. A similar approach has been adopted in a recent study of uncertainties in a regional model (Mallet and Sportisse, 2006). Pre-vious global studies have focussed on the effects of individual variables, e.g., hydro-carbon oxidation (Houweling et al.,1998;Roelofs and Lelieveld,2000;von Kuhlmann
20
et al.,2004), STE (Wauben et al.,1998), model resolution (von Kuhlmann et al.,2003; Wild and Prather,2006), lightning NOx emissions (Labrador et al., 2005), convection (Lawrence et al., 2003;Doherty et al.,2005), and interannual variability in meteorol-ogy (Zeng and Pyle,2005), but have not compared their effects in a comprehensive or systematic way.
25
The model used here is the Frontier Research System for Global Change (FRSGC) version of the University of California, Irvine (UCI) CTM described inWild and Prather
ACPD
7, 1995–2035, 2007 Sensitivities in modelling global tropospheric ozone O. Wild Title Page Abstract Introduction Conclusions References Tables Figures ◭ ◮ ◭ ◮ Back CloseFull Screen / Esc
Printer-friendly Version Interactive Discussion
EGU (2000) with the configuration used inWild et al.(2004). Pieced-forecast meteorological
data generated by the European Centre for Medium-Range Weather Forecasts Inte-grated Forecast System (ECMWF-IFS) are used to drive the model. The 70–80 runs performed here use the same initial conditions and spin-up period, but a different vari-able is altered in each case to quantify its effect on the O3budget. The tropopause is
5
diagnosed on-line using the 120 ppb abundance of Linoz, an O3-like tracer with a lin-earised O3 chemistry in the stratosphere, no loss in the free troposphere and a 2-day relaxation to 20 ppb at the surface (McLinden et al.,2000). For consistency with other published studies, O3 budget terms are diagnosed from monthly-mean model output based on a 150 ppb O3tracer tropopause (Prather and Ehhalt,2001;Stevenson et al.,
10
2006). The difference in O3 burden between this diagnostic O3 tropopause and the on-line Linoz tropopause is generally less than 10 Tg, about 3%.
Two sets of emissions scenarios are used in these experiments. The base scenario (“BASE”) for NOx, CO and NMHC loosely represents 1990’s understanding, and is taken from version 2 of the EDGAR database for 1990 (Olivier et al., 1996) with
iso-15
prene emissions fromGuenther et al.(1995) reduced to 220 TgC/yr following Hauglus-taine et al. (1998). A second, updated scenario (“IIASA”) uses emission distributions from EDGAR v3.2 for 1995 (Olivier and Berdowski,2001) scaled to the year 2000 us-ing emission data from the International Institute for Applied Systems Analysis (IIASA) (Dentener et al.,2005), as recommended for the recent ACCENT model
intercompari-20
son. The sensitivity studies described here use the BASE emissions unless otherwise indicated, and are run with 1996 meteorology at T21L19 resolution (5.6◦resolution with 19 levels).
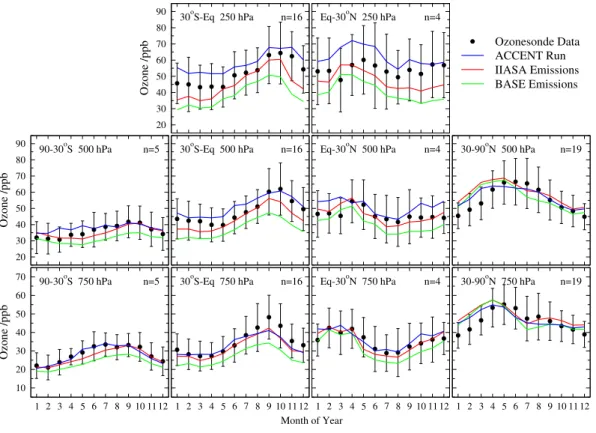
Model runs are evaluated by comparing with ozonesonde observations from the pe-riod 1980–1993 (Logan,1999), supplemented by additional data from the tropics
be-25
tween 1997 and 2002 (Thompson et al.,2003). Monthly interannual mean O3 mixing ratios at selected altitudes at each location are averaged over four latitude bands and compared with monthly means from model simulations sampled at the same locations, following the method of Stevenson et al. (2006), see Fig. 2. Three model
scenar-ACPD
7, 1995–2035, 2007 Sensitivities in modelling global tropospheric ozone O. Wild Title Page Abstract Introduction Conclusions References Tables Figures ◭ ◮ ◭ ◮ Back CloseFull Screen / Esc
Printer-friendly Version Interactive Discussion
EGU ios are shown to illustrate the range of O3 responses: the control run (BASE), a run
with updated emissions (IIASA), and a run contributed to the ACCENT intercompari-son (ACCENT) which used IIASA emissions in different model conditions (year 2000 meteorology with higher horizontal and vertical resolution, T42L37, and minor improve-ments to model physics described inWild and Prather,2006). While the magnitude and
5
seasonality of O3are captured reasonably well in these runs, a number of discrepan-cies clearly remain, most notably in the wintertime at Northern mid-latitudes and in the tropical upper troposphere. The difference between BASE and IIASA runs shows how changes in precursor emissions alone contribute to changes in O3; comparison with observations suggests that emissions in the BASE scenario are too low,
particu-10
larly in the tropics. Differences between the IIASA and ACCENT runs reflect changes in meteorology and resolution, although differences in the tropical upper troposphere are dominated by changes in the magnitude and vertical distribution of lightning NOx emissions in the ACCENT run.
To provide a more quantitative measure of model performance, the mean bias and
15
root mean square (RMS) error are calculated over the ten locations shown in Figure2 weighted by pressure so that they are representative of the O3 burden. The annual mean bias over these locations for the BASE, IIASA and ACCENT runs is –5.3, –1.0 and 1.6 ppb, respectively, and the RMS errors are 7.8, 4.6 and 4.3 ppb. Comparison of the annual mean tropospheric O3 burden with climatologies provides an additional
20
measure of model performance, see Table2. Using the BASE emissions the O3burden is consistently low for all tropopause definitions; the comparison is best for the ACCENT run where there is close agreement with theFortuin and Kelder(1998) climatology. The largest differences are seen for the simple diagnostic tropopause based on pressure, reflecting differences in the geographical distribution of O3 in the tropopause region
25
ACPD
7, 1995–2035, 2007 Sensitivities in modelling global tropospheric ozone O. Wild Title Page Abstract Introduction Conclusions References Tables Figures ◭ ◮ ◭ ◮ Back CloseFull Screen / Esc
Printer-friendly Version Interactive Discussion
EGU 4.1 Sensitivity to precursor emissions
The dependence of O3 production on precursor emissions shown in Fig. 1 suggests that increases in NOxand isoprene emissions between the IPCC-TAR survey and the ACCENT studies make a large contribution to the differences seen in the calculated O3 budget. To examine this, surface emissions of isoprene and NOx are increased
5
independently by replacing the BASE emissions with the higher values recommended for the ACCENT runs, see Table 3. The increase from 42 to 51 TgN/yr for NOx and from 220 to 500 TgC/yr for isoprene each contribute an additional 450 Tg of O3 produc-tion per year. Scaled to the mean emission increases between the IPCC-TAR survey and the ACCENT studies, these changes account for about 1100 Tg/yr of additional
10
production, 66% of the 1660 Tg/yr increase in mean production between the studies. Production is enhanced more with increased isoprene than with increased NOx, but a greater proportion of this occurs in the boundary layer where surface deposition is greater, and thus the increase in the tropospheric burden is less. Higher NOx and iso-prene emissions both lead to a decrease in the lifetime of tropospheric O3 to loss by
15
chemistry and deposition, but they have opposing effects on the lifetime of CH4, as NOx is a net source of OH while isoprene is a net sink. The greatly reduced mean bias and RMS error compared with ozonesonde data suggest that the higher NOxand isoprene emissions recommended for the ACCENT runs are more appropriate for present-day studies than those in the BASE scenario.
20
These emission scenarios are compared with those used in the OxComp model intercomparison conducted for the IPCC-TAR (Prather and Ehhalt,2001), and with the IIASA emissions. The OxComp emissions give very similar budget changes to the increased-NOx run, BASE+N, and the IIASA emissions give budgets similar to the increased-NOxand isoprene run, BASE+NI. Although the differences in the O3lifetime
25
between these runs and the equivalent BASE runs are small, the CH4lifetime changes significantly as emissions of CO and NMHC differ in the OxComp and IIASA scenarios. To explore the full sensitivity of the O3 budget to emissions of NOx and isoprene, a
ACPD
7, 1995–2035, 2007 Sensitivities in modelling global tropospheric ozone O. Wild Title Page Abstract Introduction Conclusions References Tables Figures ◭ ◮ ◭ ◮ Back CloseFull Screen / Esc
Printer-friendly Version Interactive Discussion
EGU series of 20 runs have been performed using isoprene emissions of 0, 220, 350, 500
and 650 TgC/yr and NOx emissions of 30, 42, 51 and 60 TgN/yr. Isoprene emissions were scaled linearly on the distribution ofGuenther et al.(1995), while NOx emissions were varied non-linearly, with the 30 TgN/yr scenario representing 1970 conditions and the 60 TgN/yr scenario scaled to IIASA current-legislation emissions for 2030
(Den-5
tener et al.,2005). The variation in key budget terms is shown in Fig.3. The gross pro-duction and burden of O3 both increase steadily with increasing precursor emissions, consistent with the changes seen in the published budgets (see Fig.1 and Table 1) and the O3 lifetime is reduced as chemical destruction and deposition increase. The contrasting effects of NOx and isoprene on OH lead to a balance such that the CH4
10
lifetime remains little affected, but the gradient of the slope is steep, and small changes in either NOxor isoprene can affect the lifetime substantially.
Note that the effects seen here are dependent on the complexity of the chemical scheme used in the model. The simplified scheme used here does not include iso-prene nitrates, and more detailed studies treating their formation and deposition have
15
found this to be a significant channel for removal of both isoprene intermediates and NOx (P ¨oschl et al.,2000;von Kuhlmann et al.,2004). It is not clear how many previ-ous studies have included this pathway, but it has been shown to lead to stabilization of O3 production with increasing isoprene emissions (Wu et al., 2006). The differing complexity of chemical schemes may be an important source of differences between
20
model studies and merits a more detailed investigation.
Table3also shows the sensitivity of the budget terms to the treatment of other hydro-carbons. Use of a globally-uniform field of CH4instead of CH4emissions and chemical integration avoids the long spin-up times associated with CH4, but has very little effect on the O3 budget or lifetime. The CH4 lifetime is extended by about 5%, reflecting a
25
higher atmospheric burden in the stratosphere when using a uniform field. Removal of all NMHC emissions leads to a reduction in O3 production of about 900 Tg/yr, half of which is due to isoprene, and a reduction in O3burden of about 35 Tg (12%) compared with the BASE scenario. These results are consistent with those of Houweling et al.
ACPD
7, 1995–2035, 2007 Sensitivities in modelling global tropospheric ozone O. Wild Title Page Abstract Introduction Conclusions References Tables Figures ◭ ◮ ◭ ◮ Back CloseFull Screen / Esc
Printer-friendly Version Interactive Discussion
EGU (1998) shown in Table1.
4.2 Sensitivity to physical processes
Meteorological and dynamical processes influence the production, mixing and removal of O3 both directly and indirectly. Humidity, temperature and UV flux govern chem-ical reaction rates, boundary layer turbulence and convection redistribute O3 and its
5
precursors, influencing O3production and removal, and deposition processes remove O3 and soluble precursors. Ozone chemistry in the upper troposphere is influenced by the magnitude and distribution of lightning-produced NOx emissions and by direct influx of O3 from the stratosphere. Perturbation experiments are performed with the FRSGC/UCI CTM to explore the effect of these processes on O3, and the impacts on
10
the key budget terms are shown in Table4. For compatibility with the emissions studies in Sect.4.1, the same BASE control run was used.
The stratospheric influx of O3 was increased by applying a consistent scaling of stratospheric Linoz chemistry. This leads to increased chemical removal and deposi-tion in the troposphere, but also to decreased O3production, as noted byWauben et al.
15
(1998), due to faster removal of NOx. Of the additional O3transported from the strato-sphere, about 60% is destroyed chemically, 10% is deposited at the surface, and 30% is accounted for by decreased production. Quantifying the impact of STE on the tropo-spheric burden and lifetime of O3is complicated by the choice of tropopause, however. Applying a thermal or dynamical tropopause or using the same location as in the
con-20
trol run leads to a large increase in the burden and an increase in lifetime associated with additional O3 at high altitude. However, applying an O3 tracer tropopause leads to a much smaller increment in the burden as the tropospheric domain shrinks, and the O3 lifetime shows a marginal decrease, see Table 4. Use of a tracer tropopause clearly damps the calculated budget response to changes in STE. As removal of O3by
25
dry deposition changes only slowly along with the burden, the net impact of chemistry, P-L, is very sensitive to the STE flux used.
ACPD
7, 1995–2035, 2007 Sensitivities in modelling global tropospheric ozone O. Wild Title Page Abstract Introduction Conclusions References Tables Figures ◭ ◮ ◭ ◮ Back CloseFull Screen / Esc
Printer-friendly Version Interactive Discussion
EGU by removal of precursors such as NOx and PAN. Increased deposition is balanced
largely by decreased chemical loss due to lower O3, with a small increase in production caused by lower OH and hence an increased lifetime for NOx. The decreased chemical loss is responsible for lower OH formation and hence for the increased CH4 lifetime. The net impact of chemistry is very sensitive to dry deposition as the net STE flux
5
changes only marginally in response to changes in the tropospheric burden. Note the non-linear response of the dry deposition rate to the applied increases in deposition velocity as the surface O3 abundance falls. In contrast, wet deposition does not affect O3directly but leads to the removal of soluble species such as HNO3and H2O2which influence the availability of NOxand OH. Increasing removal of these species by 50%
10
causes both production and loss of O3 to fall by about 2.5%, and the tropospheric burden drops proportionately. The small drop in net chemical production is balanced by reduced dry deposition, and the lifetime of O3is little affected. However, the decrease in OH leads to a significant increase in the lifetime of CH4, and the OH response is 60–90% larger than for equivalent changes in the dry deposition rate. A non-linear
15
response is also evident here, as a 50% reduction in wet deposition rates has twice the effect on the O3burden and removal as a 50% increase.
The effects on oxidant chemistry of small, globally uniform changes in temperature and humidity representing the uncertainty in meteorological fields are also examined. Increases in temperature affect chemical reaction kinetics and lead to significantly
in-20
creased O3production and loss rates, but net production and other key budget terms are largely unaffected, and the tropospheric burden drops by less than 1% for a tem-perature rise of 5◦C. However, the faster chemistry leads to a higher abundance of OH, and the CH4lifetime is reduced by almost 10% for a 5◦C rise. This sensitivity of CH4oxidation to temperature provides a small negative feedback on climate warming,
25
as noted by Fiore et al. (2006), and highlights temperature as a significant source of uncertainty in model-derived CH4 lifetimes, as noted by Stevenson et al. (2000). In-creased humidity leads to more efficient O3loss and greater OH production. Additional OH boosts O3production, but this only makes up about 45% of the additional O3loss,
ACPD
7, 1995–2035, 2007 Sensitivities in modelling global tropospheric ozone O. Wild Title Page Abstract Introduction Conclusions References Tables Figures ◭ ◮ ◭ ◮ Back CloseFull Screen / Esc
Printer-friendly Version Interactive Discussion
EGU and net production falls. Surface deposition falls by about 6% with a 20% increase in
humidity, balancing the increased chemical loss, and the O3burden is reduced by 5%. The global O3 burden is much more sensitive to changes in humidity than in temper-ature, and the CH4 lifetime is also strongly affected. Note that the uncertainty in the tropospheric water vapour burden in current climate models is about 10% (Stevenson
5
et al.,2006), and this would introduce a 3% (9 Tg) variability in the O3 burden, a 3% (0.8 day) variability in O3lifetime and a 3% (0.3 year) variability in CH4lifetime based on these sensitivity studies..
Deep convection mixes O3-rich air from the upper troposphere down towards the surface where the O3 lifetime is shorter and lifts freshly-emitted O3 precursors into
10
the upper troposphere where O3 production may be greater. Previous studies with and without convection have disagreed on the relative importance of these pathways, withLawrence et al.(2003) finding a 12% increase in O3 burden when including con-vection due to the dominant effect of increased production, andDoherty et al.(2005) finding a 14% decrease in burden as greater descent and destruction outweighed
in-15
creased production. In the present study smaller changes in convection have been ap-plied, and these were allowed to affect convective washout as well as lifting processes. Stronger convection leads to increased O3 production in the upper troposphere but to decreased production in the lower troposphere, where the washout of soluble pre-cursors is greater. There is an increase in the inferred influx from the stratosphere,
20
indicating that convection penetrates above the tracer tropopause used here. Greater tropospheric overturning leads to higher surface O3 and greater deposition, and the tropospheric burden decreases. Comparison with the wet deposition sensitivity runs presented above suggests that this is partly due to increased washout, and that the effect of lifting alone is small. These results lie midway between those presented by
25
Lawrence et al. (2003) and Doherty et al.(2005), and highlight the large uncertainty in modelled O3 responses to convection. It is not clear if this uncertainty reflects dif-ferences in convection schemes, lightning emissions or chemical complexity, as dis-cussed inDoherty et al. (2005), but the uncertainty is sufficiently large that this topic
ACPD
7, 1995–2035, 2007 Sensitivities in modelling global tropospheric ozone O. Wild Title Page Abstract Introduction Conclusions References Tables Figures ◭ ◮ ◭ ◮ Back CloseFull Screen / Esc
Printer-friendly Version Interactive Discussion
EGU would be a valuable target for future model intercomparison studies.
The magnitude and distribution of lightning-produced NOx emissions are highly un-certain (e.g.,Price et al.,1997) but are important for O3 due to the longer lifetime of NOx in the upper troposphere and its greater efficiency for O3 production. Increased emissions cause a large increase in production and in tropospheric burden, as seen in
5
previous studies (Labrador et al.,2005); about 10% of the additional O3 produced is removed by deposition, and the rest is destroyed by chemistry, contributing to a higher abundance of OH and to a reduced CH4lifetime. The sensitivity of the O3burden and the CH4lifetime are notably larger than for the other processes considered here. The range of lightning emissions used in the ACCENT model studies, 3–8 TgN/yr, would
10
account for a 10% difference in O3 burden, a 0.7 day difference in O3 lifetime and a 1.4 year difference in CH4lifetime between models. Note also that the study here uses uniform vertical emission profiles for inter-cloud and cloud-to-ground lightning strokes based onPrice and Rind(1992). Inclusion of more realistic profiles based on observa-tions (Pickering et al.,1998) (run Alt5) leads to a 25% greater increase in O3production
15
and a 50% greater increase in burden for the same 5 TgN/yr emissions, as a greater proportion of the NOx emissions occur at high altitudes where the lifetimes of O3 and NOxare longer.
Finally, a number of additional sensitivities related to model methodology have been examined, see Table 4. The dry deposition scheme of Isaksen et al. (1985) used in
20
some studies (e.g., Berntsen et al., 1996; Wild and Prather, 2000; Zeng and Pyle, 2005) is a simpler alternative to the resistances-in-series scheme of Wesely (1989) used here. Application of this scheme with 1-m deposition velocities from Hough (1991) leads to 30% greater O3 deposition, an additional 260 Tg/yr. Faster removal of NOx suppresses production, but chemical destruction falls by a greater margin to
25
compensate for the increased deposition. The tropospheric O3 burden is almost 10% less than in the BASE run, and underestimation of the ozonesonde measurements sug-gest that the deposition rate with this scheme is too high. However, the lack of good observational constraints on deposition prevents this from being determined uniquely.
ACPD
7, 1995–2035, 2007 Sensitivities in modelling global tropospheric ozone O. Wild Title Page Abstract Introduction Conclusions References Tables Figures ◭ ◮ ◭ ◮ Back CloseFull Screen / Esc
Printer-friendly Version Interactive Discussion
EGU The deposition rate is also reduced by application of a non-local boundary layer mixing
scheme (Holtslag and Boville,1993) in place of the simple hourly bulk-mixing used in the BASE run. Less efficient vertical mixing leads to stronger near-surface gradients and reduced deposition of O3, but a smaller proportion of NOx escapes into the free troposphere, so chemical production is suppressed. The net effect of these changes
5
on the global burden is small, less than 1%.
A major source of uncertainty not considered here is in the calculation of photol-ysis rates. A number of different methods are currently used, ranging in complexity from tabulated rates based on climatological conditions to fully-interactive schemes accounting for absorption and scattering of aerosol and cloud particles calculated
on-10
line. A simple test removing all cloud cover in the interactive Fast-J scheme used here (Wild et al.,2000) indicates that the global budget of O3is relatively insensitive to cloud cover. However, global O3production at the surface is 15% higher without cloud cover, balanced by lower production in the upper troposphere, and regional and seasonal dif-ferences can be much larger. Tie et al.(2003) found larger global effects (as much as
15
8%) suggesting that the impacts may depend on details of the cloud scheme used. In-clusion of monthly-mean aerosol fields for the scattering code similarly lead to regional differences in O3production, but the global impacts appear to be small.
4.3 Sensitivity to meteorology and resolution
Differences in meteorological data may affect the O3 budget through self-consistent
20
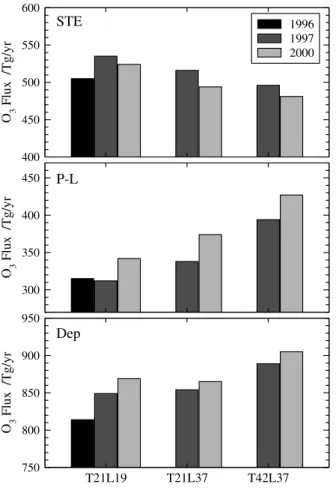
variations in the physical processes considered in Sect.4.2. Meteorological data from the ECMWF-IFS model for 1997 and 2000 are compared with the fields for 1996 used in this study, and the impact on the O3 budget is shown in Table5and in Fig. 4. The CTM is run at T21L19 with each meteorology, and is additionally run at T21L37 and T42L37 to test the effects of doubled vertical and horizontal resolution. Precursor
emis-25
sions are taken from IIASA for closer comparison with the ACCENT studies, and the same emissions are used for each year. Total lightning NOxemissions are constrained to 5 Tg/yr, although the location of the emissions differs from year to year following the
ACPD
7, 1995–2035, 2007 Sensitivities in modelling global tropospheric ozone O. Wild Title Page Abstract Introduction Conclusions References Tables Figures ◭ ◮ ◭ ◮ Back CloseFull Screen / Esc
Printer-friendly Version Interactive Discussion
EGU occurrence of deep convection events. Differences in O3burden and lifetime between
the different years are small, but differences in STE, deposition and chemistry reach 7–8%. The lifetime of CH4 is 5% longer in 1997 than in 2000, suggesting that OH levels are significantly lower and reflecting shifts in humidity and convection during the 1997–1998 El Ni ˜no period (Chandra et al.,1998;Sudo et al.,2001). The chemical
pro-5
duction of O3is lower in 1997, and influx from the stratosphere is greater. These results are in good qualitative agreement with those ofZeng and Pyle (2005) who examined the evolution of the O3 budget between 1990 and 2001 with a global climate model. The magnitude of this interannual variability indicates that model intercomparisons fo-cussed on differences due to chemical or dynamical schemes should recommend use
10
of the same meteorological fields.
Model O3budgets are sensitive to the horizontal and vertical resolution used, both through their effects on transport and mixing processes and through their impacts on O3 chemistry from the spatial averaging of emissions (e.g., Chatfield and Delany, 1990). At the highest resolution used here, T42L37, there is a significant reduction in
15
STE (8%, 40 Tg/yr) compared with T21L19 due to better resolution of the tropopause and there is an increase in surface deposition (5%, 40 Tg/yr). Increased net chemical production (25%, 80 Tg/yr) balances the budget, but there is a 2–4% drop in the O3 burden. The magnitude of these effects is highly consistent for 1997 and 2000 mete-orology, and confirms the results of previous studies (von Kuhlmann et al.,2003;Wild
20
and Prather,2006). The changes due to resolution seen here are similar in magnitude to those with different meteorological fields, but are systematic in nature. Increased vertical resolution has relatively little effect on gross chemical production or surface de-position, but accounts for at least half of the decrease in STE and for about one third of the increase in net production. Increased horizontal resolution dominates the changes
25
in deposition and gross chemical production due to better localisation of boundary layer O3, its production and convection, and better resolution of the tropopause region leads to an additional reduction in STE. Although the mean tropospheric lifetime of O3is only marginally affected by increased resolution, the chemical lifetime of CH4is substantially
ACPD
7, 1995–2035, 2007 Sensitivities in modelling global tropospheric ozone O. Wild Title Page Abstract Introduction Conclusions References Tables Figures ◭ ◮ ◭ ◮ Back CloseFull Screen / Esc
Printer-friendly Version Interactive Discussion
EGU increased, by as much as 5% for the 2000 case, reflecting lower OH and O3production
at higher resolution.
4.4 Examining inter-model variability
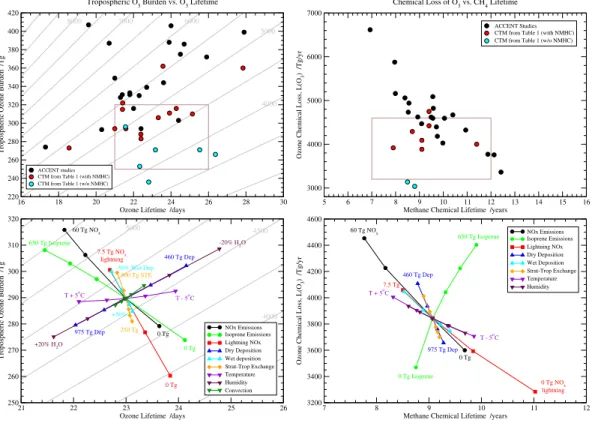
To what extent do the sensitivities examined here account for the variability in published model budgets seen in Table1? The results of these sensitivity studies and of earlier
5
published studies are shown in Fig. 5. The variability is examined in two different parameter spaces which summarize the fate of O3and the abundance of OH, following Stevenson et al. (2006). Results from published model studies and from individual models from the ACCENT model intercomparison are shown in Figs. 5a and b, and results from the sensitivity studies over part of these parameter spaces are shown
10
in Figs. 5c and d. The sensitivities examined here do not reflect the same level of uncertainty in the different variables, but are intended to be loosely comparable so that the relative importance of different processes is evident.
Differences in the abundance and fate of O3are revealed by the relationship between the tropospheric burden and the lifetime of O3 to chemical removal and deposition
15
and are shown in Fig.5a. Inclusion of hydrocarbon chemistry and increased surface emissions lead to higher burdens and shorter lifetimes, but cannot account for the large spread in lifetime and burden seen in the ACCENT studies where emissions varied little. Figure5c suggests that differences in humidity and in surface deposition may make important contributions to this variation, as they affect the O3 burden and
20
lifetime without changing gross tropospheric removal significantly. A 10% variation in humidity and a 200 Tg/yr variation in dry deposition, as seen in the ACCENT studies (Stevenson et al., 2006), could each account for 9 Tg in O3 burden and 1 day in O3 lifetime. Variations in temperature and convection have a similar but smaller effect. Wet deposition and STE lead to changes in the gross removal of O3, but the scatter
25
in this dimension is strongly influenced by emissions. Lightning NOxemissions varied between 3 and 8 Tg/yr for the ACCENT models and may account for 30 Tg in O3burden and 500 Tg/yr in O3removal. Isoprene emissions varied between 220 and 630 TgC/yr,
ACPD
7, 1995–2035, 2007 Sensitivities in modelling global tropospheric ozone O. Wild Title Page Abstract Introduction Conclusions References Tables Figures ◭ ◮ ◭ ◮ Back CloseFull Screen / Esc
Printer-friendly Version Interactive Discussion
EGU and may thus account for 20 Tg in O3 burden and 650 Tg/yr in O3removal. However,
the sensitivity studies performed here only account for a proportion of the variability seen in the ACCENT runs, and it is likely that differences in chemical mechanisms and model dynamics also make large contributions to this variability.
The relationship between the chemical loss of O3, governing the source of OH, and
5
the lifetime of CH4, controlled by OH, is shown in Fig.5b. The variability in this rela-tionship is more restricted, and most points lie close to a single line, as processes that increase O3 production and loss are associated with a higher level of OH and hence with a shorter CH4lifetime. Surface emissions of isoprene have a significantly different effect, however, as greater OH formation from higher O3 production and loss is
out-10
weighed by the direct removal of OH that initiates hydrocarbon oxidation, and thus CH4 lifetime increases with higher isoprene emissions as other studies have noted (von Kuhlmann et al., 2004). Model studies omitting higher hydrocarbons underestimate both O3 loss and CH4lifetime. The mean chemical lifetime of CH4 from the ACCENT studies is 9.8 years, close to the 9.6 years recommended byPrather and Ehhalt(2001),
15
but the variability is large, 6.9–15.2 years. The variation in lightning emissions may ac-count for almost 1.5 years in the CH4lifetime, but differences in temperature, humidity, wet and dry deposition, and STE also contribute significantly to this variability. The abundance of OH is very sensitive to the chemistry and photolysis schemes used, factors which are not quantified in this study. However, determination of the climate
20
impacts of CH4and other tracer gases depends on a reliable quantification of chemical removal by OH, and the large variability seen in the ACCENT studies suggests that further work is needed to reduce the uncertainty in current models.
To estimate the contribution of the processes examined here to the variability in the budget terms from the ACCENT intercomparison, the terms are standardized by
ap-25
plying correction factors based on the sensitivities derived with the FRSGC/UCI CTM, see Table6. A sensitivity factor for the change in each of these budget terms with re-spect to STE, dry deposition, lightning and surface emissions is derived from Table4, and a correction factor is then applied for each model by scaling the fractional
devia-ACPD
7, 1995–2035, 2007 Sensitivities in modelling global tropospheric ozone O. Wild Title Page Abstract Introduction Conclusions References Tables Figures ◭ ◮ ◭ ◮ Back CloseFull Screen / Esc
Printer-friendly Version Interactive Discussion
EGU tion from the ensemble mean by the respective sensitivity factor. The mean production
and loss terms decrease marginally, but the variability is significantly reduced, by more than 100 Tg/yr for production and 200 Tg/yr for loss, and the difference between the outlying models is reduced by almost 40%. The largest contributions to this reduced variability in production come from standardizing the isoprene emissions and lightning
5
NOx, while for loss the greatest impact is from standardizing deposition. The 1σ vari-ability in the CH4lifetime is reduced by about 25%, from 1.7 to 1.3 years, and lightning NOx emissions make the largest contribution to this. Although this standardization is approximate, it demonstrates that the biases imposed by the treatment of these pro-cesses are systematic, and that the differences between models would be reduced in
10
more tightly constrained studies.
5 Conclusions
This study has examined how the tropospheric O3 budget calculated in global CTMs has evolved over the past decade and has explored the sensitivity of the key bud-get terms to variability in precursor emissions, physical processes and meteorology.
15
Large differences apparent in early CTM studies reflect overestimation of stratosphere-troposphere exchange and omission of hydrocarbon chemistry. The increases in O3 production and tropospheric burden in more recent studies are principally due to use of higher surface emissions of NOx and isoprene. Increases in these emissions alone lead to an increase in O3production of 1100 Tg/yr in the FRSGC/UCI CTM, accounting
20
for about 66% of the increase in production seen between the IPCC-TAR and ACCENT studies. Recent analysis by Wu et al. (2006) has shown similar results. Compari-son with ozoneCompari-sonde measurements suggests that precursor emissions used in earlier studies were too low, and that O3distributions are reproduced better with recent IIASA emissions data.
25
The burden of O3 in the troposphere in CTMs has increased from around 300 Tg to around 340 Tg following the increase in precursor emissions, but is strongly
influ-ACPD
7, 1995–2035, 2007 Sensitivities in modelling global tropospheric ozone O. Wild Title Page Abstract Introduction Conclusions References Tables Figures ◭ ◮ ◭ ◮ Back CloseFull Screen / Esc
Printer-friendly Version Interactive Discussion
EGU enced by the tropopause definition used. Comparison of three O3 climatologies with
seven different tropopause definitions suggests that as much as ±15% of the variability in the burden may be due to the choice of tropopause. Recent model assessments have recommended use of an O3 tracer tropopause of 150 ppb (Prather and Ehhalt, 2001), and this gives a tropospheric burden of 335±10 Tg based on the measurement
5
climatologies used here. The mean burden from the ACCENT model intercomparison is 344 Tg, close to this value, but the 1σ variability remains large, 39 Tg, even with con-sistent use of the 150 ppb O3tracer tropopause, highlighting substantial differences in O3distribution between the models.
Sensitivity studies have been performed to examine how differences in key model
10
processes might account for the difference in O3 budget terms seen in the relatively well-constrained ACCENT model intercomparison. The magnitude and vertical distri-bution of lightning NOxemissions is shown to be a major source of uncertainty, and the 3–8 TgN/yr range in ACCENT study may account for a 10% difference in tropospheric ozone burden and a 1.4 year difference in CH4 lifetime. Processes affecting the O3
15
distribution, such as dry deposition, STE, and convection, and those affecting chemi-cal production and loss, such as temperature, humidity, photolysis and wet removal of precursors, also have an important role and may account for much of the year-to-year variability in the budgets of O3and CH4. The uncertainty in these processes is not well characterised, but dry deposition, STE and surface and lightning emissions account for
20
about 25% of the model variability in the ACCENT intercomparison. The large spread in CH4lifetime suggests that the climate response of changes in O3precursors in cur-rent models may differ substantially. Tighter constraints on lightning NOx emissions and meteorological fields would allow future model intercomparisons to focus more closely on the impacts of different chemistry schemes and different parameterizations
25
of convection and mixing which are difficult to discern from recent studies.
Further development of CTMs with greater chemical detail, better treatment of scav-enging and aerosol processes and finer resolution of small-scale processes is expected to lead to refinement of the O3budget terms explored here. As improved
parameteri-ACPD
7, 1995–2035, 2007 Sensitivities in modelling global tropospheric ozone O. Wild Title Page Abstract Introduction Conclusions References Tables Figures ◭ ◮ ◭ ◮ Back CloseFull Screen / Esc
Printer-friendly Version Interactive Discussion
EGU zations of the key processes become available, widely-differing models should start to
converge on the same budget terms, with differences driven only by interannual vari-ability in meteorology and emissions. Tightly-constrained model intercomparisons will continue to be valuable in identifying those areas where significant differences exist between models, and should ultimately allow a more rigorous quantification of
uncer-5
tainty in the key budget terms. Important targets for future intercomparisons should be the distribution and speciation of NOyand the treatment of oxygenated VOCs, both of which have been implicated in the ACCENT studies as major sources of uncertainty (Dentener et al., 2006b; Shindell et al., 2006). Observational constraints on the key terms in the O3budget remain very poor, and improved estimates based on satellite or
10
in-situ measurements would be valuable.
Acknowledgements. The author is grateful for discussions with D. Jacob (Harvard) and
D. Stevenson (University of Edinburgh) which initiated this work, and would like to thank all those who contributed to the ACCENT model intercomparison. The study was supported by the Frontier Research Center for Global Change of the Japan Agency for Marine-Earth Science 15
and Technology (JAMSTEC), Japan, and by the NERC QUEST project in the UK.
References
Berntsen, T., Isaksen, I. S. A., Wang, W.-C., and Liang, X.-Z.: Impacts of increased anthro-pogenic emissions in Asia on tropospheric ozone and climate. A global 3-D model study, Tellus, 48B, 13–32, 1996. 2011,2025
20
Bethan, S., Vaughan, G., and Reid, S. J.: A comparison of ozone and thermal tropopause heights and the impact of tropopause definition on quantifying the ozone content of the tro-posphere, Q. J. R. Meteorol. Soc., 122, 929–944, 1996. 2002
Bey, I., Jacob, D. J., Yantosca, R. M., et al.: Global modelling of tropospheric chemistry with assimilated meteorology: Model description and evaluation, J. Geophys. Res., 106(D19), 25
23 073–23 095, 2001. 2025
Chandra, S., Ziemke, J. R., Min, W., and Read, W. G.: Effects of 1997–1998 El Ni ˜no on tropo-spheric ozone and water vapor, Geophys. Res. Lett., 25, 3867–3870, 1998. 2013
ACPD
7, 1995–2035, 2007 Sensitivities in modelling global tropospheric ozone O. Wild Title Page Abstract Introduction Conclusions References Tables Figures ◭ ◮ ◭ ◮ Back CloseFull Screen / Esc
Printer-friendly Version Interactive Discussion
EGU
Chatfield, R. B. and Delany, A. C.: Convection links biomass burning to increased tropical ozone: However, models will tend to overpredict O3, J. Geophys. Res., 95, 18 473–18 488, 1990. 2013
Crutzen, P. J., Lawrence, M. G., and P ¨oschl, U.: On the background photochemistry of tropo-spheric ozone, Tellus, 51A-B, 123–146, 1999.2025
5
Dentener, F., Stevenson, D., Cofala, J., Mechler, R., Amann, M., Bergamaschi, P., Raes, F., and Derwent, R.: The impact of air pollutant and methane emission controls on tropospheric ozone and radiative forcing: CTM calculations for the period 1990–2030, Atmos. Chem. Phys., 5, 1731–1755, 2005,
http://www.atmos-chem-phys.net/5/1731/2005/. 2004,2007 10
Dentener, F., Stevenson, D., Ellingsen, K., et al.: The global atmospheric environment for the next generation, Environ. Sci. Technol., 40, 3586–3594, doi:10.1021/es0523845, 2006a. 1998,2000
Dentener, F., Drevet, J., Lamarque, J. F., et al.: Nitrogen and sulfur deposition on regional and global scales: A multi-model evaluation, Global Biogeochem. Cycles, 20, GB2020, 15
doi:10.1029/2005GB002672, 2006b. 2018
Doherty, R. M., Stevenson, D. S., Collins, W. J., and Sanderson, M. G.: Influence of convective transport on tropospheric ozone and its precursors in a chemistry-climate model, Atmos. Chem. Phys., 5, 3205–3218, 2005,
http://www.atmos-chem-phys.net/5/3205/2005/. 2003,2010 20
Fiore, A. M., Horowitz, L. W., Dlugokencky, E. J., and West, J. J.: Impact of meteorol-ogy and emissions on methane trends, 1990–2004, Geophys. Res. Lett., 33, L12809, doi:10.1029/2006GL026199, 2006. 2009
Fortuin, J. P. F. and Kelder, H.: An ozone climatology based on ozonesonde and satellite mea-surements, J. Geophys. Res., 103, 31 709–31 734, 1998.2005,2026
25
Gauss, M., Myhre, G., Pitari, G., et al.: Radiative forcing in the 21st century due to ozone changes in the troposphere and lower stratosphere, J. Geophys. Res., 108, 4292, doi:10.1029/2002JD002624, 2003. 1998
Gettelman, A., Holton, J. R., and Rosenlof, K. H.: Mass fluxes of O3, CH4, N2O and CF2Cl2in the lower stratosphere calculated from observational data, J. Geophys. Res., 102, 19 149– 30
19 159, 1997.2001
Guenther, A., Hewitt, C. N., Erickson, D., et al.: A global model of natural volatile organic compound emissions, J. Geophys. Res., 100, 8873–8892, 1995.2004,2007
ACPD
7, 1995–2035, 2007 Sensitivities in modelling global tropospheric ozone O. Wild Title Page Abstract Introduction Conclusions References Tables Figures ◭ ◮ ◭ ◮ Back CloseFull Screen / Esc
Printer-friendly Version Interactive Discussion
EGU
Hauglustaine, D. A., Brasseur, G. P., Walters, S., Rasch, P. J., M ¨uller, J.-F., Emmons, L. K., and Carroll, M. A.: MOZART, a global chemical transport model for ozone and related chemical tracers: 2. Model results and evaluation, J. Geophys. Res., 103, 28 291–28 335, 1998.2004, 2025
Hauglustaine, D. A., Hourdin, F., Jourdain, L., Filiberti, M.-A., Walters, S., Lamarque, J.-F., 5
and Holland, E. A.: Interactive chemistry in the Laboratoire de M ´et ´eorologie Dynamique general circulation model: Description and background tropospheric chemistry evaluation, J. Geophys. Res., 109, D04314, doi:10.1029/2003JD003957, 2004. 2025
Holloway, T., Fiore, A. M., and Galanter-Hastings, M.: Intercontinental transport of air pollution: Will emerging science lead to a new hemispheric treaty?, Environ. Sci. Technol., 37, 4535– 10
4542, 2003. 1998
Holtslag, A. A. M. and Boville, B. A.: Local versus nonlocal boundary layer diffusion in a global climate model, J. Clim., 6, 1825–1842, 1993. 2012
Horowitz, L. W., Walters, S., Mauzerall, D. L., et al.: A global simulation of tropospheric ozone and related tracers: Description and evaluation of MOZART, version 2, J. Geophys. Res., 15
108(D24), 4784, doi:10.1029/2002JD002853, 2003. 2025
Hough, A. M.: Development of a two-dimensional global tropospheric model: Model chemistry, J. Geophys. Res., 96, 7325–7362, 1991. 2011
Houweling, S., Dentener, F., and Lelieveld, J.: The impact of non-methane hydrocarbon com-pounds on tropospheric photochemistry, J. Geophys. Res., 103, 10 673–10 696, 1998.2003, 20
2007,2025
Isaksen, I. S. A., Hov, Ø., Penkett, S. A., and Semb, A.: Model analysis of the measured concentration of organic gases in the Norwegian Arctic, J. Atmos. Chem., 3, 3–27, 1985. 2011
Labrador, L. J., von Kuhlmann, R., and Lawrence, M. G.: The effects of lightning-produced NOx
25
and its vertical distribution on atmospheric chemistry: sensitivity simulations with MATCH-MPIC, Atmos. Chem. Phys., 5, 1815–1834, 2005,
http://www.atmos-chem-phys.net/5/1815/2005/. 2003,2011
Lawrence, M. G., Crutzen, P. J., Rasch, P. J., Eaton, B. E., and Mahowald, N. M.: A model for studies of tropospheric photochemistry: description, global distributions and evaluation, J. 30
Geophys. Res., 104, 26 245–26 277, 1999.2025
Lawrence, M. G., von Kuhlmann, R., and Salzmann, M.: The balance of effects of deep convec-tive mixing on tropospheric ozone, Geophys. Res. Lett., 30, 18, doi:10.1029/2003GL017644,
ACPD
7, 1995–2035, 2007 Sensitivities in modelling global tropospheric ozone O. Wild Title Page Abstract Introduction Conclusions References Tables Figures ◭ ◮ ◭ ◮ Back CloseFull Screen / Esc
Printer-friendly Version Interactive Discussion
EGU
2003. 2003,2010
Lelieveld, J. and Dentener, F. J.: What controls tropospheric ozone? J. Geophys. Res., 105, 3531–3551, 2000. 2025
Lelieveld, J. and van Dorland, R.: Ozone chemistry changes in the troposphere and consequent radiative forcing of climate, in Atmospheric Ozone as a Climate Gas, W.C. Wang and I.S.A. 5
Isaksen (eds.), NATO ASI Series I, Vol 32, Springer-Verlag, Berlin, 1995. 2025
Levy II, H., Kasibhatla, P. S., Moxim, W. J., Klonecki, A. A., Hirsch, A. I., Oltmans, S. J., and Chameides, W. L.: The global impact of human activity on tropospheric ozone, Geophys. Res. Lett., 24, 791–794, 1997. 2025
Li, D. and Shine, K. P.: A 4-Dimensional Ozone Climatology for UGAMP Models, UGAMP 10
Internal Report No. 35, April 1995. 2026
Logan, J. A.: An analysis of ozonesonde data for the troposphere: Recommendations for testing 3-D models, and development of a gridded climatology for tropospheric ozone, J. Geophys. Res., 104, 16 115–16 149, 1999.2004,2026,2032
Mallet, V. and Sportisse, B.: Uncertainty in a chemistry-transport model due to physical pa-15
rameterizations and numerical approximations: An ensemble approach applied to ozone modeling, J. Geophys. Res., 111, D01302, doi:10.1029/2005JD006149, 2006.2003
McLinden, C. A., Olsen, S., Hannegan, B., Wild, O., Prather, M. J., and Sundet, J.: Strato-spheric ozone in 3-D models: A simple chemistry and the cross-tropopause flux, J. Geophys. Res., 105, 14 653–14 665, 2000. 2001,2004
20
Mickley, L. J., Murti, P. P., Jacob, D. J., Logan, J. A., Rind, D., and Koch, D.: Radiative forc-ing from tropospheric ozone calculated with a unified chemistry-climate model, J. Geophys. Res., 104, 30 153–30 172, 1999. 2025
M ¨uller, J.-F. and Brasseur, G.: IMAGES: A three-dimensional chemical transport model of the global troposphere, J. Geophys. Res., 100(D8), 16 445–16 490, 1995.2025
25
Murphy, D. M. and Fahey, D. W.: An estimate of the flux of stratospheric reactive nitrogen and ozone into the troposphere, J. Geophys. Res., 99, 5325–5332, 1994.2001
Olivier, J. G. J. and Berdowski, J. J. M.: Global emissions sources and sinks, in The Climate System, edited by J. J. M. Berdowski, R. Guicherit and B. J. Heij, pp 33–78, A. A. Balkemer Publishers, Lisse, The Netherlands. 2004
30
Olivier, J. G. J., Bouwman, A. F., van der Maas, C. W. M., et al.: Description of EDGAR Version 2.0, RIVM/TNO report 771060 002, RIVM, Bilthoven, December 1996.2004
![[PDF] Apprendre la programmation Android avec base de données - Free PDF Download](data:image/gif;base64,R0lGODlhAQABAIAAAP///wAAACH5BAEAAAAALAAAAAABAAEAAAICRAEAOw==)