HAL Id: insu-01187067
https://hal-insu.archives-ouvertes.fr/insu-01187067
Submitted on 26 Aug 2015HAL is a multi-disciplinary open access
archive for the deposit and dissemination of sci-entific research documents, whether they are pub-lished or not. The documents may come from teaching and research institutions in France or abroad, or from public or private research centers.
L’archive ouverte pluridisciplinaire HAL, est destinée au dépôt et à la diffusion de documents scientifiques de niveau recherche, publiés ou non, émanant des établissements d’enseignement et de recherche français ou étrangers, des laboratoires publics ou privés.
Thiol groups controls on arsenite binding by organic
matter: New experimental and modeling evidence
Charlotte Catrouillet, Mélanie Davranche, Aline Dia, Martine Bouhnik-Le
Coz, Mathieu Pédrot, Rémi Marsac, Gérard Gruau
To cite this version:
Charlotte Catrouillet, Mélanie Davranche, Aline Dia, Martine Bouhnik-Le Coz, Mathieu Pédrot, et al.. Thiol groups controls on arsenite binding by organic matter: New experimental and modeling evidence. Journal of Colloid and Interface Science, Elsevier, 2015, 460, pp.310-320. �10.1016/j.jcis.2015.08.045�. �insu-01187067�
1
Thiol groups controls on arsenite binding by organic matter:
new experimental and modeling evidence
Charlotte Catrouilleta*, Mélanie Davranchea, Aline Diaa, Martine Bouhnik-Le Coza, Mathieu Pédrota, Rémi Marsacb, Gérard Gruaua
a
Géosciences Rennes UMR 6118, Université Rennes 1, CNRS, 35042 Rennes cedex, France
b
Ecole Nationale Supérieure de Chimie de Rennes, 135708 Rennes cedex 7, France * Corresponding author: [email protected], +33 (0)2 23 23 54 58
Keywords: Arsenic(III), humic substances, thiol, binding, sorption, PHREEQC-Model VI,
PHREEPLOT
ABSTRACT
Although it has been suggested that several mechanisms can describe the direct binding of
As(III) to organic matter (OM), more recently, the thiol functional group of humic acid (HA)
was shown to be an important potential binding site for As(III). Isotherm experiments on
As(III) sorption to HAs, that have either been grafted with thiol or not, were thus conducted to
investigate the preferential As(III) binding sites. There was a low level of binding of As(III) to
HA, which was strongly dependent on the abundance of the thiols. Experimental datasets
were used to develop a new model (the modified PHREEQC-Model VI), which defines HA as
a group of discrete carboxylic, phenolic and thiol sites. Protonation/deprotonation constants
were determined for each group of sites (pKA = 4.28 ± 0.03; ΔpKA = 2.13 ± 0.10; pKB = 7.11 ±
0.26; ΔpKB = 3.52 ± 0.49; pKS = 5.82 ± 0.052; ΔpKS = 6.12 ± 0.12 for the carboxylic, phenolic
and thiols sites, respectively) from HAs that were either grafted with thiol or not. The pKS
value corresponds to that of single thiol-containing organic ligands. Two binding models were
tested: the Mono model, which considered that As(III) is bound to the HA thiol site as
monodentate complexes, and the Tri model, which considered that As(III) is bound as
2
the Mono model, with log KMS = 2.91 ± 0.04, i.e. the monodentate hypothesis. This study
highlighted the importance of thiol groups in OM reactivity and, notably, determined the
As(III) concentration bound to OM (considering that Fe is lacking or at least negligible) and
was used to develop a model that is able to determine the As(III) concentrations bound to
OM.
1 Introduction
According to the World Health Organization (WHO), arsenic (As) is known to be a
major poison in the world. Even at low concentrations, As causes serious damage to human
health such as cutaneous lesions (black foot disease), cancers (skin, lung, bladder, etc.),
cardiovascular diseases, respiratory problems, etc. The main contamination process occurs
through the consumption of As-contaminated water and the ingestion of contaminated crops
(such as rice). Arsenic-contaminated water affects millions of people in Argentina,
Bangladesh, Chili, China, United States, India, Mexico, etc. The abundance of As in the soil
and water primarily depends on the geology and human activity (historic or current). As(III) is
the most toxic inorganic form. Many studies have been performed to understand the
mechanisms responsible for the contamination of water by As [1–5]. Wetlands and floodplains have been highlighted as a source of As for the surrounding environments [6–8]. Arsenic-rich sediments, in which As is bound to Fe-oxyhydroxides, are deposited in riparian
wetlands and floodplains during flooding events. In the anoxic, organic-rich environments
that characterize these zones, Fe-oxyhydroxides are reductively dissolved and the
associated As is released into the soil solutions, and are then available for transfer in the
underlying aquifers. However, there is a lack of information regarding the fate of As in this
type of Fe(II), OM-rich solution. In such environments, OM is often discussed as a source of
carbon for the heterotrophic bacteria able to reductively dissolve Fe-oxyhydroxides and
solubilize the associated elements, such as As, or to directly reduce As(V) to As(III) in their
detoxification metabolism [9–13]. Organic matter is also shown to be a competitor of anions, such as arsenite, for their binding to the functional sites of Fe-oxyhydroxides [4,14–16].
3
Several studies present OM as a possible ligand for As(III), but no consensus exists about
the nature of the exact direct or indirect mechanisms involved. Thanabalasingam and
Pickering and Warwick et al. proposed that As(III) is bound to humic acid (HA) through
cationic bridges involving Al, Fe and Ca impurities occurring in HA or by direct binding
through HA amino groups [17,18]. Using Suwannee River HA (SRHA), Buschmann et al. and
Lenoble et al. hypothesized that As(III) could be bound to HA through its carboxyl and
phenolic functional groups [19,20]. Alcohols are able to bind As(III) by losing an OH- [21],
suggesting that As(III) could be bound to phenolic groups of OM. Regarding the weaker and
more abundant carboxylic groups, Buschmann et al. suggested that binding could occur
through the formation of H-bridges between the OH- group of As(OH)3 and the =O part of the
group without any OH loss. In their study, these authors also proposed that Fe might act as a
bridge between As(III) and HA [19]. Liu and Cai and Fakour and Lin, through experimental
and modeling approaches, hypothesized that As(III) was bound to HA by two kinds of binding
sites, one strong and one weak [22,23].
More recently, spectroscopic and experimental studies have suggested that thiol (SH
-) could play an important role in As(III-) binding to peat and HA [24,25]. These authors
demonstrated that As(III) is bound to tridentate or monodentate complexes via thiol groups,
depending on the selected peat and HA. By spiking HA and peat with bisulfides, Hoffmann et
al. showed that As(III) binding increased with increasing bisulfide concentrations [25]. Using
EXAFS, they provided evidence of the formation of a monodentate thiol-As(III) complex on
S(-II)-spiked HA and peat. Conversely, Langner et al. used EXAFS data to show that As(III)
is bound to three S in peat from Gola di Lago (Switzerland) [24]. The different complexes
might be explained by differences in the origin of the organic matter (OM). In the Gola di
Lago peatland, peat was formed in an As-enriched environmental context. Arsenic was
absorbed by plants and/or microorganisms, which were the precursors of the peat. In these
precursors, As was bound to proteins, enzymes, etc., mainly as tridentate complexes with
the SH- group of cystein; a configuration that seems to be conserved in the peat structure
4
dithiol and trithiol sites in many proteins and peptides [26–33], either completely or partly inhibiting their specific actions in the body.
Here, we present a new contribution to evaluate the role of thiol sites in the binding of
As(III) to OM. More specifically, considering the recent spectroscopic studies, we tried to
determine the mechanisms of complexation between As(III) and the thiol groups in HA (the
formation of mono- or tridentate complexes), using experimental and modeling approaches.
Arsenic(III) was reacted with three samples of HA containing different concentrations of thiol
sites. The experimental dataset was subsequently used to test the hypothesis of As(III)-HA
binding through mono or tridentate complexes via HA thiol groups, using a combination of
the PHREEPLOT (fitting program) and PHREEQC-Model VI programs. No model is currently
available in the literature to describe the interactions between As(III) and organic matter. In a
first step, the thiol groups had to be described and their binding parameter was introduced in
PHREEQC-Model VI. Finally, the extrapolated binding parameters from the hypothesis of
mono- or tridentate As(III)-thiol (HA) complexes were tested using the whole datasets
available in the literature to identify the more valuable binding mechanisms. The goal of the
model developed in the present study is to determine the speciation of As(III) in OM-rich
water.
2 Experimental, analytical and modeling methods
2.1 Reagents and materials
All aqueous solutions were prepared with analytical grade Milli-Q water (Millipore).
The As(III) solutions were prepared with sodium arsenite (NaAsO2) from Sigma Aldrich. The
S(-II) solution was prepared with sodium sulfide nonahydrate (Na2S.9H2O) from Sigma
Aldrich. NaOH, HCl and HNO3, all sub-boiling ultrapure grade, came from Fisher Chemical,
Merck and VWR, respectively.
Humic acids corresponded to the standard HA purified Leonardite from the
International Humic Substance Society (IHSS) and the Aldrich HA (AHA) from Sigma Aldrich,
5
AHA was purified (PAHA) using the method described by Vermeer et al. [34]. Prior to the
experiments, molecules < 10 kDa were removed using a Labscale TFF system equipped with
a Pellicon XL membrane (PGCGC10, MilliporeTM) for the two standard solutions used
(Leonardite and AHA).
All materials were soaked in 10% HNO3 and then rinsed with deionized water twice
overnight.
2.2 Experimental setup
Thiol grafting experiment. To obtain HA with different concentrations of thiol groups
(S(-II)), S(-II) were sorbed to Leonardite using a dialysis bag (pore size = 12-14 kDa) at a
ratio [S(-II)]/[DOC] ≈ 6 mmolS/molC, as was done previously in a precedent study [25]. No grafting was performed for PAHA because of its natural high concentration in S. Humic acids
and the S(-II) solutions were placed inside the membrane, whereas S(-II) was outside. The
pH was maintained at 6 and the ionic strength (IS) was fixed at 0.05 M with NaCl. The
Leonardite grafted with thiol groups will be noted S(-II)-Leonardite hereafter. To prevent any
oxidation of S(-II), the experiments were performed in a Jacomex isolator glove box. The
concentration of S(-II) outside of the membrane was monitored using an ionometric method.
Ten mL of solution was sampled and mixed with SAOB (Sulphide AntiOxidant Buffer) at a 1:1
ratio. The concentration of S(-II) was measured outside of the glove box using a sulfide
combined electrode (9616BNWP from Thermo Scientific). The grafting experiment continued
until all S(-II) had disappeared from the solution outside of the membrane.
Humic acid titrations. Acid-base potentiometric titrations of the Leonardite and
S(-II)-Leonardite were performed using an automatic pH stat titrator (Titrino 194, Metrohm)
equipped with burettes of 0.1 M NaOH and HCl solutions. The detailed method is described
elsewhere [35]. Fifty mL of 1 g L-1(DOC) was titrated at two IS, 0.001 and 0.01 M NaCl with
0.1 M of the NaOH and HCl solutions. Because the addition of NaOH/HCl continuously
modified the IS, this latter was re-calculated for each titration point and used to calculate the
6
were continuously bubbled with nitrogen (N2). To prevent any hysteresis, three titrations were
performed, one after another. Only the second titration was used for the modeling
calculations. The HA charge was calculated as follows:
Q = [Acid] - [Base] - ([H+]-[OH-]) (Eq. 1)
with [Acid], [Base], [H+] and [OH-] equal to the concentration of HCl and NaOH added, and
where free H+ is calculated as and free OH- is calculated as .
As(III)-HA binding experiments. A standard batch equilibrium method was used.
Three adsorption isotherm experiments were carried out with 5 to 50 µg L-1 of As(III) and
55.76, 50.12 and 56.02 mg L-1 of average dissolved organic carbon (DOC) for Leonardite,
S(-II)-Leonardite and PAHA, respectively. To ensure anoxic conditions, experiments were
performed in a Jacomex isolator glove box. The pH was fixed at 6 with ultrapure HCl and
NaOH. The pH was monitored with a multi-parameter Consort C830 analyzer equipped with
a combined electrode from Bioblock Scientific (combined Mettler InLab electrode).
Calibrations were performed with WTW standard solutions (pH = 4.01 and 7.00 at 25°C). The
accuracy of the pH measurements was ± 0.05 pH units. The [As(III)]tot, pH and DOC values
used in these experiments corresponded to values that can be encountered in reduced
wetland water [4,36]. The IS of all experiments was fixed at 0.05 M with NaCl electrolyte
solution. Experimental solutions were stirred for 48h to reach equilibrium (determined from
preliminary kinetic experiments). Then, 15 mL of solution was sampled and ultrafiltrated at 5
kDa (Vivaspin VS15RH12, Sartorius) by centrifugation at 2970 g for 30 min under N2
atmosphere. Ultracentrifugation cells were previously washed with Milli-Q water to obtain a
DOC concentration < 1 mg L-1 in the ulltrafiltrate. Each isotherm experiment was conducted
in triplicate.
2.3 Chemical analyses
All measurements were performed at Géosciences Rennes, University of Rennes I,
France. DOC concentrations were determined using an organic carbon analyzer (Shimadzu
7
samples using a standard solution of potassium hydrogen phtalate. Arsenic concentrations
were determined by ICP-MS using an Agilent Technologies 7700x at Géosciences Rennes.
All samples were previously digested twice with 14.6 N HNO3 and H2O2 ultra-pure grade at
90°C, then evaporated to complete dryness and finally resolubilized with HNO3 at 0.37 mol L
-1 to avoid any interference with DOC during the analysis. ICP-MS analyses were carried out
using a He gas collision cell to reduce the 40Ar35Cl/75As ratio, allowing a low detection limit to
be reached for the As analysis (LD As: 0.003 µg L-1). Instrumental and data acquisition
parameters can be found in the supporting information SI 1. Quantitative analyses were
performed using a conventional external calibration procedure (seven external standard
multi-element solutions - Inorganic Venture, USA). A mixed solution of rhodium-rhenium at
300 ppb was used as an internal standard for all measured samples to correct any
instrumental drift and matrix effects. Calibration curves were calculated from the intensity
ratios between the internal standard and the analyzed elements. A SLRS-5 water standard
was used to check the accuracy of the measurement procedure, and the instrumental error
on the As analysis was established as below 5%. Chemical blanks of As were below the
detection limit (0.003 µg L-1), and were thus considered as negligible.
To ensure that no oxidation occurred during the experiments, the concentrations of
As(III) and As(V) were checked. The As species were separated and the As(III)
concentrations were determined in the ultrafiltrate ([As(III)]UF) through High Performance
Liquid Chromatography (HPLC-Agilent 1260 Infinity) equipped with an anion exchange resin
column (Agilent G3154-65001) coupled with ICP-MS. Quantitative analyses were performed
using an injection of mixed standard solutions As(III, V) (Inorganic venture, USA) to
determine the calibration curves. The total As concentrations in the mixed As(III)-HA
solutions were only measured by ICP-MS using the above described procedure (with no
estimation of the speciation). The HPLC column retains OM, which prevents any quantitative
measurement of As(III) in this fraction from being taken. The accuracy of the [As(III)]UF and
[As(III)]tot measurements was estimated at less than 5% above a concentration of As(III) of 1
8
inorganic As(III), whereas As(III) bound to HA (As(III)-HA) was considered to be in the
retentate fraction > 5 kDa. The fraction of As(III) bound to HA ([As(III)-HA]) was calculated as
[As(III)-HA] = [As(III)]tot - [As(III)]UF, with [As(III)]tot, the As concentration in the HA-As(III)
solutions prior to ultrafiltration and [As(III)]UF, the As concentration in the ultrafiltrate as
determined with the ICP-MS.
The amounts of S and organic C in Leonardite and S(-II)-Leonardite and PAHA were
determined at the "Laboratoire d'analyses des Sols d'Arras" (INRA, Arras, France) by dry
combustion (ISO 10694) and ICP-AES (ISO 22036), respectively.
2.4 Determination of the PHREEQC-Model VI binding parameters
2.4.1 Thiol implementation in PHREEQC-Model VI and the models used
A new model was developed to implement the thiol groups in PHREEQC-Model VI.
PHREEQC-Model VI described humic substances as a set of discrete functional sites that
can be divided into groups of weak and strong sites [37]. Weak sites are usually assumed to
be carboxyl groups, whereas strong sites are generally assumed to consist of phenolic and
N-containing sites. In the original Model VI, the binding of metals by humic substances
occurs through eight discrete sites: four weak sites, named A sites and four strong sites,
named B sites. In the present study, to implement the thiol group, we added four thiol groups,
named S sites. The abundances of the type A, B and S sites are named nA, nB and nS (mol g
-1), respectively. The intrinsic proton dissociation constants for the type A, B and S sites and
their distribution terms are pKA, pKB, pKS, ΔpKA, ΔpKB and ΔpKS, respectively. The fractions
of sites that can make bidentate sites and tridentate sites are named fB and fT and are equal
to 0.5 and 0.065, respectively [37]. The abundances calculated for the 84 sites
(monodentates, bidentates and tridentates) are given in supporting information SI 2 and 3.
The proton association/dissociation equations and calculations of pK (equilibrium
constant) for the 12 groups (carboxylic, pheolic and thiol) are described in the supporting
9
described as the decomposition of both protonation/deprotonation of the monodentates and
the associated pK. For example, for the bidentate Ha_ab, the reaction and pK are:
Ha_abH2 = Ha_abH
+ H+ (Eq. 2)
Ha_abH- = Ha_ab2- + H+ . (Eq. 3)
Ion sorption by humic substances is described by the specific complexation
parameters log KMA, log KMB and log KMS for the carboxylic, phenolic and thiol sites,
respectively. In this study, only the binding of the As(III)-thiol groups was studied, and
therefore, only the binding parameter log KMS was determined. It is important to note that the
binding reaction of each thiol with As(III) is characterized by a stability constant log K, where
log KMS is the binding parameter for all the HA thiol sites defined in the modified
PHREEQC-Model VI. Two models of As(III) binding by HA were tested. They consisted of As(OH)3
binding by HA: (i) as monodentate complexes via one HA thiol site (Mono Model) and (ii) as
tridentate complexes via three HA thiol sites (Tri Model). The Mono model is based on the
spectroscopic results obtained elsewhere [25], showing 0.5 to 1.5 S in the first neighbor shell
of As(III) bound to HA. The Tri model is based on the 1:3 complexes evidenced in the binding
of As(III) with proteins [26–33,38]. The binding of As(III) with proteins is described as a deprotonation of three thiol groups in the cystein units and the loss of the three OH- in
As(OH)3. The same mechanism was used in a study on As(OH)3 complexation to thiol
grafted amberlite resin [39]. In the Mono model, only monodentates with thiol sites are
defined, therefore, only four log K were fitted. The binding mechanism of As(OH)3 by
monodentate complexes with HA was adapted for the binding of a neutral species and was
described by the following reaction for the binding of As(OH)3 by the site i:
Ha_iH + As(OH)3 = Ha_iAs(OH)2 + H2O (Eq. 4)
The other reactions describing the binding of As(OH)3 by monodentate complexes are
described in the supporting information SI 5. In the Tri model, As is bound as tridentate with
10
sites), therefore, only four log K were fitted. The binding mechanism between the ijk site and
As(OH)3 is written as:
Ha_ijkH3 + As(OH)3 = Ha_ijkAs + 3 H2O (Eq. 5)
The other reactions concerning the binding mechanisms between the tridentate sites and
As(OH)3 are described in the supporting information SI 5.
2.4.2 Electrostatic model
Previous studies, where Models V, VI or VII were coupled to PHREEQC, attempted to
convert this empirical electrostatic humic ion-binding model into the diffuse layer model
(DLM) formalism [40–44]. This type of conversion requires the calculation of a surface area (A) that depends on the ionic strength similar to the calculations made for polyelectrolytes
such as polyacrylic acid [45]. However, these approaches usually lead to surface areas that
are physically unrealistic (e.g. AHA > 104 m² g-1) for HA [40–45]. Therefore, it may not be
appropriate to use the DLM to implement the humic ion-binding models of Tipping and
coworkers in PHREEQC. Instead, the constant capacitance model (CCM) was used. The
CCM is a very simple electrostatic model in which the capacitance (C, in F m-²) is an
adjustable parameter that varies with the IS [46]. Specifically, the CCM employs a linear
relationship between the surface charge density (0, in C m-2) and the surface potential (Ψ0,
in V), .
However, the CCM is not defined in PHREEQC and had therefore to be implemented
in PHREEQC-MODEL VI. To do this, we modified the TLM (triple layer model) in PHREEQC
to only consider the capacitance of the 1-plane, C1 (F m-²). In the TLM model, the
capacitance of the 2-plane C2 was set to a very large value (C2 ≈ ∞) to be annulled. In the
resulting model (i.e. a basic Stern model), if the surface area A (m2 g-1) is multiplied by a
large factor X (e.g. X = 107), the double layer is suppressed. The new surface area is A' =
(A×X) and the surface charge density at the 0-plane is 0’ = (0 /X) = (C1×X)×Ψ0 (C m-2). The
11
C mol-1). At the 0-plane, then: Z0 = A’×(C1/X)×Ψ0/F. By setting the new capacitance in
PHREEQC as C1’ = C1/X, the charge-potential relationship remains unchanged for the
0-plane, whereas the diffuse layer is suppressed by the high A’ value. This approach results in the CCM.
In Model VI [37], the electrostatic term F×Ψ/(R×T) is replaced by 2×P×Z×log I, where I is the IS (mol L-1) and P is an adjustable parameter (generally -400 < P < -100) that only
depends on the humic substance considered (e.g. composition, origin). Then, the
charge-potential relationship is: Z = F×(2×R×T×P×log I)-1×Ψ. In fact, the latter Z-Ψ relationship is similar to the CCM in which the capacitance C1 = F2×(2×R×T×P×A×log I)-1. As the parameter
P is negative, C1 is a function of -1/log I. The capacitance C1 thus increases with I (IS).
According to the molar mass and the radius of HA (15000 g mol-1; 1.72 nm) in Model VI, the
surface area of HA (AHA) is 1500 m² g-1. C1 can therefore vary from 0.6 F m-² (for P = -400, I =
10-4 M) to 9.4 F m-² (for P = -100, I = 10-1 M), within the same order of magnitude as the
minerals [46].
Ion accumulation in the vicinity of HA is calculated with a Donnan model. The Donnan
volume (VD) is the surface area multiplied by the thickness of the accumulation layer. This
thickness is approximated by the Debye-Hückel parameter , where -1 = (3.29x10⁹xI1/2)-1. Because working with the CCM in PHREEQC/Model VI requires an unrealistic surface area
value, a thickness L = -1/X must be used in PHREEQC/Model VI to keep a realistic VD value.
For HA: VD = AHA × -1 = A’ × L. Here, A = 107 m² g-1, therefore L = 1.5 × 10-4 ×
(3.29×109×I1/2)-1 = 1.44 × 10⁻¹² m for I = 10-3 M. VD is therefore equal to 1.44 × 10⁻⁵ m3 g-1 (or
14.4 L kg-1). VD is within the same magnitude order as VD in NICA-Donnan, which varied from
1 to 80 L kg-1 [47]. Table 1 summarizes the parameters defined for the CCM model in the
modified PHREEQC-Model VI.
2.4.3 Fitting the binding parameters
The PHREEQC-Model VI binding parameters were fitted using the program
12
experiments. The 84 types of sites defined in PHREEQC-Model VI as well as the 84
complexation reactions with H+ were added in the "minteq.v4" database. Humic acids were
defined as SOLUTION_MASTER_SPECIES, SOLUTION_SPECIES and PHASES. The
modeling procedure was designed to determine: (i) the intrinsic proton dissociation
constants, the distribution terms and the abundance (n) of the A, B and S type sites
(Leonardite and S(-II)-Leonardite), and (ii) the specific binding parameters of the thiol groups
for As(III), (Leonardite, S(-II)-Leonardite). The binding parameters were determined for Mono
and Tri models, respectively. However, this set of parameters was large and had to be
decreased to better constrain the model. The abundance parameter for the phenolic groups
(nB) was set to half of the abundance parameter (nA) for the carboxylic groups, as proposed
by Tipping [37]. This assumption is in agreement with the proportion determined in the
literature [48] and in several ion-OM binding models [49,50]. The parameter nS was
considered to be minor compared to nA and nB and regards to the total concentration of S
(Stot) in humic acids (0.76% of S in IHSS Leonardite). Only a part of Stot occurs as thiol sites,
which were supposed to be the more reactive groups regards to As(III) binding. The
concentration of thiol groups, namely nS, could be estimated from Stot and from the % thiol,
as :
nS = thiol %* Stot (Eq. 6)
If the thiol % was not determined for the used Leonardite HA, a range of thiol % was
available in the literature for various humic acids [51–57], mainly determined from XAS records. This range varied from 10 to 50 % of Stot as thiol groups. Therefore, to estimate the
H+ dissociation constant and binding parameters of As(III) with leonardite, 5 fits were
performed on this range, namely with nS = 10, 20, 30, 40 and 50% * Stot. For this 5 fits, nS
parameter for Leonardite and nS' for S(-II)-Leonardite were calculated as:
nS = thiol %* Stot(Leonardite) (Eq. 7)
nS' = Stot(S(-II)-Leonardite)- Stot(Leonardite)+nS
13
The binding parameter log KMS was fitted from isotherm datasets using the combination of
PHREEPLOT/PHREEQC-Model VI for the various thiol % (nS = 10, 20, 30, 40 or 50% * Stot).
In the model’s hypothesis, no strong bidentates and tridentates are possible, and the strong site parameter of the thiol groups, LK2 did not need to be fitted. However, we had to
attribute a value to the LK1 of thiol (LK1S). We chose to fix LK1S to the LK1 of the strong
site used by Tipping [37]: LK1B = LK1S = 0.8. Arsenic(III) log KMS was optimized using the
weighted sum of squares of the residuals, RMSE (Root Mean Square Error). The stability
constants of the four thiol sites - log K (monodentates or tridentates) - defined in
PHREEQC-Model VI were calculated from log KMS and LK1B (see supporting information SI 5).
2.4.4 Dataset from the literature
Seven literature datasets were used to compare both tested models
[17,18,20,22,23,25,58]. The abundance of the thiol sites, ns, had to be determined for each
dataset. Manceau et al. (2012) determined, from XANES fitting, that 23.6% of S is as
exocyclic form in SRHA. We supposed here that this % corresponds to the thiol %. For
Hoffmann et al. [25], the thiol concentrations were determined by the authors. However,
since no XANES data were available for PAHA and AHA, modeling calculations were thus
performed on a thiol % range (nS = 10, 20, 30, 40 and 50% * Stot) with Stot equal to 2.33%,
4.2% and 0.54% for PAHA [59], AHA [60] and SRHA (value from IHSS), respectively.
3 Results
3.1 S(-II) grafting and titration
After S(-II) addition, the concentration of [S(-II)] outside of the dialysis membrane
decreased and reached 0 after about 20h (supporting information SI 6). For the titration and
isotherm experiments, the S(-II)-Leonardite stock solution was sampled after 24h of grafting
and was used immediately.
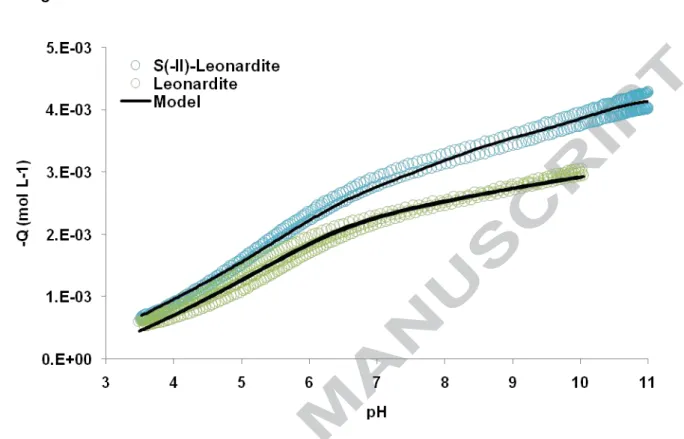
The titrations of Leonardite and S(-II)-Leonardite for two IS are plotted in Fig. 1. The
global charge decreased with increasing pH. At basic pH, the charge Q was more negative
14
versus Q(Leonardite) = -2.98 meq g-1). This difference in charge, Q(S(-II)-Leonardite) -
Q(Leonardite) = -4.32 + 2.98 = -1.34 meq g-1, corresponds to the charge developed by the
thiol groups added to the Leonardite during the grafting.
3.2 Adsorption isotherms
From the As(III) and As(V) concentrations measured in the ultrafiltrate, it can be
observed that no oxidation occurred in any of the samples. Fig. 2: Ex presents the adsorption
isotherms of As(III) by Leonardite and S(-II)-Leonardite (log[As(III)-HA] relative to log
[As(III)]). No plateau was reached for either HA. The percentage of As(III) bound to the
Leonardite was below 5%, and between 5 and 15% for the S(-II)-Leonardite. The adsorption
of As(III) was clearly stronger for S(-II)-Leonardite than for Leonardite. The highest
concentration of bound As to S(-II)-Leonardite confirmed that the addition of thiols to HA
increased its binding capacity with regards to As(III).
3.3 H-HA model
To determine the quality of the fit between the measured and modeled data using
PHREEQC/Model VI, RMSE values were calculated according to RMSE =
, with logµ(exp) and logµ(cal) representing the logarithm of
the charge (or concentration) of the experimental data and modeled data, respectively. For
the titration dataset, the RMSE was 0.03 for all calculated nS , indicating that the fitted H+
binding parameters were able to reproduce the experimental dataset. The
protonation/deprotonation parameters for the carboxylic and phenolic groups are listed in
Table 2 for the various thiol %. The protonation/deprotonation parameters were in the range
of the standard deviation (±) of the model. They were within the same range as the
parameters given by Tipping (1998) for Model VI, except for nA and pKB, the reasons for
15
3.4 As-HA model
Using the protonation/deprotonation constants of the 12 (carboxylic, phenolic and
thiol) binding sites of HA for each thiol abundance, the binding parameter for the thiol groups
(log KMS) was determined using the dataset from the Leonardite and S(-II)-Leonardite
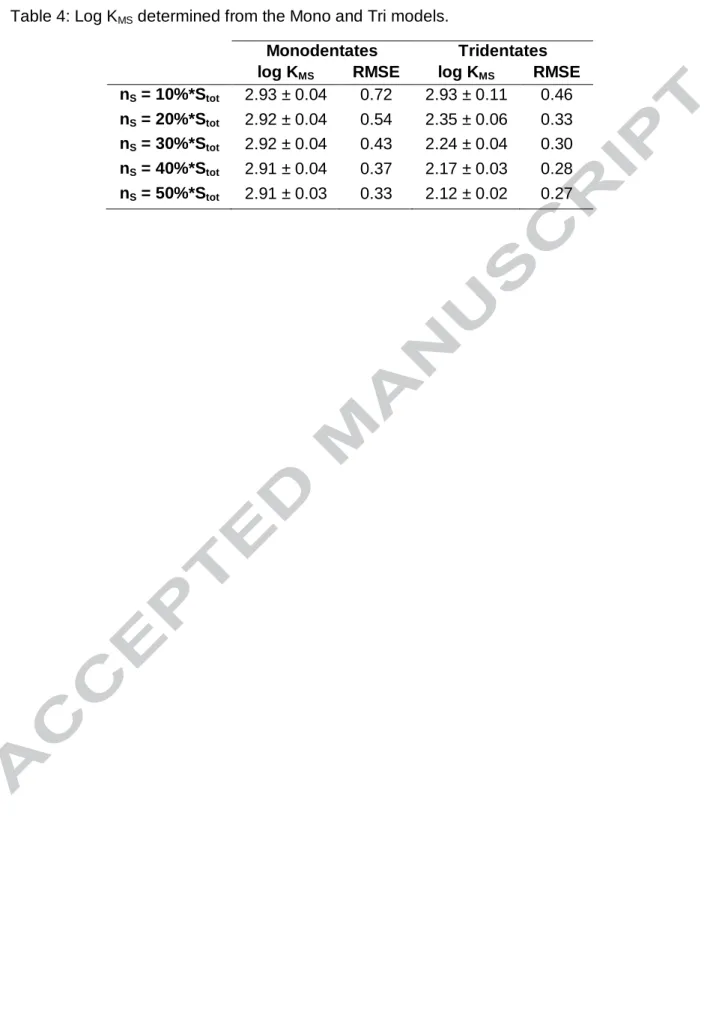
isotherm experiment. The log KMS calculated with the Mono model, which hypothesizes the
complexation of As(III) by HA through monodentate complexes only, was equal to 2.93 (nS =
10% * Stot), 2.92 (nS = 20 and 30% * Stot) and 2.91 (nS = 40 and 50% * Stot) whereas it varied
from 2.93 (nS = 10% * Stot) to 2.12 (nS = 50% * Stot) for the Tri model, in which complexation is
assumed to occur through the tridendate complexes. The simulation of As(III) binding by
Leonardite and S(-II)-Leonardite with the Mono and Tri models is displayed in Fig. 2: Exa.
For the Mono model, the binding parameter, log KMS, did not vary significantly with the thiol
%. However, the corresponding RMSE decreased from 0.72 to 0.33 with the increasing nS
(Table 4). By contrast, for the Tri model, log KMS increased strongly with the decreasing thiol
%, log KMS = 2.93 to 2.12. It is important to note that these differences were multiplied by a
factor of 3 for the corresponding log K (see part 2.4), which thus varied from 2.12*3 = 6.36 to
3*2.93 = 8.79. Regards to the smallest RMSE, for all the following calculations, log KMS was
fixed at 2.91 and 2.12 for the Mono and Tri models, respectively. The modeling performed
with both the Mono and Tri models was very similar, as demonstrated by the RMSE values of
0.33 and 0.27, respectively. The standard deviations calculated for the log KMS values were
small (0.03 and 0.02 for the Mono and Tri models, respectively). Therefore, these two
simulations alone could not be used to validate either one of the models in particular. To
further validate the modeling approach, the fitted binding parameters therefore had to be
tested using other experimental datasets.
3.5 Simulations with the Mono and Tri models
The RMSE fits were averaged and weighted by all available data (Table 3) to compare Mono
16
PAHA. Three studies used this HA [the present study, 17-18]. The first used dataset
was produced in the present study and corresponded to the As(III) adsorption isotherm on
purified Aldrich humic acid (PAHA) (Fig. 2a). Between 7 and 16% of As(III) were bound to
PAHA in the performed experiments. The present produced datasets were better fitted with
the Tri model than with the Mono model (mean RMSE = 0.86 and 0.62 for the Mono and Tri
models, respectively). By contrast, both other datasets [17,18] were less simulated (mean
RMSE = 0.73 and 0.53 against 1.24 and 0.82 for the Mono and Tri models, respectively).
The weighted RMSE was lower for the Mono than for the Tri models (RMSE = 0.67 and 0.90
for the Mono and Tri models, respectively) (Table 3 and SI2 a and b).
AHA. Several studies used this HA [17,22,23,58] at various pH and HA
concentrations. Note that this humic acid was not purified with the IHSS protocol and
contained probably humin, humic and fulvic acids and impurities (silica, metals, etc.). The
experimental datasets from Kappeler [58] and Liu and Cai [22] at pH 5.2 were better fitted
with the Tri than the Mono models (RMSE mean = 0.4, 0.3 and 0.51 and 0.52, respectively)
(Fig. 2c and Table 3). However, Liu and Cai [22] datasets at pH 7 and 9, Fakour and Lin [23]
and Thanabalasingam and Pickering [17] were better fitted with the Mono than with the Tri
models (Table 3 and SI 2d, f, g, h, i). For all datasets, the lower weighted RMSE was
obtained for the Mono model (Table 3). The datasets at high pH were lesser fitted by both
models which was probably account for the presence of H2AsO3- specie that was bound to
HA with a mechanism not described in both models.
SRHA. Only two datasets used this HA [20,58]. The used thiol % of SRHA was
determined as nS = 23.6% * Stot [56]. Regards to the experimental pH range, the fitting
calculations used only 3 and 2 data points for Kappeler [58] and Lenoble et al. [20] datasets,
respectively. The best fits were obtained with the Tri model (Table 3, Fig. 2d and SI2j).
However, regards to the small number of data, RMSE should be considered carefully (see
Discussion section).
Elliot Soil HA and Peat. For both datasets, thiols were grafted to HA and their %
17
reproduced by the Mono than the Tri models (Fig. 2: Exe and Table 3) (RMSE = 0.74 for the
Mono model versus 0.19 for the Tri model). By contrast, neither the Mono nor the Tri model
reproduced the peat dataset of Hoffmann et al. [25], over the entire thiol % range (Fig. 2: Exf,
Table 3). More precisely, the Tri model could simulate the experimental dataset at low thiol
%, but the Mono model better simulated the dataset at high thiol %. The weighted RMSE
calculated for both datasets was better for the Tri than for the Mono model. However, the
spectroscopic data obtained by Hoffman et al. [25] clearly allowed to reject the Tri model,
since only one S was determined in the vicinity of the As(III) [25].
Based on the weighted RMSE calculated for all datasets, it appears that the Mono
model better simulated the experimental datasets than the Tri model, notably regards to the
data from PAHA and AHA (Table 3). Moreover, as specified before, for the datasets at pH >7
([22] at pH 7 and 9.3, [23]) the potential presence of H2AsO3- species decreased the fit
quality. Using the datasets for AHA and PAHA at pH <7, namely without H2AsO3-, the
weighted RMSE decreased to 0.60 and 0.75 for Mono and Tri models, respectively (Table 3)
indicating that the Mono model simulated more datasets than the Tri model. Note that the
high RMSE were due to the large range of thiol % used for AHA and PAHA (nS = 10-50% *
Stot).
4 Discussion
4.1 H-HA parameters
The protonation/deprotonation parameters for the A, B and S sites are presented and
compared to Tipping’s parameters [37] for Model VI (Table 2). The variation in the carboxylic and phenolic abundances might be explained by the implementation of thiol groups (nS). For
a same total abundance of site (dependent only on the type of humic substance), three
different abundances (nA, nB and nS) are defined here versus two abundances (nA and nB) in
Model VI. Fig. 1 showed that the HA titrations performed in this study are within the range of
the HA titration values compiled by Milne et al. [61]; notably, the obtained pKA and ΔpKA are
18
which was explained by the fact that in Model VI, the thiol and phenol groups were grouped
together and considered as site B. Data from the literature showed that the pK of the phenol
ligands seems to depend on the carbon radical to which the hydroxyl (OH) is bound. For
example, the pK of hydroxybenzene, (OH- bound to one benzoic cycle) is 9.98 (at 25°C and
IS = 0 mol L-1) versus 7.21 for nitrophenol (OH bound to one benzoic cycle, which is itself
bound to NO2) (at 25°C and IS = 0 mol L-1). As the molecular structure of OM is complex and
heterogeneous, the form/structure of the carbon radical of phenol cannot be identified.
However, the fitted pKB of 7.11 obtained in this study was consistent with the pKA of phenol.
The H+ dissociation constant for the thiol groups, pKS = 5.82 ± 0.05, was lower than
pKB, suggesting that thiol groups are more deprotonated at acidic pH than phenolic groups.
For a simple organic ligand (aliphatic or aromatic) containing thiol groups, the pK varied from
5.2 to 13.24 (Fig. 3). This pKA range correlates with the molecular weight of the molecules:
pKA decreases with increasing molecular weights (Fig. 3). Moreover, for aromatic molecules
containing one thiobenzene, the increasing molecular weight of the radical associated with
the aromatic ring is correlated with the decreasing pKA. Based on this dataset, the low pKS
(5.82) obtained for the deprotonation of the thiol sites can therefore be justified by the high
molecular weight and aromaticity of HA (Fig. 3). The distribution term of pKS, ΔpKS, was high
(6.12 ± 0.12), suggesting that the thiol pK were distributed over a large pK range. Humic
acids are not only macromolecular but also supramolecular moieties [62], i.e. not only formed
with high weight aromatic molecules but also lower weight molecules. The correlation
between pK for the thiol group and the molecular weight of thiol-containing organic molecules
might therefore explain this high distribution (ΔpKS). Several simulations were performed to
test the influence of ΔpKS on the fitting of the As(III)-HA binding parameters. Variations in
ΔpKS did not produce any variation for the As(III) concentrations bound to HA (supporting
19
4.2 As(III)-HA binding parameters
There is no consensus regarding the mechanisms involved in the binding of As(III) by
HA. Buschmann et al. and Lenoble et al. [19,20] proposed that this binding occurs through
the complexation of As(III) by carboxylic and phenolic groups. These functional groups are
the most abundant in OM and they are able to complex many cations such as Fe(II, III), REE,
Al, Mg, etc. [50,63–65]. However, the direct complexation of As(III) species by HA carboxylic groups has not been supported so far by any spectroscopic data. At any rate, the log K of
As(III) binding to simple organic ligands is low - catechol with log K = -6.89 and
As(III)-pyrogallol with log K = -6.32 [66], indicating that this complexation, if any, should be of minor
importance. By contrast, recent spectroscopic studies suggested two new binding
mechanisms. The first one consists of an indirect mechanism in which As(III) is bound to OM
via Fe [15,18,19,22,67,68]. The second consists of a direct mechanism in which As(III) is
bound to OM via thiol functional groups [39,69]. Arsenic(III) has high affinity for S
containing-ligands. The stoechiometry of the formed As-thiol organic molecules are either 1:1 (i.e. thiol
in peat and HA [25]) or 1:3 (i.e. cystein [30]) depending on the ligand involved. In this study,
two models were designed to test the reality of these complexes, i.e. the monodentate (1:1)
model, the so-called Mono model, and the tridentate (1:3) model, the Tri model. Simulations
of published datasets with the binding parameters established using the experimental data of
this study demonstrated that the Mono model well reproduced more datasets than the Tri
model (weighted RMSE = 0.86 and 1.22 for the Mono and Tri models, respectively).
Considering the datasets of PAHA and AHA without H2AsO3- species, the mean RMSE was
lower with the Mono than the Tri model. The Mono model is in accordance with the binding
mechanisms proposed by Hoffmann et al. [25], i.e. the formation of monodentate complexes.
Hoffmann et al.’s spectroscopic study [25] demonstrated that only one S is located in the vicinity of As(III) in their HA sample (0.5 < CN (coordination number) < 1.5 at 2.29 - 2.34 Å).
The fact that neither the Mono model nor the Tri model was successful in fitting these
experimental data [25] could be explained by the experimental conditions used by the
20
concentrations had to be used in the experiments. These high amounts of As(III) could
promote the formation of arsenite polymers. This hypothesis is supported by the presence of
As in the vicinity of the bound As(III) in the EXAFS fitting of HA data by Hoffmann et al. [25]
(0.3 < CN < 0.5 at 2.63 - 2.67 Å). This model, which only considered As(III), therefore
overestimated the bound As(III) concentrations. The same overestimation was obtained for
Warwick et al.’s dataset [18]. The experimental conditions of this dataset ([As(III)] = 2 - 42 mg L-1 and [HA] = 1.5 g L-1) were within the same range as those of Hoffmann et al. [25] ([As(III)]
= 4.1 mg L-1 and [peat] = 4.5 g L-1) and it is likely that As(III) polymers were formed during
these experiments. Moreover, the sorption isotherm of Warwick et al. [18] exhibited two
sorption increase/decrease steps (see supporting information SI 2c), a feature that could not
be explained. The differences between the experimental and modeled data for the peat
dataset of Hoffmann et al. [25] can be explained by the nature of the peat used, as it is a
specific OM formed in very specific conditions and this could thereby influence its
composition and surface reactivity. The Mono model also failed to reproduce SRHA datasets
[20,58]. Since the occurrence of H2AsO3- was expected for most data, only five points of both
datasets could be used for fitting. The RMSE depended on the number of extrapolated
points. For large datasets, the RMSE is expected to be lower than for small datasets.
Moreover, a high discrepancy was observed between Kappeler [58] and Lenoble et al. [20]
datasets. Lenoble et al. [20] showed that between 30 to 80% of As(III) was bound to SRHA
versus 0.11 to 23.9% for Kappeler [58] for equivalent experimental conditions (at pH = 8.4,
DOC = 50 mg L-1, [As(III)]tot = 0.134 µmol L-1, As(III) bound = 8.87% and pH = 8, DOC = 15
mg L-1 and [As(III)]tot = 0.16 µmol L-1, As(III) bound = 38%, respectively). So far, we have no
explanations for these observed differences. The RMSE were high for both Mono and Tri
models. These RMSE corresponded to the average of the RMSE calculated for the 5 tested
nS in the calculation of which Stot had the same values for each PAHA and each AHA
samples, (%S = 2.33% and 4.2% for PAHA and AHA, respectively). However, considering
the date of the various published studies, HA were probably provided from different lots.
21
Therefore, modeling calculations should only be considered as estimations and they had to
be improved with the true Stot and thiol %.
The As(III)-thiol HA binding parameter log KMS is equal to 2.91 ± 0.04. Log KMS was
determined for protonated HA (see Eq. 4), in contrast to cation binding in PREEQC-Model VI
and Model VI. For deprotonated species, log KMS is equal to = -5.38, which is very low
compared to the log KMA and log KMB of cations (log KMA (Ba) = -0.2 < log KMA (Model VI) <
log KMA(Dy) = 2.9). This indicates that the capacity of HA to bind As(III) is much lower than
the capacity of HA to bind cations. This is not surprising in terms of the global negative
charge of HA and the neutral charge of As(III) which had to lose one OH in order to be bound
to the negative charged-thiol group in HA.
In figure 4 were plotted the log β relative to the number of coordinated thiols in the complexes formed between As(III) and thiol-containing organic molecules. It is important to
note that Rey et al.’s log β [29] values are much higher than the log β values determined by other workers, as previously noted [30]. Log β increased with the increasing number of coordinated thiols. The binding of As(III) to dithiol molecules (e.g. dimercaptosuccinic acid -
DMSA) leads to the formation of a ring stabilizing the complex. Few data for monodentate
1:1 complexes between As(III) and thiol-containing molecules are available in the literature.
Thiol groups are strongly reactive regards to As(III) and As(III) is therefore often bound to 2
or 3 thiols, as bi- or tridentate complexes. The log KMS (here, log KMS = log K) of 2.91
extrapolated for the Mono model was within the log β range of the 1:1 complexes (Fig. 4). Moreover, for aryl arsinous acid (ArAs(CH3)OH), in which only OH is available for binding,
Liang and Drueckhammer [70] determined a log β of 2.80 with mercaptoethane, which was close to log K determined in this work. The extrapolated log KMS confirmed thereby the low
affinity of As(III) for HA.
For, the Tri model, extrapolated log KMS was 2.02 and corresponded to log k ≈ 3 * log KMS =
6.06. This calculated log k was in the range of the log β of the 3 coordinated thiol-As (III) complexes. Among this group, the binding mechanism can occur through 1:3, 1:2, 1:1
22
The log β of the tridentate 1:1 complexes of the group of the 3 coordinated thiols were lower than those of the Tri model (Fig. 4Error! Reference source not found.).
If the formation of tridentates is efficient for As(III) binding by peptides, proteins,
organic ligands or thiol-resin [26,28–31,33,39], the present results did not provide evidence that in HA, the formation of tridentates is promoted. In organic ligand or thiol-resin, there was
a high density of thiol groups compared to HA, in which phenolic and carboxylic groups
predominate (nA > 12 x nS in the present study). Moreover, in Hoffmann et al. [25], although
the HA samples were grafted with thiols, only monodentates were formed, as evidenced by
the spectroscopic analyses. Thus, the thiol concentrations are not the only controlling factor
for monodentates or tridentates formation. Numerous organic ligands formed 1:3 (e.g.
cysteine, glutathione) or 1:2 complexes (e.g. Sp1-zf2 f565-595 protein) with As(III) (Fig. 4).
Many of them are aliphatic and carry two or more thiol sites that are thus close to each other
(e.g. dithiothreitol, dimercaptosuccinic acid). Spuches et al. [30] provided evidence that
entropic factors are important in constraining the stability of the complex formed between
As(III) proteins. Therefore proteins, in which the vicinity of the cysteine residue (i.e. the thiol
groups) are conformably constrained (entropic advantage) and favorably positioned, are
expected to form a high denticity complex (max 3) with As(III). Moreover, some peptides and
proteins are flexible in solution, which allows As(III) to bind several thiol groups despite the
distances between the thiol sites, subsequently modifying the geometry of the molecules
[28]. In contrast to what occurs with peptides and proteins, HA are complex moieties that are
strongly rigidified by the presence of aromatic rings. This rigidity combined with the low thiol
density and subsequent high distances between the thiol groups prevent the formation of
tridendate complexes with As(III).
4.3 Implications of the direct binding mechanism evidenced
The present study further demonstrated the ability of HA to directly bind As(III) via
their thiol functional groups. However, the calculated binding parameters are low, suggesting
23
sites as suggested by the high value of the distribution term, pKS. The binding of As(III) by
HA will therefore probably play a minor role in the fate of As in organic-rich waters. However,
if the available database indicates that the amount of As(III) bound to HA should be low in
most cases, this amount will depend on the abundance of the thiol functional groups in HA.
Since thiol % were not determined for the whole datasets, the thiol concentration had to be
tested within the range expected from spectroscopic analyses (nS = 10, 20, 30, 40 and 50% *
Stot). The obtained RMSE decreased with the increasing thiol concentrations, which provided
evidence of a strong dependency between the amounts of bound As(III) and the thiol groups.
The thiol abundance will be the major controlling factor with regards to the direct binding of
As(III) to HA. Therefore, the composition and structure of HA will influence the amount of As
on the surface of the humic colloids or particles. The sulfur concentrations in organic matter,
especially in humic substances, vary a lot; for example, among the humic substances sold by
IHSS, the sulfur concentrations vary from 0.36% (Waskish Peat reference HA) to 3.03%
(Pony Lake fulvic acid). The first HA is sourced in deep, very poorly drained organic soils and
consist of decomposed bogs, whereas Pony Lake fulvic acid comes from a saline coastal
pond from Antartica and is composed of purely microbially-sourced fulvic acid. This microbial
composition should explain the high concentration of sulfur found in this fulvic acid.
Moreover, the only Stot amount was not sufficient to determine the thiol concentrations in
humic substances. The concentrations of thiol groups varied from from 1 to 46.9% [51–57]. To better understand the binding of As(III) to thiol groups, it is therefore absolutly necessary
to determine thiol concentrations. If XAS techniques allow to estimate exocyclic S and thiol
concentrations. its sensibility is low and this technique requires high concentrations of thiol
[53]. Recently, Rao et al. [53],proposed to a new titration methoded based on the used of
ThioGlo-1 as thiol groups complexing agent [53]. These type of method had to be developed
to systematically determine thiol concentrations and better estimated the As(III) amount
bound to organic matter.
Since thiol groups are good potential binding sites for As(III), reduced peatland
24
concentrations, will thus be favorable environments for the binding of As(III) to HA. In
contrast, in oxidized environments with the development of Fe(III) species, As(III, V) is
expected to be strongly bound to OM via ternary complexes with Fe(III) as cationic or
(nano)oxides bridges [5,71–73]. Under reducing conditions, where Fe(III) is reduced to Fe(II), this mechanism will not be activated and the binding of As(III) to OM will thus predominantly
occur through the direct binding of As(III) by thiol groups. However, in organic-rich
environments such as wetland soils, Fe(II) is strongly bound to OM [44,74–76]. Therefore, several questions can be raised regarding the binding of As to OM in these environments,
such as: can the Fe(II) bound to OM modify the As binding? Is it possible to form ternary
complexes between As(III), Fe(II) and OM? If so, what is the dominant mechanism that binds
As(III) to OM in these types of environments: As(III)-Fe(II)-HA or to As(III)-S(-II)-HA?
5 Conclusion and perspectives
We provided experimental data for As(III) binding by Leonardite that has either been
grafted or not with thiol groups. Titrations of both HAs were used to calculate the
protonation/deprotonation parameters of each thiol site defined in our modified
PHREEQC-Model VI model. In a second step, As(III)-HA experimental sorption isotherms were fitted to
determine the binding parameters of the As(III)-thiol HA complexes. Two binding hypotheses
were tested, the establishment of monodentate complexes (the Mono model) and the
formation of tridentate complexes (the Tri model). To test each of these models, the
extrapolated binding parameter sets of the Mono and Tri models were used to fit several
experimental datasets available in the literature. This procedure could be used to validate the
Mono model, i.e. the monodentate hypothesis, in terms of its ability to predict As(III) binding
by HA. Extrapolated log KMS was equal to 2.91 ± 0.04. When the amount of bound As(III) to
HA was low (around 5-10% of As(III) bound to HA in these experimental conditions), they
were strongly dependent on the thiol density. The formation of monodentate complexes
rather than tridentate ones could be explained by the combination of the low thiol density and
25
in contrast to flexible peptides or proteins, which are able to bind As(III) through tridentate
complexes with thiol functions. These results therefore highlighted the necessity to determine
the concentration of S and more specifically the concentration of the thiol groups in the
different organic matters, which is currently not easily determined. It could also be interesting
to study the binding of As(III) by fulvic acids, which have a smaller aromatic nucleus and a
long aliphatic chain, to better constrain the fate of As(III) in organic-rich environments.
Moreover, the binding by Fe through ternary complexes should be better defined to
determine the competition between both mechanisms in the different redox states of As and
26
Acknowledgments
This study was funded by the French ANR through the "Programme Jeunes Chercheurs"
ARSENORG. Dr S. Mullin is acknowledged for post-editing the English style. We also
27
References
[1] J.A. Plant, D.G. Kinniburgh, P.L. Smedley, F.M. Fordyce, in:, Treatise Geochem., Elsevier, 2004, pp. 17–66.
[2] H. Guo, B. Zhang, Y. Zhang, Appl. Geochem. 26 (2011) 360. [3] M. Bauer, C. Blodau, Sci. Total Environ. 354 (2006) 179.
[4] M. Bauer, C. Blodau, Geochim. Cosmochim. Acta 73 (2009) 529.
[5] K. Ritter, G. Aiken R., J.F. Ranville, M. Bauer, D.L. Macalady, Environ. Sci. Technol. 40 (2006) 5380.
[6] S. Fendorf, Lawrence Berkeley Natl. Lab. (2010).
[7] B.D. Kocar, Soil-Sediment Processes Perpetuating History’s Largest Mass Poisoning through Release of Arsenic to Asian Groundwaters, ProQuest, 2008.
[8] M.L. Polizzotto, C.F. Harvey, S.R. Sutton, S. Fendorf, Proc. Natl. Acad. Sci. U. S. A. 102 (2005) 18819.
[9] J. Akai, K. Izumi, H. Fukuhara, H. Masuda, S. Nakano, T. Yoshimura, H. Ohfuji, H. Md Anawar, K. Akai, Appl. Geochem. 19 (2004) 215.
[10] F.S. Islam, A.G. Gault, C. Boothman, D.A. Polya, J.M. Charnock, D. Chatterjee, J.R. Lloyd, Nature 430 (2004) 68.
[11] J.. McArthur, D.. Banerjee, K.. Hudson-Edwards, R. Mishra, R. Purohit, P. Ravenscroft, A. Cronin, R.. Howarth, A. Chatterjee, T. Talukder, D. Lowry, S. Houghton, D.. Chadha, Appl. Geochem. 19 (2004) 1255.
[12] J.M. McArthur, P. Ravenscroft, S. Safiulla, M.F. Thirlwall, Water Resour. Res. 37 (2001) 109.
[13] K.J. Tufano, C. Reyes, C.W. Saltikov, S. Fendorf, Environ. Sci. Technol. 42 (2008) 8283.
[14] M. Grafe, M.J. Eick, P.R. Grossl, Soil Sci. Soc. Am. J. 65 (2001) 1680.
[15] I. Ko, J.-Y. Kim, K.-W. Kim, Colloids Surf. Physicochem. Eng. Asp. 234 (2004) 43. [16] A.D. Redman, D.L. Macalady, D. Ahmann, Environ. Sci. Technol. 36 (2002) 2889. [17] P. Thanabalasingam, W.F. Pickering, Environ. Pollut. 12 (1986) 233.
[18] P. Warwick, E. Inam, N. Evans, Environ. Chem. 2 (2005) 119.
[19] J. Buschmann, A. Kappeler, U. Lindauer, D. Kistler, M. Berg, L. Sigg, Environ. Sci. Technol. 40 (2006) 6015.
[20] V. Lenoble, D.H. Dang, M. Loustau Cazalet, S. Mounier, H.-R. Pfeifer, C. Garnier, Talanta 134 (2015) 530.
[21] A.F. Holleman, E. Wiberg, Lehrbuch Der Anorganischen Chemie, 101st ed., W. deGruyter, 1995.
[22] G. Liu, Y. Cai, Chemosphere 81 (2010) 890.
[23] H. Fakour, T.-F. Lin, J. Hazard. Mater. 279 (2014) 569.
[24] P. Langner, C. Mikutta, R. Kretzschmar, Nat. Geosci. 5 (2011) 66.
[25] M. Hoffmann, C. Mikutta, R. Kretzschmar, Environ. Sci. Technol. 46 (2012) 11788. [26] S. Cavanillas, E. Chekmeneva, C. Ariño, J.M. Díaz-Cruz, M. Esteban, Anal. Chim. Acta
746 (2012) 47.
[27] B.P. Gaber, A.L. Fluharty, Bioinorg. Chem. 2 (1972) 135. [28] K.T. Kitchin, K. Wallace, J. Inorg. Biochem. 102 (2008) 532.
[29] N.A. Rey, O.W. Howarth, E.C. Pereira-Maia, J. Inorg. Biochem. 98 (2004) 1151. [30] A.M. Spuches, H.G. Kruszyna, A.M. Rich, D.E. Wilcox, Inorg. Chem. 44 (2005) 2964. [31] J. Starý, J. Růzicka, Talanta 15 (1968) 505.
[32] W.L. Zahler, W.W. Cleland, J. Biol. Chem. 243 (1968) 716.
[33] L. Zhao, S. Chen, L. Jia, S. Shu, P. Zhu, Y. Liu, Metallomics 4 (2012) 988. [34] A.W.P. Vermeer, W.H. Van Riemsdijk, L.K. Koopal, Langmuir 14 (1998) 2810.
[35] M.J. Avena, L.K. Koopal, W.H. Van Riemsdijk, J. Colloid Interface Sci. 217 (1999) 37. [36] M. Fakih, M. Davranche, A. Dia, B. Nowack, G. Morin, P. Petitjean, X. Châtellier, G.
Gruau, Chem. Geol. 259 (2009) 290. [37] E. Tipping, Aquat. Geochem. 4 (1998) 3.
28
[38] N.J. McSweeney, L. Forbes, Miner. Eng. 64 (2014) 67.
[39] M. Hoffmann, C. Mikutta, R. Kretzschmar, Environ. Sci. Technol. 48 (2014) 3822.
[40] C. Appelo, D. Postma, Geochemistry, Groundwater and Pollution, Taylor & Francis, New York, 2005.
[41] D.J. Liu, C. Bruggeman, N. Maes, Radiochim. Acta 96 (2008).
[42] R. Marsac, N.L. Banik, C.M. Marquardt, J.V. Kratz, Geochim. Cosmochim. Acta 131 (2014) 290.
[43] R. Marsac, M. Davranche, G. Gruau, M. Bouhnik-Le Coz, A. Dia, Geochim. Cosmochim. Acta 75 (2011) 5625.
[44] C. Catrouillet, M. Davranche, A. Dia, M. Bouhnik-Le Coz, R. Marsac, O. Pourret, G. Gruau, Chem. Geol. 372 (2014) 109.
[45] J. Lützenkirchen, J. van Male, F. Leermakers, S. Sjöberg, J. Chem. Eng. Data 56 (2011) 1602.
[46] J. Lützenkirchen, J. Colloid Interface Sci. 217 (1999) 8.
[47] D.G. Kinniburgh, W.H. van Riemsdijk, L.K. Koopal, M. Borkovec, M.F. Benedetti, M.J. Avena, Colloids Surf. Physicochem. Eng. Asp. 151 (1999) 147.
[48] E.M. Thurman, Organic Geochemistry of Natural Waters, 1985. [49] J.P. Gustafsson, J. Colloid Interface Sci. 244 (2001) 102.
[50] E. Tipping, M.A. Hurley, Geochim. Cosmochim. Acta 56 (1992) 3627. [51] M. Haitzer, G.R. Aiken, J.N. Ryan, Environ. Sci. Technol. 37 (2003) 2436.
[52] J. Qian, U. Skyllberg, W. Frech, W.F. Bleam, P.R. Bloom, P.E. Petit, Geochim. Cosmochim. Acta 66 (2002) 3873.
[53] B. Rao, C. Simpson, H. Lin, L. Liang, B. Gu, Talanta 119 (2014) 240.
[54] K. Xia, F. Weesner, W.F. Bleam, P.R. Bloom, U.L. Skyllberg, P.A. Helmke, Soil Sci. Soc. Am. J. 62 (1998) 1240.
[55] W. Dong, L. Liang, S. Brooks, G. Southworth, B. Gu, Environ. Chem. 7 (2010) 94. [56] A. Manceau, K.L. Nagy, Geochim. Cosmochim. Acta 99 (2012) 206.
[57] T. Jiang, U. Skyllberg, S. Wei, D. Wang, S. Lu, Z. Jiang, D.C. Flanagan, Geochim. Cosmochim. Acta 154 (2015) 151.
[58] A. Kappeler, Arsenic Binding to Dissolved Humic Acids in Aqueous Solution, ETHZ, 2006.
[59] J.-I. Kim, G. Buckau, G.H. Li, H. Duschner, N. Psarros, Fresenius J. Anal. Chem. 338 (1990) 245.
[60] C. Arnold, A. Ciani, S.R. Müller, A. Amirbahman, R.P. Schwarzenbach, Environ. Sci. Technol. 32 (1998) 2976.
[61] C.J. Milne, D.G. Kinniburgh, E. Tipping, Environ. Sci. Technol. 35 (2001) 2049. [62] M. Pédrot, A. Dia, M. Davranche, J. Colloid Interface Sci. 339 (2009) 390.
[63] J. Buffle, K.J. Wilkinson, S. Stoll, M. Filella, J. Zhang, Environ. Sci. Technol. 32 (1998) 2887.
[64] C.J. Milne, D.G. Kinniburgh, W.H. Van Riemsdijk, E. Tipping, Environ. Sci. Technol. 37 (2003) 958.
[65] G. Sposito, CRC Crit. Rev. Environ. Control 16 (1986) 193. [66] A.E. Martell, R.M. Smith, Critical Stability Constants, 1989. [67] H.-T. Lin, M.. Wang, G.-C. Li, Chemosphere 56 (2004) 1105.
[68] M. Hoffmann, C. Mikutta, R. Kretzschmar, Environ. Sci. Technol. 47 (2013) 12165. [69] P. Langner, C. Mikutta, R. Kretzschmar, Nat. Geosci. 5 (2011) 66.
[70] X. Liang, D.G. Drueckhammer, New J. Chem. 38 (2014) 1368.
[71] C. Mikutta, J. Frommer, A. Voegelin, R. Kaegi, R. Kretzschmar, Geochim. Cosmochim. Acta 74 (2010) 5574.
[72] C. Mikutta, R. Kretzschmar, Environ. Sci. Technol. 45 (2011) 9550. [73] P. Sharma, J. Ofner, A. Kappler, Environ. Sci. Technol. 44 (2010) 4479. [74] A.L. Rose, T.D. Waite, Mar. Chem. 84 (2003) 85.
[75] M. Schnitzer, S.I.M. Skinner, Soil Sci. 102 (1966) 361. [76] T.L. Theis, P.C. Singer, Environ. Sci. Technol. 8 (1974) 569.
29
[78] J.D. Gough, J.M. Gargano, A.E. Donofrio, W.J. Lees, Biochemistry (Mosc.) 42 (2003) 11787.
[79] R. Williams, (n.d.).
[80] A.M. Spuches, H.G. Kruszyna, A.M. Rich, D.E. Wilcox, Inorg. Chem. 44 (2005) 2964. [81] A.M. Spuches, D.E. Wilcox, J. Am. Chem. Soc. 130 (2008) 8148.
30
Figures
Fig. 1: Titrations of Leonardite (shown as green symbols) and S(-II)-Leonardite (shown as blue symbols) as compared to the modeling (shown as black lines).
31 Legend: [As (I II ) s orb e d ] (µ mol mo l C ) -1 log [ A s (I II ) s orbe d] ) (M)
log [As(III) free]) (M)
32
Fig. 2: Experimental and modeled datasets of (a) Leonardite and S(-II)-Leonardite, (b) the present purified Aldrich HA, (c) AHA experimental data from Kappeler [58], (d) SRHA experimental data from Kappeler [58], (e) HA experimental data from Hoffmann et al. [25] , (f) peat experimental data from Hoffmann et al. [25].
33
Fig. 3: Compilation of the pKa of the thiol function of thiol-containing organic molecules according to their molecular weight [66,77–79]. The distinction was made between aliphatic (red symbols) and aromatic ring-containing molecules (black symbols).
34
Fig. 4: Comparison between log β of thiol-containing organic molecules and As(III) and log KMS relative to the number of coordinated thiols in the complexes [26,27,29,31–33,39,80,81].
35
Tables
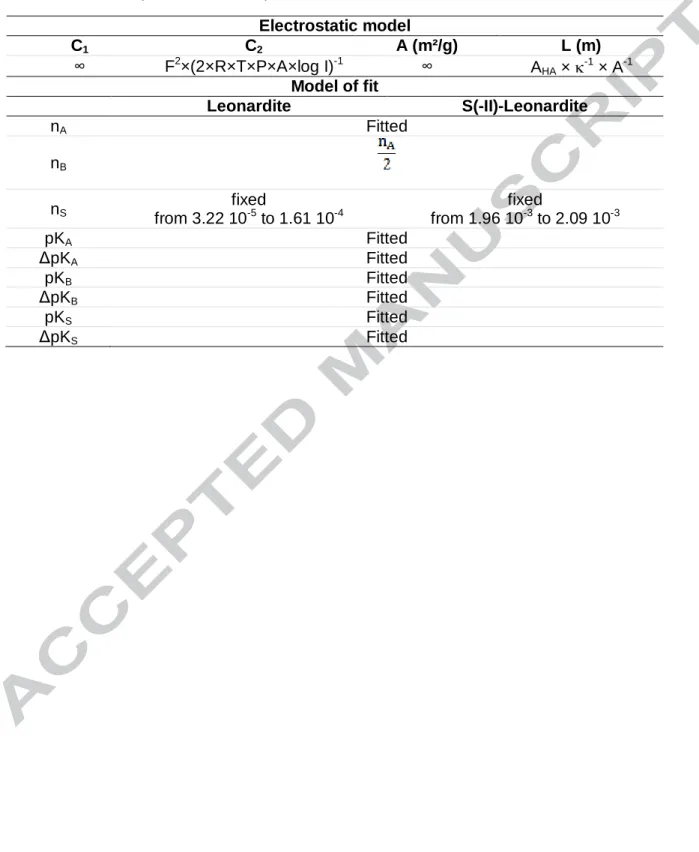
Table 1: Summary of the different parameters of the model.
Electrostatic model C1 C2 A (m²/g) L (m) ∞ F2×(2×R×T×P×A×log I)-1 ∞ AHA × -1 × A-1 Model of fit Leonardite S(-II)-Leonardite nA Fitted nB nS fixed from 3.22 10-5 to 1.61 10-4 fixed from 1.96 10-3 to 2.09 10-3 pKA Fitted ΔpKA Fitted pKB Fitted ΔpKB Fitted pKS Fitted ΔpKS Fitted
36
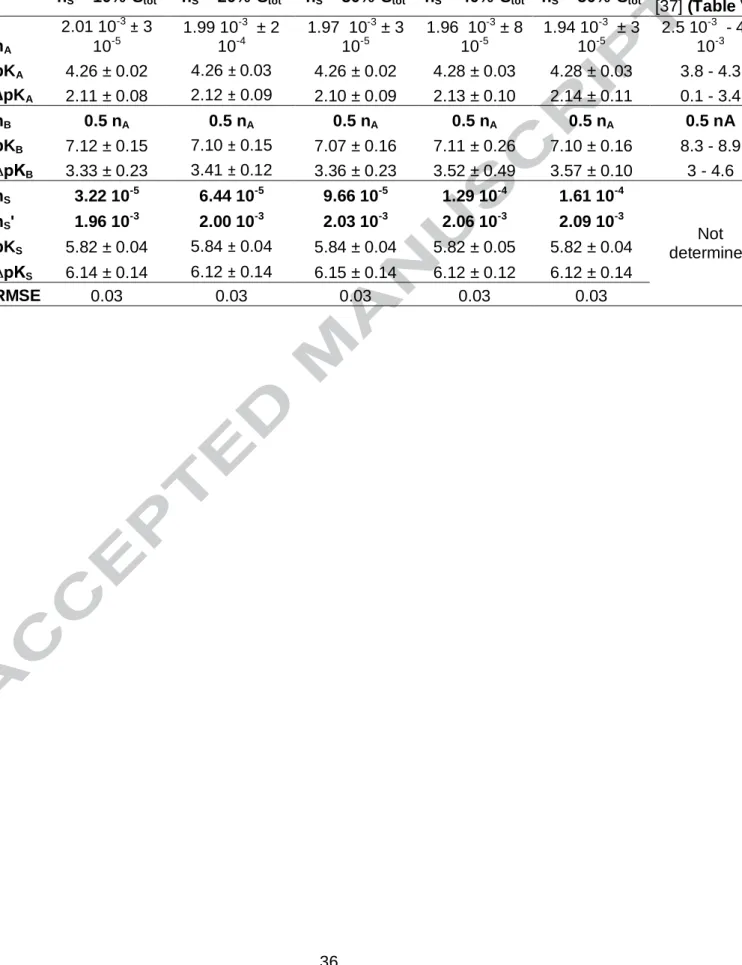
Table 2: Values of the protonation/deprotonation parameters of the three sites (A: carboxylic groups, B phenolic groups and S thiol groups). Values in bold are fixed.
nS = 10%*Stot nS = 20%*Stot nS = 30%*Stot nS = 40%*Stot nS = 50%*Stot
Tipping et al. [37] (Table V) nA 2.01 10-3± 3 10-5 1.99 10-3 ± 2 10-4 1.97 10-3 ± 3 10-5 1.96 10-3 ± 8 10-5 1.94 10-3 ± 3 10-5 2.5 10-3 - 4.3 10-3 pKA 4.26 ± 0.02 4.26 ± 0.03 4.26 ± 0.02 4.28 ± 0.03 4.28 ± 0.03 3.8 - 4.3 ∆pKA 2.11 ± 0.08 2.12 ± 0.09 2.10 ± 0.09 2.13 ± 0.10 2.14 ± 0.11 0.1 - 3.4 nB 0.5 nA 0.5 nA 0.5 nA 0.5 nA 0.5 nA 0.5 nA pKB 7.12 ± 0.15 7.10 ± 0.15 7.07 ± 0.16 7.11 ± 0.26 7.10 ± 0.16 8.3 - 8.9 ∆pKB 3.33 ± 0.23 3.41 ± 0.12 3.36 ± 0.23 3.52 ± 0.49 3.57 ± 0.10 3 - 4.6 nS 3.22 10-5 6.44 10-5 9.66 10-5 1.29 10-4 1.61 10-4 Not determined nS' 1.96 10-3 2.00 10-3 2.03 10-3 2.06 10-3 2.09 10-3 pKS 5.82 ± 0.04 5.84 ± 0.04 5.84 ± 0.04 5.82 ± 0.05 5.82 ± 0.04 ∆pKS 6.14 ± 0.14 6.12 ± 0.14 6.15 ± 0.14 6.12 ± 0.12 6.12 ± 0.14 RMSE 0.03 0.03 0.03 0.03 0.03
![Fig. 3: Compilation of the pKa of the thiol function of thiol-containing organic molecules according to their molecular weight [66,77–79]](https://thumb-eu.123doks.com/thumbv2/123doknet/14785116.598402/34.892.119.791.134.613/compilation-function-containing-organic-molecules-according-molecular-weight.webp)
![Fig. 4: Comparison between log β of thiol-containing organic molecules and As(III) and log K MS relative to the number of coordinated thiols in the complexes [26,27,29,31–33,39,80,81]](https://thumb-eu.123doks.com/thumbv2/123doknet/14785116.598402/35.892.122.794.138.653/comparison-containing-organic-molecules-relative-number-coordinated-complexes.webp)