HAL Id: hal-00079740
https://hal-insu.archives-ouvertes.fr/hal-00079740
Submitted on 2 Nov 2011
HAL is a multi-disciplinary open access
archive for the deposit and dissemination of sci-entific research documents, whether they are pub-lished or not. The documents may come from teaching and research institutions in France or abroad, or from public or private research centers.
L’archive ouverte pluridisciplinaire HAL, est destinée au dépôt et à la diffusion de documents scientifiques de niveau recherche, publiés ou non, émanant des établissements d’enseignement et de recherche français ou étrangers, des laboratoires publics ou privés.
Evolution of organic matter indicators in response to
major environmental changes: the case of a formerly
cutover peatbog (Le Russey, Jura Mountains, France).
Laure Comont, Fatima Laggoun-Défarge, Jean-Robert Disnar
To cite this version:
Laure Comont, Fatima Laggoun-Défarge, Jean-Robert Disnar. Evolution of organic matter in-dicators in response to major environmental changes: the case of a formerly cutover peatbog (Le Russey, Jura Mountains, France).. Organic Geochemistry, Elsevier, 2006, 37, pp.1736-1751. �10.1016/j.orggeochem.2006.08.005�. �hal-00079740�
Evolution of organic matter indicators in response to major environmental changes: The case of a formerly cut-over peat bog (Le Russey, Jura Mountains, France)
Laure Comont, Fatima Laggoun-Défarge, Jean-Robert Disnar
ISTO, UMR 6113, CNRS-University of Orleans, BP 6759, 45067 Orleans cedex 2, France
Abstract
To assess whether the biochemical characteristics of peat can provide clues for past ecosystem changes or not, a study was carried out combining elemental analysis, micro-morphological counts and neutral monosaccharide determination of peat organic matter (OM) and the dominant living plants from a formerly cut-over peat bog in the Jura Mountains. Peat profiles (up to 50 cm depth) from two distinctive zones (bare peat, FRA and a regenerating stage, FRC) were compared with the reference profile (FRD) taken from an unexploited area of the bog. The results show contrasting OM composition along the profiles. In the upper sections of the FRD and FRC profiles, high C/N ratios and sugar contents (in the same range as in the source plants) and the large predominance of well preserved plant tissues indicate good preservation of primary biological inputs. In contrast, in peat from the FRA profile and deeper levels of the FRC profile, lower C/N ratios, lower amounts of sugars and a predominance of amorphous OM and mucilage suggest more extensive OM degradation. These features delineate a clear threshold between an uppermost “new” regenerating peat section and an “old” catotelm peat below. Nevertheless, even in the latter, the sugar contents remain
relatively high (>80 mg/g) compared with other organic and mineral soils. Analysis of typical peat-forming plants and of bulk peat and fine grained fractions allowed identification of the following source indicators: xylose and arabinose for Cyperaceae; rhamnose, galactose and mannose for mosses; and ribose (and to a lesser extent, hemicellulosic glucose) possibly for microbial synthesis.
1. Introduction
The potential of pristine peatlands to act as carbon sinks is now well established (Gorham, 1991). Nevertheless, peat bogs (especially Sphagnum-dominated ones) have frequently been perturbed by man to obtain fossil fuel ( [29] and [40] ), animal bedding, growth substrates for horticulture and agriculture ( [9] and [10] ) and therapies (Klöcking et al., 2004). In several countries, especially in northern Europe (e.g. Finland, Russia) and Canada where peat harvesting was very active, much effort is now deployed in reappraising these sites for their specific biodiversity and suitability for long term carbon storage. Thus, much work has been carried out to encourage the re-establishment of peat-forming vegetation, especially
Sphagnum mosses ( [Campeau and Rochefort, 1996] , [Grosvernier et al., 1997] , [Rochefort
et al., 1997] , [Buttler et al., 1998a] , [Boudreau and Rochefort, 1999] , [Tuittila et al., 1999] , [Lavoie et al., 2003] , [Price et al., 2003] and [Petrone et al., 2004] ). However, the outcome of this approach with respect to carbon balance remains difficult to predict ( [Francez et al., 2000] and [Waddington et al., 2003] ). Thus, in order to monitor peat re-accumulation and long term carbon sequestration in formerly exploited peatlands, it is essential to consider a wide range of indicators such as vegetation, gas fluxes, microbial communities and
Carbon dynamics in peatlands have been approached mainly by way of processes occurring at the surface, notably through measurements of CO2 and CH4 fluxes ( [Harriss et al., 1985] and [McNeil and Waddington, 2003] ) but little work has been done to ascertain vegetation
degradation occurring at depth. In this work, we applied bulk and molecular indicators to infer plant inputs and to identify biopolymer (bio-)degradation in response to natural and
anthropogenic environmental changes. Given the important part carbohydrates play in the constitution and metabolism of plants, particular emphasis was placed on their analysis. Till now there has been only a small amount of work on sugar production and preservation in ombrotrophic peat bogs ( [Morita and Montgomery, 1980] and [Morita, 1983] ). In addition, the carbohydrate content of peat samples was often determined through gross analytical approaches, such as the Van Soest method, which only allows the whole fraction of
hemicelluloses and celluloses to be quantified (e.g. Francez, 1991). The few studies that have been conducted at the molecular level did not deal with ombrotrophic peatlands. For example, Moers et al. (1990) determined the neutral monosaccharide abundance and composition of fine and gross fractions of red mangrove peat samples to identify their origin and degradation route. They also determined the monosaccharide composition of the organs of the main source organism, Rhizophora mangle. For similar purposes, Bourdon et al. (2000) analysed the neutral monosaccharide content of sediments from a tropical peaty marsh and the Cyperaceae growing on its border.
The present work follows a roughly similar approach, but focusses on an ombrotrophic bog where the accumulated peat derives mainly from mosses and sedges and where environmental conditions, particularly in terms of human impact, are quite different from those of mangroves and marshes. Based on the carbohydrate composition of the main plants growing in the bog, the major aims were first, to obtain information on the sugar content of plants that contributed to peat formation and second, to determine the fate of carbohydrates during the early stages of diagenesis. At the site, Le Russey, a formerly cut-over bog, where spontaneous regeneration took place, both peat cores (up to 50 cm depth) and dominant living plants have been
analysed. OM characteristics from two distinctive zones of the bog (bare peat and a
regenerating stage) were compared to a reference profile taken from an unexploited area of the peatland.
2. Experimental
2.1. Study site and sampling
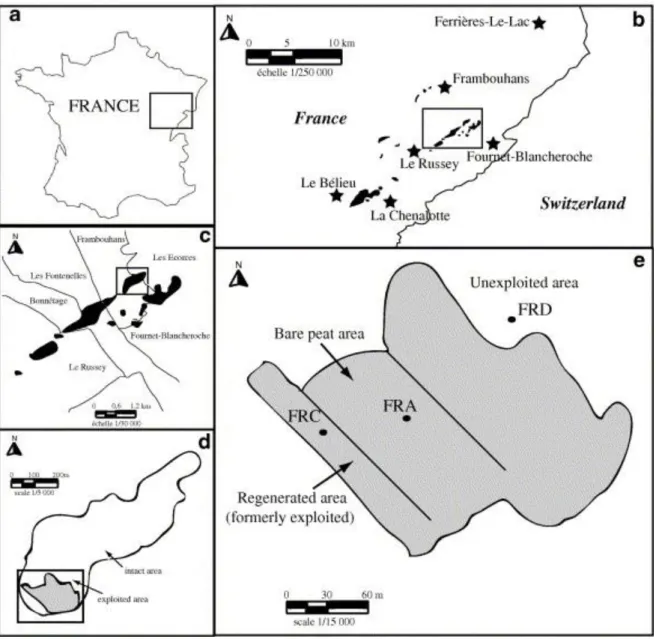
The Le Russey peatbog is located in the French Jura Mountains, at 820 m elevation (Fig. 1) on the Frambouhans and Ecorces communes. The regional climate is controlled mainly by oceanic, mountain and continental influences (Lacroix et al., 1999), with a mean annual precipitation of 1349 mm and strong annual changes in temperatures (around 14.6 °C in July and −2.4 °C in January). The total surface of the bog covers ca. 27 ha, of which more than 19 ha occur as a wooded bog. Active peat cutting (around 700–1000 m3/year) started in 1968 and was stopped in 1984. Subsequently, spontaneous regeneration took place and, at present, communities dominated by Sphagnum sp., Polytrichum strictum, P. commune, Eriophorum
Fig. 1. : Location of study site: (a) within France and Jura Mountains; (b and c) Le Russey peat bog within Jura peatlands; (d) exploited area within Le Russey peat bog; (e) location of sampling areas FRA and FRC (bare peat and regenerating area, respectively). FRD =
The uppermost 50 cm of the peat were cored in two distinctive zones of the bog: a bare peat area (FRA) and a regenerating stage (FRC). These were compared with a reference profile (FRD) taken from an intact area of the bog where no peat extraction occurred (Fig. 1). The cores were taken in November 2003, using a sampler which allowed undisturbed cores to be obtained (Buttler et al., 1998b). In the three zones, triplicates were taken and six slices (5 cm thick) were sampled at different depths in each core (0–5 cm, 5–10 cm, 12.5–17.5 cm, 22.5– 27.5 cm, 32.5–37.5 cm and 42.5–47.5 cm). Hand picked samples of the dominant vegetation, composed of Sphagnum fallax, Polytrichum strictum, Eriophorum vaginatum and E.
angustifolium, were isolated. All samples were stored at 4 °C until analysis.
Half of each core section was wet sieved at 200 μm under a positive pressure using water circulation (Gobat et al., 1991). The fine grained fractions (< 200 μm) were recovered, dried and weighed. The latter fractions, as well as bulk peat, were subjected to elemental analysis (C, N), whereas only bulk peat samples were analysed using microscopy. The cellulose and hemicellulose sugars of both bulk peat and fine grained fractions were identified and
quantified using gas chromatography (GC). The living moss and sedge samples were analysed in the same way.
2.2. C and N analysis
C and N contents were determined by combustion of dried and crushed samples at 1100 °C, using a CNS-2000 LECO apparatus. Due to the absence of carbonate, total carbon was assumed to be total organic carbon (TOC). C/N ratios were corrected for C and N atomic weights. The elemental composition of bulk peat was determined for the three replicates, whereas only the replicates selected for molecular studies were analysed for the fine grained fractions.
2.3. Micromorphological analysis
Micromorphological identification and quantification of peat micro-remains was carried out using a DMR XP Leica photonic microscope under transmitted light. Wet bulk samples were mounted as smear slides and analysed with × 20 and × 50 objectives. The surfaces of the main categories were counted (in relative numerical frequency) through a grid used as a surface unit and placed under the microscope; 3000–5000 items per sample were counted, with an estimated error of ca. 10% (Noël, 2001).
2.4. Sugar analysis
Neutral sugar analysis was carried out in two steps according to a procedure adapted from previous work ( [Bethge et al., 1996] , [Oades et al., 1970] , [Modzeleski et al., 1971] and [Cowie and Hedges, 1984] ). The first step, which comprises a phase of soaking with 24 N H2SO4, allows hydrolysis of both cellulose and hemicellulose(s). The second, consisting of the same procedure without 24 N H2SO4 treatment, yielded only hemicellulose monomers. Consequently, the cellulose content was calculated by subtraction of the results obtained for the first step from those obtained for the second step.
The operating procedure for total sugar analysis can be summarized as follows: 1 ml of 24 N H2SO4 was added to 30 mg of plant material or 100 mg of dried sediment in a Pyrex® tube. After 12 h at room temperature, the samples were diluted to 1.2 M H2SO4. The tubes were closed tightly under vacuum and heated at 100 °C for 4 h. After cooling, deoxy-6-glucose
(400 μg in water) was added as internal standard (Wicks et al., 1991). The samples were subsequently neutralised with CaCO3. The precipitate was removed by centrifugation and the supernatant was evaporated to dryness. Then, the sugars were dissolved in CH3OH and the solution was purified by centrifugation. After the solution was transferred to another vessel, the solvent was evaporated under vacuum. The sugars were dissolved in pyridine, silylated (Sylon BFT, Supelco) and analysed immediately using a Perkin–Elmer gas chromatograph fitted with a 25 m × 0.25 mm i.d. CPSil5CB column (0.25 μm film thickness) and a flame ionization detector. The oven temperature was raised from 60 °C to 120 °C at 30 °C min−1, maintained there for 1 min, and raised to 240 °C at 3 °C min−1 and finally at 20 °C min−1 to 310 °C, at which it was maintained for 10 min. The injector split was off at the start and turned on after 2 min. The injector was maintained at 240 °C and the detector at 300 °C. A mixture of eight monosaccharides (ribose, arabinose, xylose, rhamnose, fucose, glucose, mannose and galactose) was used as external standard for compound identification through peak retention times and for individual response coefficient determination. Replicate analyses gave an analytical precision < 5% for neutral sugar analysis of plant material and between 10% and 15% for peat samples.
3. Results
3.1. C and N contents
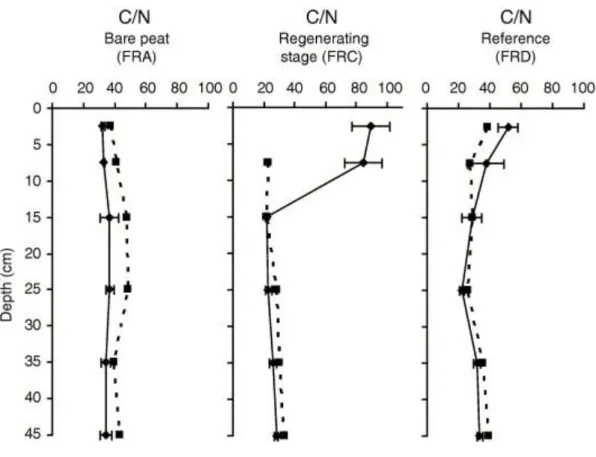
TOC contents are high throughout the sample set (46–56%; Table 1), as usually observed for terrestrial OM accumulation without any significant dilution by inorganic inputs. In the bare peat situation (FRA), the C/N atomic ratios of the bulk peat remain rather constant, around 30, along the profile (Fig. 2). Compared to the bulk peat, the fine grained fractions display high ratios, especially around a depth of 15 and 25 cm where they exceed 40. In the regenerating stage (FRC), as well as in the reference profile (FRD), C/N ratios are much higher in the uppermost levels (> 50) but decrease downwards to 20–30. This decrease is sharper in FRC than in FRD (Fig. 2). The ratios for the fine grained fraction remain nearly constant along these two profiles.
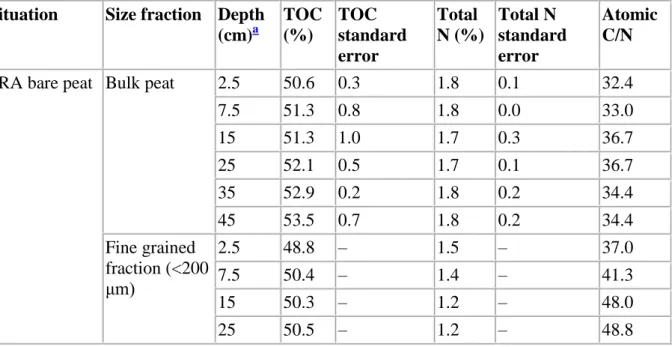
Table 1. C and N contents of bulk peat and fine-grained fraction in three profiles (FRA bare peat, FRC regenerating stage, FRD reference) from Le Russey bog
Situation Size fraction Depth (cm)a TOC (%) TOC standard error Total N (%) Total N standard error Atomic C/N
FRA bare peat Bulk peat 2.5 50.6 0.3 1.8 0.1 32.4
7.5 51.3 0.8 1.8 0.0 33.0 15 51.3 1.0 1.7 0.3 36.7 25 52.1 0.5 1.7 0.1 36.7 35 52.9 0.2 1.8 0.2 34.4 45 53.5 0.7 1.8 0.2 34.4 Fine grained fraction (<200 μm) 2.5 48.8 – 1.5 – 37.0 7.5 50.4 – 1.4 – 41.3 15 50.3 – 1.2 – 48.0 25 50.5 – 1.2 – 48.8
Situation Size fraction Depth (cm)a TOC (%) TOC standard error Total N (%) Total N standard error Atomic C/N 35 52.4 – 1.6 – 39.3 45 52.3 – 1.4 – 43.3 FRC regenerating stage Bulk peat 2.5 43.7 0.9 0.6 0.1 89.5 7.5 60.0 2.1 0.8 0.1 84.8 15 50.7 1.2 2.7 0.1 22.1 25 53.4 2.1 2.7 0.1 23.1 35 54.8 0.6 2.5 0.2 26.0 45 56.5 0.5 2.3 0.1 28.3 Fine grained fraction (<200 μm) 2.5 nd – nd – nd 7.5 45.5 – 2.3 – 22.9 15 46.9 – 2.5 – 21.6 25 51.8 – 2.1 – 28.4 35 50.1 – 1.9 – 30.1 45 53.5 – 1.9 – 33.5
FRD reference Bulk peat 2.5 48.2 3.6 1.1 0.0 51.5
7.5 51.1 0.3 1.7 0.5 37.6 15 50.8 1.8 2.1 0.5 28.7 25 51.9 0.5 2.7 0.2 22.6 35 53.4 0.4 2.0 0.2 31.7 45 55.0 1.3 1.9 0.1 33.6 Fine grained fraction (<200 μm) 2.5 47.8 – 1.5 – 38.5 7.5 48.1 – 2.0 – 27.6 15 49.2 – 2.0 – 28.6 25 49.1 – 2.2 – 25.8 35 51.8 – 1.7 – 35.5 45 52.1 – 1.6 – 39.1 a
Fig. 2. : Mean depth profiles of atomic C/N ratio for the three studied areas (dotted line = fine grained fraction and full line = bulk peat).
3.2. Micromorphological characteristics
Light microscopy observations of the bulk peat smear slides show various fragments of plant organs, amorphous material and microorganisms (Fig. 3; Plate 1):
a. The primary plant remains either derive from vascular plants, particularly Cyperaceae cell walls (Plate 1c), or mosses (Plate 1a and d). The latter consist mainly of (i) characteristic Sphagnum leaf tissues with still well recognisable transluscent chlorocysts and hyalocysts (Plate 1a) and (ii) polytric-derived leaf tissues characterised by dark brown elongated polygonal cells (Plate 1d). According to their intrinsic chemical composition and cell wall structure, the morphology of tissues may be more or less affected by biodegradation during early diagenesis. Thus, based on morphological features, two classes of tissues are distinguished: well-preserved tissues (Plate 1a–d) with unaltered original biostructure and
structureless tissues (Plate 1f) where the cell wall structure is less apparent.
b. Undetermined plant tissues without characteristic biostructures that can be attributed to specific plant sources. They may be either well preserved (Plate 1b) or structureless (Plate 1f).
c. Amorphous organic matter (Plate 1g–h) consisting of structureless intracellular precipitates of humic colloid gels (Styan and Bustin, 1983) and of plant tissues whose structural characteristics have been completely lost.
d. Mucilage (Plate 1e, h) consisting of slimy, gummy and translucent substances present as organic lining with no internal structure and finely dispersed over the slides. The mucilage is likely synthesised, at least partly, from the in situ microbial community. In fact, in many environments, it has been identified as extracellular polysaccharide secretions from bacteria, fungi and/or plant roots ( [Leppard et al., 1977] , [Decho, 1990] , [Défarge et al., 1996] and [Laggoun-Défarge et al., 1999a] ).
e. Abundant tangled masses of melanised fungal hyphae (Plate 1e) often associated with decayed plant rootlets. They are more abundant at depth, particularly in the bare peat profile.
f.
Microorganisms represented mainly by algae and amoebae (Plate 1e) and, more rarely, by diatoms and zooclast remains.
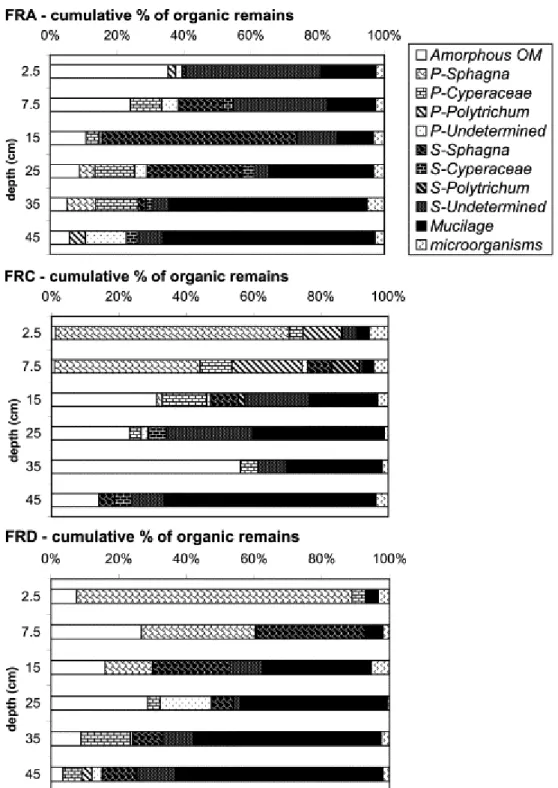
Fig. 3. : Mean depth evolution of % of organic micro remains in bulk peat using photonic microscopy (transmitted light; FRA = bare peat, FRC = regenerating stage, FRD = reference). P = well preserved tissue. S = structureless tissue.
Plate 1. : Main organic micro remains identified using photonic microscopy in transmitted light for bulk peat samples of Le Russey bog: (a) well preserved tissue derived from Sphagnum leaf tissue showing characteristic chlorocysts and hyalocysts; (b) undetermined tissue; (c) Cyperaceae tissue; (d) Polytrichum leaf tissue showing characteristic elongated cells; (e) mucilage (m), amoebae (am) and fungal hyphae (h); (f) slightly degraded undetermined tissue and amorphous OM (aom); (g, h) amorphous OM flakes (aom) and mucilage (m).
The depth related changes in the proportion of the above organic macrofossils are presented in Fig. 3. In the bare peat (FRA) section, the peat is mainly composed of amorphous OM and undetermined structureless tissues in the uppermost 15 cm. It is dominated by morphologically degraded tissues derived from Sphagna about the middle of the profile and by rather high proportions of inferred microbial secretions, namely mucilage, in the lower levels. These morphological characteristics indicate a highly humified peat. In the regenerating profile (FRC), there is a
clear threshold between an uppermost section (0–15 cm) corresponding very likely to a “new” regenerating peat and an “old” catotelm humified peat below. The “new” peat is characterised by the presence of well preserved tissues derived from mosses and vascular plants, i.e. Sphagna, polytrics and Cyperaceae. In contrast, the underlying “old” peat shows features characteristic of intensive OM degradation, with high proportions of amorphous OM and mucilage. This morphological composition is similar to that of the FRA profile. In the reference FRD profile, the uppermost peat OM is composed mainly of well preserved Sphagnum-derived tissues gradually being replaced downcore by structureless tissue and then by mucilage. This likely indicates greater diagenesis with increasing depth.
3.3. Sugar contents and distributions
3.3.1. Peat forming plants
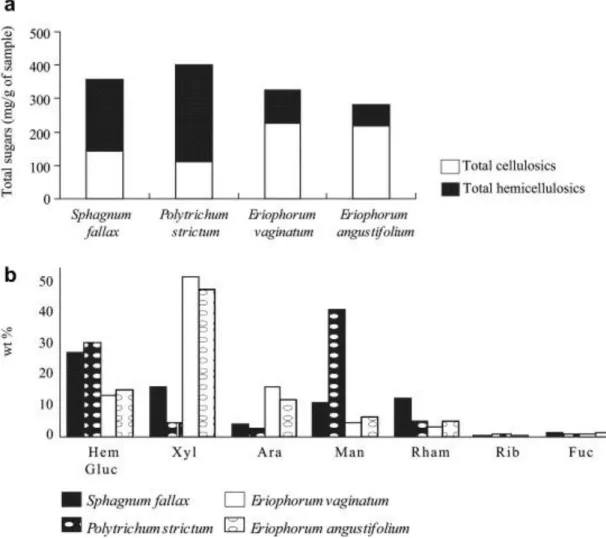
The carbohydrate composition of the main plants growing in the Le Russey peatland was determined for two mosses (Polytrichum strictum and Sphagnum fallax) and two sedges (E. vaginatum and E. angustifolium). The results are presented in Fig. 4. Total sugars correspond to the sum of all cellulose and hemicellulose
monosaccharides, glucose being the highly dominant or even the exclusive component of cellulose. The total sugar contents of the mosses are slightly higher (around 400 mg/g) than those of sedges (around 300 mg/g). In contrast to the two mosses, which are richer in hemicelluloses than in cellulose (ca. 210–290 mg/g vs. 110–140 mg/g), the sedges are much richer in cellulose than in hemicellulose (ca. 220 mg/g vs. 60–100 mg/g). The distribution of the hemicellulose monosaccharide content (wt%, Fig. 4) also shows a clear difference between these plants. The dominant hemicellulose monosaccharides are galactose (28 wt%) and rhamnose (13 wt%) in Sphagnum fallax [as in eight other Sphagnum species (N. Lottier, unpublished data)], mannose (42 wt%) in Polytrichum and xylose (48–52 wt%) and to a lesser extent arabinose (12–1 wt%) in the two Cyperaceae species.
Fig. 4. : Identification and quantification of sugars in the dominant peat forming plants (Sphagnum, Polytrichum and Eriophorum species) from Le Russey bog: (a) abundance of total sugars (mg/g); (b) distributions of hemicellulose sugars (H-glucose, xylose, arabinose, mannose, rhamnose, ribose, fucose and galactose in wt%).
3.3.2. Peat samples
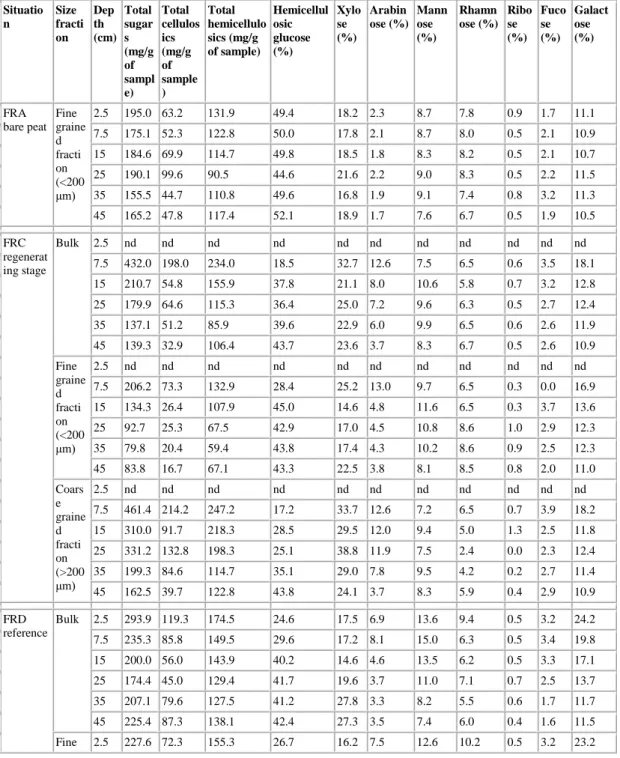
In the FRC and FRD cores, both bulk peat samples and the corresponding fine-grained fraction (< 200 μm) were analysed for their neutral monosaccharide compositions. In the FRA core, only the fine grained fraction was analysed as it was dominant (45 wt% vs 12 and 19 wt% for FRC and FRD, respectively). The sugar contents of the coarse-grained fraction (>200 μm) were calculated as the difference between those of the bulk peat and the fine grained fraction (Table 2, Fig. 5). The upper section (0–5 cm depth) of the FRC core is missing, due to sampling problems.
Table 2. Depth evolution of neutral sugar yields and concentrations in bulk peat and fine grained fraction in three areas of Le Russey bog
Situatio n Size fracti on Dep th (cm) Total sugar s (mg/g of sampl e) Total cellulos ics (mg/g of sample ) Total hemicellulo sics (mg/g of sample) Hemicellul osic glucose (%) Xylo se (%) Arabin ose (%) Mann ose (%) Rhamn ose (%) Ribo se (%) Fuco se (%) Galact ose (%) FRA bare peat Fine graine d fracti on (<200 μm) 2.5 195.0 63.2 131.9 49.4 18.2 2.3 8.7 7.8 0.9 1.7 11.1 7.5 175.1 52.3 122.8 50.0 17.8 2.1 8.7 8.0 0.5 2.1 10.9 15 184.6 69.9 114.7 49.8 18.5 1.8 8.3 8.2 0.5 2.1 10.7 25 190.1 99.6 90.5 44.6 21.6 2.2 9.0 8.3 0.5 2.2 11.5 35 155.5 44.7 110.8 49.6 16.8 1.9 9.1 7.4 0.8 3.2 11.3 45 165.2 47.8 117.4 52.1 18.9 1.7 7.6 6.7 0.5 1.9 10.5 FRC regenerat ing stage Bulk 2.5 nd nd nd nd nd nd nd nd nd nd nd 7.5 432.0 198.0 234.0 18.5 32.7 12.6 7.5 6.5 0.6 3.5 18.1 15 210.7 54.8 155.9 37.8 21.1 8.0 10.6 5.8 0.7 3.2 12.8 25 179.9 64.6 115.3 36.4 25.0 7.2 9.6 6.3 0.5 2.7 12.4 35 137.1 51.2 85.9 39.6 22.9 6.0 9.9 6.5 0.6 2.6 11.9 45 139.3 32.9 106.4 43.7 23.6 3.7 8.3 6.7 0.5 2.6 10.9 Fine graine d fracti on (<200 μm) 2.5 nd nd nd nd nd nd nd nd nd nd nd 7.5 206.2 73.3 132.9 28.4 25.2 13.0 9.7 6.5 0.3 0.0 16.9 15 134.3 26.4 107.9 45.0 14.6 4.8 11.6 6.5 0.3 3.7 13.6 25 92.7 25.3 67.5 42.9 17.0 4.5 10.8 8.6 1.0 2.9 12.3 35 79.8 20.4 59.4 43.8 17.4 4.3 10.2 8.6 0.9 2.5 12.3 45 83.8 16.7 67.1 43.3 22.5 3.8 8.1 8.5 0.8 2.0 11.0 Coars e graine d fracti on (>200 μm) 2.5 nd nd nd nd nd nd nd nd nd nd nd 7.5 461.4 214.2 247.2 17.2 33.7 12.6 7.2 6.5 0.7 3.9 18.2 15 310.0 91.7 218.3 28.5 29.5 12.0 9.4 5.0 1.3 2.5 11.8 25 331.2 132.8 198.3 25.1 38.8 11.9 7.5 2.4 0.0 2.3 12.4 35 199.3 84.6 114.7 35.1 29.0 7.8 9.5 4.2 0.2 2.7 11.4 45 162.5 39.7 122.8 43.8 24.1 3.7 8.3 5.9 0.4 2.9 10.9 FRD reference Bulk 2.5 293.9 119.3 174.5 24.6 17.5 6.9 13.6 9.4 0.5 3.2 24.2 7.5 235.3 85.8 149.5 29.6 17.2 8.1 15.0 6.3 0.5 3.4 19.8 15 200.0 56.0 143.9 40.2 14.6 4.6 13.5 6.2 0.5 3.3 17.1 25 174.4 45.0 129.4 41.7 19.6 3.7 11.0 7.1 0.7 2.5 13.7 35 207.1 79.6 127.5 41.2 27.8 3.3 8.2 5.5 0.6 1.7 11.7 45 225.4 87.3 138.1 42.4 27.3 3.5 7.4 6.0 0.4 1.6 11.5 Fine 2.5 227.6 72.3 155.3 26.7 16.2 7.5 12.6 10.2 0.5 3.2 23.2
graine d fracti on (<200 μm) 7.5 160.0 44.3 115.7 34.5 12.6 6.5 16.4 6.2 0.7 5.1 17.9 15 162.7 38.7 123.9 39.2 12.3 4.0 14.7 7.2 0.6 4.0 18.1 25 129.3 27.9 101.4 44.4 13.3 3.2 12.5 8.4 0.8 3.0 14.5 35 125.2 22.2 102.9 46.7 19.7 2.3 9.7 6.6 0.2 2.1 12.7 45 132.2 24.2 108.1 48.9 20.7 2.5 8.0 6.3 0.2 2.0 11.4 Coars e graine d fracti on (>200 μm) 2.5 348.5 158.0 190.3 23.0 18.6 6.4 14.5 8.8 0.5 3.2 25.0 7.5 253.3 95.7 157.6 28.4 18.3 8.5 14.7 6.3 0.5 3.0 20.3 15 235.9 72.7 163.2 41.3 16.7 5.2 12.5 5.2 0.4 2.6 16.2 25 215.7 60.6 155.0 39.2 25.4 4.3 9.7 5.9 0.6 2.0 13.0 35 262.8 118.6 144.2 37.5 33.3 3.9 7.2 4.7 0.9 1.4 11.0 45 280.3 124.5 155.8 38.6 31.1 4.1 7.0 5.8 0.6 1.3
Fig. 5. : Depth profiles of total cellulose and hemicellulose (mg/g) and distributions of hemicellulose sugars (H-glucose, xylose, arabinose, mannose, rhamnose, ribose, fucose, wt%) in fine fraction (dotted line) and coarse fraction (full line) in the three areas of Le Russey bog (FRA = bare peat, FRC = regenerating stage, FRD = reference).
In the bare peat (FRA), the total sugar contents of the fine grained fraction vary from 195 mg/g at the top to 165.2 mg/g at the bottom of the core (Table 2). Although these values are slightly lower than those for the FRC and FRD cores in the uppermost sections, they are much higher in the deeper part of the core. Relative and absolute hemicellulose sugar contents show almost constant values all along the profile (Fig. 5), except at 25 cm depth where a slight increase in the amount of xylose and total cellulose sugars is observed.
In the regenerating profile (FRC), the total sugar content of the bulk peat samples strongly decreases from ca. 432 mg/g at 5–10 cm to ca. 210 mg/g at 12.5–17.5 cm (Table 2). Below, the amount of sugars continues to decrease with increasing depth, but more gradually. In the reference profile (FRD), the total sugar content first decreases progressively from 294 mg/g to 174 mg/g between 0–5 cm and 22.5–27.5 cm. Then, it increases slightly to 225 mg/g near the base of the profile (Table 2). In both the FRC and FRD cores, bulk peat samples contain higher amounts of total sugars than the fine grained fractions (around 50% in FRC and 30% in FRD).
Moreover, total hemicellulose contents are higher than those of total cellulose sugars in the bulk peat and the fine grained fractions (Table 2). However, the relative percentages of individual hemicellulose sugars (wt%; Fig. 5) show different features when comparing the coarse and the fine grained fractions. The latter are slightly richer in H-glucose, rhamnose, galactose, mannose and ribose and contain lower amounts of arabinose and xylose than the coarse grained fractions. Downwards, a high variability in the distribution of individual sugars is observed for the FRC profile, whereas a downcore increase in xylose and H-glucose and a decrease in mannose and arabinose are recorded in the FRD profile, for both fractions.
4. Discussion
4.1. Carbohydrate dynamics
Most of the carbohydrates of plants, including the peat forming plants studied here, occur as the common structural polymers cellulose and hemicellulose (Fig. 4). In contrast to cellulose, which is dominantly or even exclusively made up of glucose, hemicelluloses are usually copolymers of at least two of the following
monosaccharides: glucose, galactose, mannose, xylose, arabinose, rhamnose, and fucose (Aspinall, 1983). Despite the rather limited number of combinations that can be made with these few compounds, the variation in the composition of
hemicellulose from one species to another can provide a plant source signature. This assessment is illustrated by the results of the carbohydrate analyses of the main plants of the bog (Fig. 4). The richness of sedges in xylose has already been underlined in several studies ( [Wicks et al., 1991] and [Bourdon et al., 2000] ). However, to our knowledge, only Popper and Fry (2003) mentioned the occurrence of high
proportions of monosaccharides such as galactose, rhamnose and mannose in the hemicellulose of the primary cell walls of bryophytes.
For the three cores, sugar analysis was performed on the fine fraction (< 200 μm). The rationale for such an analytical choice is that fine fractions should give a clearer picture of organic matter dynamics than coarse fractions mostly made up of only slightly degraded plant debris. In contrast, fine particles should represent a rather advanced stage of biodegradation of inherited material, admixed with products of
secondary microbial production. These points are further discussed in the following section. However, to avoid major uncertainties about the differences that can exist between the bulk and the fine fractions, sugars were determined for both types of samples from two out of the three cores, namely FRD and FRC.
A striking result is the high level of total (cellulose and hemicellulose) sugars in all the samples. Total sugar content ranges from 500 to 80 mg/g, the highest values being found in the coarse fraction from upper peat sections and the lowest ones in the fine fraction from deep samples (Table 2; Fig. 5). For comparison, these figures are much higher than those (< 80 mg/g) determined by Morita and Montgomery (1980)
for Canadian peats. Such a good preservation contradicts paradigms regarding the rapid consumption of carbohydrates in the sedimentary environment, peatbogs included (e.g. Pancost et al., 2002).
The high sugar contents (in the same range as the plant sources) in the upper sections of both FRD (reference) and FRC (regenerating stage) cores reveal a high
preservation of biological inputs (Table 2). In these two cores and all along the profiles, the total sugar contents is about twice as high in the coarse than in the fine fraction, indicating increasing carbohydrate consumption with plant material fragmentation. This degradation process is also responsible for a preferential decrease in cellulosic sugars relative to hemicellulose ones. This preferential consumption is observed first in the fine fractions relative to the coarse ones and second with increasing depth in the fine fraction of both cores (Table 2).
Accordingly, a rather good preservation of plant debris can explain high amounts of sugars with high proportions of cellulose in the coarse fraction from deep sections, especially in the reference FRD profile. The apparently faster degradation of cellulose sugars relative to hemicellulose ones indicates that cellulose structural decomposition precedes its consumption. Between both processes, the destructured cellulose probably contributes to an apparent enrichment in the hemicellulose carbohydrate pool, particularly hemicellulose glucose. Also contributing to the apparent hemicellulose pool are carbohydrates of microbial origin, mainly in the form of (glucose-rich) extracellular polysaccharidic secretions ( [Leppard et al., 1977] , [Decho, 1990] , [Défarge et al., 1996] and [Laggoun-Défarge et al., 1999a] ). These conclusions partly disagree with those of [Moers et al., 1989] and [Moers et al., 1990] , who argued that the differences in relative sugar contents between the coarse grained and fine grained peat fractions could be explained by the balance of microbial vs. vascular plant input. The same authors interpreted the relatively large amounts of total cellulose sugars and the high proportions of xylose and arabinose in the coarse fraction as inherited from vascular plant polymers, whereas the relatively high proportion of rhamnose, galactose, mannose, fucose, ribose and hemicellulosic glucose in the fine fraction was probably due to bacteria, algae and/or fungi. Our data are in good agreement with these assessments when considering xylose and arabinose as indicators of Cyperaceae input. However, in the Le Russey peat, sugars such as galactose, rhamnose and mannose are primarily markers of mosses (Fig. 4) rather than of microbial species, as in the Florida peat of Moers et al. (1989). Thus, the higher relative amounts of these compounds in the fine fractions (Fig. 5) probably reflect a greater proportion of carbohydrates inherited from mosses relative to sedges (xylose and arabinose) rather than microbial input. If so, galactose and rhamnose, produced by Sphagnum mosses, and mannose, produced in high proportions by
Polytrichum mosses (Fig. 4), cannot be used as microbial markers in peat bogs. Similarly, glucose is at least partly inherited from cellulose “destructurisation”, such that only fucose and ribose can confidently be used to evaluate in situ microbial production. Another notable result of this study is that the differential biodegradation of cellulose and hemicelluloses makes the ratio of the two biopolymers a good indicator of biodegradation.
4.2. Depth evolution of organic matter indicators
The higher C/N values in the fine fractions than in the bulk peat samples of all cores (Table 1) are possibly due to the loss of soluble N species during the isolation of the fine fractions by wet sieving. This explanation is fully supported by the
determination of rather high amounts of NH3 in the interstitial water of a few samples (Comont and Gautret, unpublished data). Because of this loss of part of the total N content, the C/N value for the fine fractions are not considered further. Nevertheless, it is worth noting that the greatest discrepancy in the C/N ratio between a bulk sample and the equivalent fine fraction occurs in the uppermost section of the regenerating stage (FRC core; Fig. 2).
The high C/N values in the bulk fraction of the uppermost level of the reference FRD profile (>50; Table 1; Fig. 2) are typical of inherited plant material rich in non N-containing compounds such as the polysaccharides cellulose and hemicellulose(s). In the same way, the progressive decrease in bulk peat C/N values with increasing depth is likely due to the degradation of these biopolymers ( [Ertel and Hedges, 1985] , [4] ,
[Kristensen et al., 1999] , [Laggoun-Défarge et al., 1999b] , [Müller and Mathesius, 1999] and [Ortiz, 2004] ). This classical explanation is consistent with the results of carbohydrate analysis (cf. above) and is fully supported by micromorphological observations (Fig. 3); the latter are characterised by a decrease in the proportion of well preserved Sphagnum tissue from 80% at 0–5 cm to 14% at 12.5–17.5 cm.
Downcore, this plant tissue is gradually replaced first by structureless tissue and later, mainly by mucilage. This evolution is accompanied by the progressive decrease in cellulose sugar content in the coarse fraction (Fig. 5). These OM indicators
complement the results of carbohydrate dynamics and depict typical OM diagenetic evolution with increasing depth. At 25 cm, a relatively low amount of total cellulose sugars (61 mg/g) is recorded for the coarse fraction, and the bulk peat contains high amounts of amorphous OM and mucilage. In addition, unlike the upper sections, this level contains a very low content of Sphagnum-derived tissue (Fig. 3) and a relatively high amount of xylose (Fig. 5), which is characteristic of Cyperaceae plants (Fig. 4). These features likely indicate a change in vegetation and extensive OM degradation, which might have been provoked by a lowering of the water table during peat exploitation in a nearby part of the bog.
In the bare peat FRA profile, the C/N ratio remains constant and much lower (about 35) than that in the upper sections of the two other profiles (Fig. 2), clearly reflecting the absence of the most recent peat layers. Despite a change in vegetation (and thus also in environment) revealed by the presence of higher proportions of Sphagnum-derived tissues between 10 cm and 30 cm, the predominance of structureless tissue, mucilage and amorphous OM flakes all along the core is diagnostic of uniformly intensive OM degradation (Fig. 3). The sugar concentration profiles show very limited variation with depth; exceptions are xylose and total cellulose contents, which
display higher values around 25 cm.
In contrast to the FRA profile, the bulk peat from the upper part of the FRC profile displays high C/N ratio values comparable to those found in the reference profile (FRD) or even higher, i.e. up to ca. 80 (Fig. 2). However, a much lower value (30) occurs in the immediately underlying level at 15 cm. This considerable change indicates that these two sections are located roughly on either side of the boundary between the old catotelm peat and the material accumulated since the beginning of the regeneration. The minor degradation of the upper section peat is highlighted by microscopic observations which show abundant well preserved tissue derived from
Sphagnum, Polytrichum and Cyperaceae plants (Fig. 3). This regenerated peat thus appears more heterogeneous than the upper section of the reference profile (FRD), which is mostly made of Sphagnum derived tissue. These elemental analysis data and micromorphological observations are fully supported and supplemented by the results of the sugar analysis. In particular, the evolution with depth of total cellulose sugars confirms the subdivision of the FRC profile into two distinct sections with higher sugar content in the “new” peat than in the “old” one (Fig. 5).
Despite the large difference in the amounts of cellulose and hemicellulose
carbohydrates between the coarse and the fine fractions in both the FRC and FRD cores, there are only limited differences in the distribution of individual
hemicellulose sugars (Table 2). However, these differences probably do reflect true compositional differences between the two fractions; for example, in the reference FRD profile, slightly higher relative amounts of xylose and arabinose occur in the coarse fraction, consistent with the greater lability of these compounds than other (dehydroxy-) sugars in Cyperaceae tissues (Opsahl and Benner, 1999) and other peat-forming plants. Thus, the discrepancy in sugar composition between FRC coarse- and fine-grained fractions is mostly attributable to more limited alteration of the plant-inherited material, beginning with Cyperaceae tissue.
5. Conclusions
Combined carbohydrate analysis, C/N ratio determinations and micromorphological observations conducted on the peat profiles from a formerly cut-over peat bog allowed us to obtain insights into changes in OM sources and the dynamics of inherited biopolymers during natural regeneration. The most significant observations are as follows:
The whole sample set contains high amounts of total (cellulose and hemicellulose) sugars (80–500 mg/g). This result contradicts accepted ideas about the fast
consumption of carbohydrates in modern environments, peatlands included. Such a good carbohydrate preservation provides additional information on past
environmental changes in bogs and their consequence in terms of OM recycling or storage.
The differential biodegradation of cellulose and hemicelluloses with increasing depth between both size fractions makes the ratio of the two biopolymers a good indicator of diagenetic alteration.
of Cyperaceae input to peat, the study showed that galactose, rhamnose and mannose are mostly inherited from mosses in ombrotrophic peatbogs. In such a case, these latter compounds must not be attributed to (in situ) microbial production. In contrast, fucose and ribose, present at low levels but in relatively higher proportions in the fine fraction, could be possible markers of microbial synthesis.
In regenerating areas, depth patterns of bulk and molecular OM composition show a clear threshold between an uppermost “new” peat and an “old” catotelm peat below. The upper section is characterised by high C/N ratios and sugar contents and a
predominance of well preserved plant tissues, whereas the deeper one is characterised by lower C/N ratios and sugar amounts and a predominance of amorphous OM and mucilage, indicating more pronounced degradation.
Acknowledgements
This paper is a contribution from the RECIPE project (reconciling commercial exploitation of peat with biodiversity in peatland ecosystems). RECIPE is partly supported by the European Commission, Directorate I under the programme “Energy, Environment and Sustainable Development (No. EVK2-2002-00154) and partly, for the Swiss partners, by OFES (the Swiss Federal Office for Education and Science). We gratefully acknowledge analytical assistance provided by N. Lottier and M. Hatton and are grateful to E.L. McClymont and D. Mauquoy for constructive comments.
References
Aspinall, 1983 G.O. Aspinall, Academic Press, New York (1983).
Bethge et al., 1996 P.O. Bethge, C. Holmström and S. Juhlin, Quantitative gas chromatography of mixtures of simple sugars. Svensk Papperstidning
arg, 69 (1996), pp. 60–63.
Boudreau and Rochefort, 1999 S. Boudreau and L. Rochefort, Etablissement de Sphaignes réintroduites sous diverses communautés végétales recolonisant les tourbières après l’exploitation. Ecologie, 30 (1999), pp. 53–62.
Bourdon, 1999 Bourdon, S., 1999. Approche micromorphologiques et moléculaires de la diagenèse précoce de la matière organique dans une tourbe à Cypéracées en milieu tropical (Tritrivakely, Madagascar). Implication paléoenvironnementales. Ph.D. Thesis, University of Orleans, 178 pp..
Bourdon et al., 2000 S. Bourdon, F. Laggoun-Défarge, J.R. Disnar, O. Maman, B. Guillet, S. Derenne and C. Largeau, Organic matter sources and early diagenetic degradation in a tropical peaty marsh (Tritrivakely, Madagascar). Implications for environmental reconstruction during the Sub-Atlantic. Organic
Geochemistry, 31 (2000), pp. 421–438.
Buttler et al., 1998a A. Buttler, P. Grosvernier and Y. Matthey, Development of
Sphagnum fallax diaspores on bare peat with implications for the restoration of
Buttler et al., 1998b A. Buttler, P. Grosvernier and Y. Matthey, A new sampler for extracting undisturbed surface peat cores for growth pot experiments. New
Phytologist, 140 (1998), pp. 355–360.
Campeau and Rochefort, 1996 S. Campeau and L. Rochefort, Sphagnum
regeneration on bare peat surfaces: field and greenhouse experiments. Journal of
Applied Ecology, 33 (1996), pp. 599–608.
Camporese et al., 2004 Camporese, M., Putti, M., Salandin, P., Teatini, P., 2004. Finite element model of swelling/shrinkage and hydrology in a peatland south of Venice. Abstract. “Wise Use of Peatlands”, In: Proceedings of the 12th International Peat Congress, Tampere, p. 263..
Caron, 2004 Caron, J., 2004. Defining new aeration and capillary rise criteria to assess the quality of growing media. Abstract. “Wise Use of Peatlands”, In: Proceedings of the 12th International Peat Congress, Tampere, p. 221..
Chapman et al., 2003 S. Chapman, A. Buttler, A.J. Francez, F. Laggoun-Défarge, H. Vasander, M. Schloter, J. Combe, P. Grosvernier, H. Harms, D. Epron, D. Gilbert and E. Mitchell, Exploitation of northern peatlands and biodiversity maintenance: a conflict between economy and ecology. Frontiers in Ecology and the
Environment, 1 (2003), pp. 525–532.
Cowie and Hedges, 1984 G.L. Cowie and J.I. Hedges, Carbohydrate sources in a coastal marine environment. Geochimica et Cosmochimica Acta, 48 (1984), p. 2075.
Decho, 1990 A.W. Decho, Microbial exopolymer secretions in ocean environments: their role(s) in food webs and marine processes. Annual Review of Oceanography
and Marine Biology, 28 (1990), pp. 73–153.
Défarge et al., 1996 C. Défarge, J. Trichet, A.M. Jaunet, M. Robert, J. Tribble and F.J. Sansone, Texture of microbial sediments revealed by cryo-scanning electron microscopy. Journal of Sedimentary Research, 66 (1996), pp. 935–947.
Ertel and Hedges, 1985 J.R. Ertel and J.I. Hedges, Sources of sedimentary humic substances: vascular plant debris. Geochimica et Cosmochimica Acta, 49 (1985), p. 2097.
Francez, 1991 Francez, A.J., 1991. Production primaire et accumulation de matière organique dans les tourbières à Sphaignes des Monts du Forez (Puy-de-Dôme). Influence des activités humaines sur leur fonctionnement et leur évolution. Ph.D. Thesis, University of Paris 6, 320 pp..
Francez et al., 2000 A.J. Francez, S. Gogo and N. Josselin, Distribution of potential CO2 and CH4 productions, denitrification and microbial biomass C and N in the profile of a restored peatland in Brittany (France). European Journal of Soil
Biology, 36 (2000), pp. 161–168.
granulométrique pour les tourbes: analyse semi-automatique et représentation graphique. Science du Sol, 29 (1991), pp. 23–35.
Gorham, 1991 E. Gorham, Northern peatlands: role in the carbon cycle and probable responses to climatic warning. Ecological Applications, 1 (1991), pp. 182–195. Grosvernier et al., 1997 P. Grosvernier, Y. Matthey and A. Buttler, Growth potential of three Sphagnum species in relation to water table level and peat properties with implications for their restoration in cut-over bogs. Journal of Applied
Ecology, 34 (1997), pp. 471–483.
Harriss et al., 1985 R.C. Harriss, E. Gorham, D.I. Sebacher, K.B. Bartlett and P.A. Flebbe, Methane flux from northern peatlands. Nature, 315 (1985), pp. 652–654. | Klöcking et al., 2004 Klöcking, R., Kühn, S., Klöcking, H.-P., 2004. Comparaison of the UV-B protective effect of natural peat humic acids and para-aminobenzoic acid (paba). Abstract. “Wise Use of Peatlands”, In: Proceedings of the 12th International Peat Congress, Tampere, p. 421..
Kristensen et al., 1999 E. Kristensen, A.H. Devol and H.E. Hartnett, Organic matter diagenesis in sediments on the continental shelf and slope of the Eastern Tropical and temperate North Pacific. Continental Shelf Research, 19 (1999), pp. 1331–1351. Lacroix et al., 1999 Lacroix, P., Moncorge, S., Cottet, M., 1999. Tourbière sur les Seignes (Frambouhans, les Ecorces-25), Espace Naturel Comtois – Doubs Nature Environnement, internal report..
Laggoun-Défarge et al., 1999a F. Laggoun-Défarge, S. Bourdon, C. Chenu, C. Défarge and J.R. Disnar, Etude des transformations morphologiques précoces des tissus végétaux de tourbe. Apport du marquage histochimique en MET et du cryo-MEB haute résolution, F. Elsass, A.-M. Jaunet, Editors , Structure et Ultrastructure
des Sols et des Organismes Vivants, INRA, Paris (1999), pp. 169–182.
Laggoun-Défarge et al., 1999b F. Laggoun-Défarge, S. Bourdon, B. Guillet and O. Maman, Nature and degradation mode of organic matter in Tritrivakely peaty marsh (Madagascar). Application to environmental reconstruction during the last 2300 years. Ecologie, 30 (1999), pp. 63–66.
Lavoie et al., 2003 C. Lavoie, P. Grosvernier, M. Girard and K. Marcoux,
Spontaneous revegetation of mined peatlands: A useful restoration tool?. Wetlands
Ecology and Management, 11 (2003), pp. 97–107.
Leppard et al., 1977 G.G. Leppard, A. Massalski and D.R.S. Lean, Electron-opaque microscopic fibrils in lakes: their demonstration, their biological derivation and their potential significance in the redistribution of cations. Protoplasma, 92 (1977), pp. 289–309.
Linna et al., 2004 Linna, V., Selin, P., Nyrönen, T., Ainasoja, M., Lehtovaara, J., 2004. Fine particle emissions from peat and wood fuelled fluidized bubbling bed combustion. Abstract. “Wise Use of Peatlands”, In: Proceedings of the 12th
International Peat Congress, Tampere, p. 202..
McNeil and Waddington, 2003 P. McNeil and J.M. Waddington, Moisture controls on Sphagnum growth and CO2 exchange on a cutover bog. Journal of Applied
Ecology, 40 (2003), pp. 354–367.
Modzeleski et al., 1971 J.E. Modzeleski, W.A. Laurie and B. Nagy, Carbohydrates from Santa Barbara Basin sediments: gas chromatographic-mass spectrometric analysis of trimethylsilyl derivatives. Geochimica et Cosmochimica Acta, 35 (1971), pp. 825–838.
Moers et al., 1990 M.E.C. Moers, M. Baas, J.W. De Leeuw, J.J. Boon and P.A. Schenck, Occurence and origin of carbohydrates in peat samples from a red mangrove environment as reflected by abundances of neutral monosaccharides.
Geochimica et Cosmochimica Acta, 54 (1990), pp. 2463–2472.
Moers et al., 1989 M.E.C. Moers, J.J. Boon, J.W. De Leeuw, M. Baas and P.A. Schenck, Carbohydrate speciation and Py-MS mapping of peat samples from a subtropical open marsh environment. Geochimica et Cosmochimica
Acta, 53 (1989), pp. 2011–2021.
Morita, 1983 H. Morita, Monosaccharides as geochemical markers in peat. Canadian
Journal of Soil Science, 63 (1983), pp. 161–166
Morita and Montgomery, 1980 H. Morita and W.G. Montgomery, Monosaccharide composition of selected Canadian peats. Canadian Journal of Soil
Science, 60 (1980), pp. 1–7.
Müller and Mathesius, 1999 A. Müller and U. Mathesius, The palaeoenvironments of coastal lagoons in the southern Baltic Sea. The application of sedimentary C/N ratios as source indicators of organic matter. Palaeogeography, Palaeoclimatology,
Palaeoecology, 145 (1999), pp. 1–16
Noël, 2001 Noël, H., 2001. Caractérisation et calibration des flux organiques sédimentaires dérivant du bassin versant et de la production aquatique (Annecy, Le Petit Lac). Rôles respectifs de l’Homme et du Climat sur l’évolution des flux
organiques au cours des 6000 dernières années. Ph.D. Thesis, University of Orleans, 279 pp..
Oades et al., 1970 J.M. Oades, M.A. Kirkman and G.H. Wagner, The use of gas-liquid chromatography for the determination of sugars extracted from soils by sulfuric acid. Soil Science Society America Proceedings, 34 (1970), pp. 230–235. Opsahl and Benner, 1999 S. Opsahl and R. Benner, Characterization of
carbohydrates during early diagenesis of live vascular plant tissues. Organic
Geochemistry, 30 (1999), pp. 83–94.
Orjala et al., 2004 Orjala, M., Vainikka, P., Kärki, J., Hämäläinen, J., 2004. The advantages of co-firing peat and wood in improving boiler operation and
International Peat Congress, Tampere, p. 207..
Ortiz, 2004 J.E. Ortiz, The palaeoenvironmental and palaeohydrological evolution of Padul Peat Bog (Granada, Spain) over one million years, from elemental, isotopic and molecular organic geochemical proxies. Organic Geochemistry, 35 (2004), pp. 1243–1260.
Pancost et al., 2002 R.D. Pancost, M. Baas, B. Van Geel and J.S. Sinninghe Damsté, Biomarkers as proxies for plant inputs to peats: an example from a sub-boreal ombrotrophic bog. Organic Geochemistry, 33 (2002), pp. 675–690.
Petrone et al., 2004 R.M. Petrone, J.S. Price, J.M. Waddington and H. von Waldow, Surface moisture and energy exchange from a restored peatland, Quebec, Canada.
Journal of Hydrology, 295 (2004), pp. 198–210.
Popper and Fry, 2003 Z.A. Popper and S.C. Fry, Primary cell wall composition of bryophytes and charophytes. Annals of Botany, 91 (2003), pp. 1–12.
Price et al., 2003 J.S. Price, A.L. Heathwaite and A.J. Baird, Hydrological processes in abandoned and restored peatlands: an overview of management approaches.
Wetlands Ecology and Management, 11 (2003), pp. 65–83.
Rochefort et al., 1997 L. Rochefort, F. Quinty and S. Campeau, Restoration of peatland vegetation: the case of damaged or completely removed acrotelm.
International Peat Journal, 7 (1997), pp. 20–28.
Styan and Bustin, 1983 W.B. Styan and R.M. Bustin, Petrography of some Fraser River delta peat deposits: coal maceral and microlithotype precursors in temperate-climate peats. International Journal of Coal Geology, 2 (1983), p. 321.
Tuittila et al., 1999 E.S. Tuittila, V.M. Komulainen, H. Vasander and J. Laine, Restored cut-away peatland as a sink for atmosphéric CO2. Oecologia, 120 (1999), pp. 563–574.
Waddington et al., 2003 J.M. Waddington, M.J. Greenwood, R.M. Petrone and J.S.U. Price, Mulch decomposition impedes recovery of net carbon sink function in a
restored peatland. Ecological Engineering, 20 (2003), pp. 199–210. Wicks et al., 1991 R.J. Wicks, M.A. Moran, L.J. Pittman and R.E. Hodson, Carbohydrates signatures of aquatic macrophytes and their dissolved degradation products as determined by sensitive high-performance ion chromatography method.