HAL Id: hal-00297717
https://hal.archives-ouvertes.fr/hal-00297717
Submitted on 10 Apr 2007
HAL is a multi-disciplinary open access
archive for the deposit and dissemination of
sci-entific research documents, whether they are
pub-lished or not. The documents may come from
teaching and research institutions in France or
abroad, or from public or private research centers.
L’archive ouverte pluridisciplinaire HAL, est
destinée au dépôt et à la diffusion de documents
scientifiques de niveau recherche, publiés ou non,
émanant des établissements d’enseignement et de
recherche français ou étrangers, des laboratoires
publics ou privés.
Direct and indirect metabolic CO2 release by humanity
Y. T. Prairie, C. M. Duarte
To cite this version:
Y. T. Prairie, C. M. Duarte. Direct and indirect metabolic CO2 release by humanity. Biogeosciences,
European Geosciences Union, 2007, 4 (2), pp.215-217. �hal-00297717�
Biogeosciences, 4, 215–217, 2007 www.biogeosciences.net/4/215/2007/ © Author(s) 2007. This work is licensed under a Creative Commons License.
Biogeosciences
Direct and indirect metabolic CO
2
release by humanity
Y. T. Prairie1and C. M. Duarte2
1D´epartement des sciences biologiques, Universit´e du Qu´ebec `a Montr´eal, Case postale 8888, succ. Centre-Ville, Montr´eal,
H3C 3P8, Canada
2IMEDEA (CSIC-UiB), Instituto Mediterr´aneo de Estudios Avanzados, C/ Miquel Marqu´es 21, 07190 Esporles (Mallorca),
Spain
Received: 26 October 2006 – Published in Biogeosciences Discuss.: 21 November 2006 Revised: 19 March 2007 – Accepted: 27 March 2007 – Published: 10 April 2007
Abstract. The direct CO2released by respiration of humans
and domesticated animals, as well as CO2derived from the
decomposition of their resulting wastes was calculated in or-der to ascertain the direct and indirect metabolic contribution of humanity to CO2 release. Human respiration was
esti-mated to release 0.6 Gt C year−1and that of their associated
domestic animals was estimated to release 1.5 Gt C year−1,
to which an indirect release of 1.0 Gt C year−1, derived from
decomposition of the organic waste and garbage produced by humans and their domestic animals, must be added. These combined direct and indirect metabolic sources, estimated at 3.1 Gt C year−1, have increased 7 fold since pre-industrial
times and are predicted to continue to rise over the 21st cen-tury.
1 Introduction
Rapid increase in atmospheric CO2has prompted intense
re-search efforts to elucidate and quantify the sources and sinks of CO2. The depictions of the global carbon budget consider
the role of humans through the CO2released from fossil fuel
combustion and changes in land use (IPCC 2001), but does not explicitly estimate the metabolic CO2released by
respi-ration by humans, as well as the CO2 derived from the
de-composition of their wastes. In addition, humans maintain a large livestock population to feed themselves as well as a large number of domestic animals for other services, which release CO2both via direct respiration as well as via the
de-composition of their wastes. We assess here the magnitude of these combined direct and indirect metabolic CO2sources
and their likely increase since pre-industrial times, to ascer-tain their role on the global CO2budget.
Correspondence to: C. M. Duarte ([email protected])
2 Methods
Per capita respiration (R, in watts) and excretion (E, in watts) rates by humans and domestic animals were derived from body weight (W , in kg) using allometric relationships that depict standard metabolic and defecation rates as a power function of body weight as: R=3.89W0.79 and defecation rate E=3.82W0.63 (Peters, 1983). For comparison, we also estimated the per capita rate of respiration as the prod-uct of average breathing frequency (10 min−1), tidal
vol-ume (0.5 L) and average CO2 concentration of the air
ex-pired (3.5%; Marrieb, 2000), yielding an average individ-ual rate of about 251 g C d−1, nearly identical to the
esti-mate of 257 g C d−1 derived strictly from allometric
rela-tionships. The similarity of these two estimates strongly suggests that the allometric approach gives reasonable val-ues. We further estimated the overall uncertainty in the global respiratory CO2 emissions from the inherent
statis-tical uncertainty of the allometric relationship of 0.1 log (base 10) unit (Robinson et al., 1983, equivalent to a co-efficient of variation of about 25%) and by assuming that the FAO statistics on the number of individuals of each species are precise only to within 20% (as coefficient of vari-ation, CV). The compounded uncertainty was estimated to be 32% for each species, as calculated from CV (x1x2) =
p
CV2(x
1) · CV2(x2) + ·CV2(x1) + ·CV2(x2), and
stan-dard error propagation of these uncertainty estimates yielded an overall expected coeefficient of variation of the global emissions of direct and indirect human-derived metabolism of 17% (calculated as the sum of individual variances and expressed as CV).
Per capita organic waste production was extrapolated from Organization for Economic Co-operation and Development figures (OECD, 2002). Human population size was de-rived from estimates of the past, present and projected es-timates (Cohen, 1995, Population Division of the Depart-ment of Economic and Social Affairs of the United Nations
216 Y. T. Prairie and C. M. Duarte : Metabolic human CO2release
Table 1. Estimates of direct and indirect metabolic CO2release by
humans and associated animals. Figures correspond to 2003.
Weight Population Respiratory Excretory Total kg (millions) Gt C yr-1 Gt C yr-1 Gt C yr-1 Direct Humans 70 6100.00 0.57 0.28 0.86 Indirect Cows 891 1349.00 0.94 0.31 1.26 Goats 89 740.00 0.08 0.04 0.12 Sheeps 50 1050.00 0.08 0.04 0.12 Horses 794 58.00 0.04 0.01 0.05 Pigs 200 1000.00 0.22 0.09 0.31 Chickens 2.1 15090.00 0.09 0.08 0.17 Buffalos 350 165.90 0.06 0.02 0.08 Turkeys 11.5 242.90 0.01 0.00 0.01 Geese 5.2 238.80 0.00 0.00 0.01 Ducks 2.6 917.70 0.01 0.01 0.01 Camels 140 19.40 0.00 0.00 0.00 Cats 2 1100.00 0.01 0.01 0.01 Total ind. 2.14 Non-metabolic waste production 0.10 Total 3.10
Secretariat, 2002), and the abundance of livestock was de-rived from 2004 FAO statistics (http://www.faostats.org).
3 Results and discussion
The estimates of the metabolic CO2release from human
res-piration obtained as the product of present human popula-tion size and per capita respiratory CO2release estimated
ei-ther from allometric relationships or from direct respiromet-ric measurements were 0.6 Gt C year−1and 0.57 Gt C year−1
(Table 1), respectively. We estimated that respiration by de-composers of the excreted organic matter releases an addi-tional 0.29 Gt C year−1(Table 1). Humans also produce
non-metabolic organic waste (as garbage) amounting to about 0.1 Gt C year−1, which must again be largely decomposed
to CO2by bacterial respiration.
The population of domestic animals maintained by hu-mans exceeds human population by three fold (Table 1). The combined respiratory CO2release by domesticated animals
is estimated at 1.5 Gt C year−1, and decomposer respiration
of their excreted products adds about 0.6 Gt C year−1. The
total metabolic release by domesticated animals of 2.1 Gt C year−1, must be considered an indirect human metabolic
CO2release, for these animals only exist in such large
num-bers to provide food and service to humans.
The total direct and indirect metabolic CO2release by
hu-mans amounts to an estimated 3.1 Gt C year−1 (Table 1).
This figure is a conservative estimate of the metabolic CO2
release associated to human activity, for humans now use about 3–4% of the terrestrial (Vitousek et al., 1986) and 8% of the marine (Pauly and Christensen, 1995) net primary pro-duction, most of which is eventually decomposed to CO2.
The calculated direct and indirect metabolic CO2 release
by humans represents about half of the CO2 released from
fossil fuel combustion, and nearly twice that released from
0 1 2 3 4 5 1850 1900 1950 2000 2050 Es ti m a te d C e m is s io n s (G t C y e a r -1 )
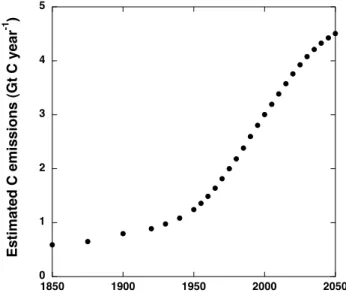
Fig. 1. Estimated human-derived direct and indirect metabolic CO2
release from pre-industrial to year 2050.
changes in land use (IPCC, 2001). Whereas the role of the CO2released by fossil fuel combustion has been extensively
discussed, that of the anthropogenic metabolic CO2release
has not. This is likely because anthropogenic metabolic CO2
release may be considered just an intensification of cycling processes between the atmosphere and the biosphere via en-hanced crop and pasture production. This is an important distinction. In an equilibrium situation, the calculated emis-sions do not represent a new, unaccounted flux to the atmo-sphere. Instead, it provides a first-order estimate of the sur-prisingly large magnitude of a component embedded within the net exchange of CO2 between the Earth and the
atmo-sphere. However, the replacement of natural ecosystems by pasture and crops also represents a net human-induced CO2
emission through a decline in sink capacity, as essentially all of the production of crops and pastures is cropped and even-tually decomposed to CO2(Gitz and and Ciais, 2004).
Al-though the quantification of this sink loss is beyond the scope of this paper, we submit that acknowledging this to be a result of metabolic CO2release by humans provides a more direct
identification of source components and a better appreciation of the consequences of demographic changes on this source component.
Whereas the increase in atmospheric CO2resulting from
different scenarios of CO2 emissions from fossil fuel
com-bustion have been discussed extensively (IPCC, 2001), all of them underestimate the likely increase in atmospheric CO2
concentration by failing to account for demographics effects on the metabolic CO2release. The demographic effects on
metabolic CO2 release were examined by combining
esti-mates of past, present and future human population with the per capita rates of direct and indirect metabolic CO2release
Y. T. Prairie and C. M. Duarte : Metabolic human CO2release 217
derived here. Direct and indirect metabolic CO2release by
humans has been increasing through time from a calculated value of 0.44 Gt C year−1 in 1800 to an expected 4.4 Gt C
year−1by year 2050 (Fig. 1), assuming that per capita rates
are maintained constant. The realized increase may well ex-ceed this estimate, since changes in diet and consumption habits are leading to a rapid increase in human body weight and food ingestion, and therefore per capita metabolic CO2
release. In addition, the number of domestic animals per capita and per capita waste production are also increasing, and are expected to continue to do so in the future (OECD, 2002; Tilman et al., 2002).
Metabolic CO2 release can only augment as population
size increases in the future. This is a component of the CO2
flux that must be recognized in future analyses of global CO2
dynamics and that must be considered to represents a com-ponent of the perturbed C cycle, as human population has increased – and will continue to increase – greatly since pre-industrial time. Yet, the direct and indirect metabolic CO2
emissions by humans is not considered explicitly in the sce-narios conducted by the IPCC (2001), and is not incorpo-rated, therefore, into current strategies to mitigate the cli-matic consequences of greenhouse gas emissions.
The absence of explicit consideration of metabolic human CO2emissions may be a symptom of a tendency to perceive
humans as separate entity to other species, which impacts on the biosphere involve their technology, whereas the re-sults presented here clearly indicate that human demogra-phy and metabolism may be important factors involved in greenhouse gas emissions. Whereas metabolic CO2release
maybe far less amenable to change than emissions derived from deforestation, cement production or fossil fuel use, dif-ferent human choices can affect human metabolic CO2
re-lease. The indirect metabolic CO2release may be reduced
through the promotion of behavioral changes to reduce the per capita consumption of meat and organic waste produc-tion, and the direct metabolic CO2release may be reduced
by adjusting human ingestion to requirements, avoiding the excess food ingestion affecting much of the population in de-veloped societies, and that represents a health hazard as well, responsible for more than 1 in 10 deaths in the EU and USA (Banegas et al., 2003). In contrast, however, per capita food intake is predicted to increase by about 10% from a present average value of 2803 Kcal year−1 person−1 to 3050 Kcal
year−1 person−1by 2030 in industrialized countries (FAO,
2002). In summary, human metabolic CO2 release, direct
and indirect, is an important and growing component of an-thropogenic CO2 emissions. Explicit consideration of this
component may help improve current emission scenarios and mitigation strategies.
Acknowledgements. This research is a contribution to the
“Inte-grating the aquatic with the terrestrial component of the global carbon budget” Working Group supported by the National Center for Ecological Analysis and Synthesis, a Center supported by NSF (Grant #DEB-94-21535), the University of California at Santa Barbara, and the State of California. Y. T. Prairie and C. M. Duarte were supported by the sabbatical fellowship program from the Spanish Ministry of Education and Science.
Edited by: J.-P. Gattuso
References
Banegas, J. R., L´opez-Garc´ıa, E., Guti´errez-Fisac, J. L., Guallar-Castill´on, P., and Rodr´ıguez-Artalejo, F.: A simple estimate of mortality attributable to excess weight in the European Union, Eur. J. Clin. Nutr., 57, 201–208, 2003.
Cohen, J. E.: How Many People Can the Earth Support?, New York, USA, W. W. Norton, 532, 1995.
IPCC: Climate change 2001: The Scientific basis, New York, USA, Cambridge Univ. Press, 892, 2001.
Marrieb, E. N.: Human Anatomy and Physiology, 5th edition, New York, USA, Benjamin/Cummings, 1237, 2000.
OECD: Workshop on Waste Prevention: Toward Performance Indi-cators, Paris, France, OECD, 2002.
FAO: World agriculture: towards 2015/2030, Summary report, Food and Agriculture Organization of the United Nations, Rome, Italy, 2002.
Gitz, V. and Ciais, P.: Future expansion of agriculture and pasture acts to amplify atmospheric CO2 levels in response to
fossil-fuel and land-use change cmissions, Clim. Change, 67, 161–184, 2004.
Pauly, D. and Christensen, V.: Primary production required to sus-tain global fisheries, Nature, 374, 255–257, 1995.
Peters, R. H.: The ecological implications of body size, New York, USA, Cambridge University Press, 1983.
Population Division of the Department of Economic and Social Affairs of the United Nations Secretariat: World Population Prospects: The 2002 Revision, http://esa.un.org/unpp, 2002. Robinson, W. R., Peters, R. H., and Zimmerman, J.: The effet of
body size on the metabolic rates of organisms, Can. J. Zool., 61, 281–288, 1983.
Tilman, D., Cassman, K. G., Matson, O. A., Naylor, R., and Po-lasky, S.: Agricultural sustainability and intensive production practices, Nature, 418, 671–673, 2002.
Vitousek, P., Ehrlich, P. R., Ehrlich, A. H., and Matson, P.: Human appropriation of the products of photosynthesis, Bioscience, 36, 368–373, 1986.