HAL Id: hal-01855416
https://hal.archives-ouvertes.fr/hal-01855416
Submitted on 7 May 2021
HAL is a multi-disciplinary open access
archive for the deposit and dissemination of
sci-entific research documents, whether they are
pub-lished or not. The documents may come from
teaching and research institutions in France or
abroad, or from public or private research centers.
L’archive ouverte pluridisciplinaire HAL, est
destinée au dépôt et à la diffusion de documents
scientifiques de niveau recherche, publiés ou non,
émanant des établissements d’enseignement et de
recherche français ou étrangers, des laboratoires
publics ou privés.
Distributed under a Creative Commons Attribution| 4.0 International License
Cécile Dang, Pierre-Guy Sauriau, Nicolas Savoye, Nathalie Caill-Milly,
Philippe Martinez, C Millaret, Joël Haure, Xavier de Montaudouin
To cite this version:
Cécile Dang, Pierre-Guy Sauriau, Nicolas Savoye, Nathalie Caill-Milly, Philippe Martinez, et al..
Determination of diet in Manila clams by spatial analysis of stable isotopes. Marine Ecology Progress
Series, Inter Research, 2009, 387, pp.167 - 177. �10.3354/meps08100�. �hal-01855416�
INTRODUCTION
The Manila clam Ruditapes philippinarum is native to the Indo-Pacific region and is one of the most fished and farmed bivalves in the world (Gosling 2004). The Manila clam was deliberately introduced into Euro-pean waters, first in France for culture in 1972 and later in England, Spain and Italy (Flassch & Leborgne 1992). Within a few years, the species established wild popu-lations in most of these European countries. In Arca-chon Bay (SW France), the Manila clam was intro-duced in 1980 primarily for aquaculture. Due to successful reproduction, it rapidly colonized intertidal
areas including Zostera noltii seagrass beds (Blanchet et al. 2004). Today, the species supports intensive com-mercial fisheries (Caill-Milly et al. 2006). Successive stock assessments of the Manila clam population revealed large heterogeneity in shell length frequency distributions over Arcachon Bay (Caill-Milly et al. 2006). Since the growth of Manila clam depends mainly on temperature and pelagic food sources (Langton et al. 1977, Mann 1979), spatial heterogene-ity in both phytoplankton primary production (Glé et al. 2008) and benthic habitats (Blanchet et al. 2004) could lead to spatial heterogeneity in both its demo-graphy and growth performances. Furthermore, as the
© Inter-Research 2009 · www.int-res.com *Email: c.dang@epoc.u-bordeaux1.fr
Determination of diet in Manila clams by spatial
analysis of stable isotopes
C. Dang
1, 2,*, P. G. Sauriau
3, N. Savoye
1, 2, N. Caill-Milly
4, P. Martinez
5, 6,
C. Millaret
1, 2, J. Haure
7, X. de Montaudouin
1, 21Université de Bordeaux and 2CNRS, UMR 5805, Station Marine d’Arcachon, 2 rue du Pr Jolyet, 33120 Arcachon, France 3LIENSs, Université de La Rochelle, CNRS, 2 rue Olympe de Gouge, 17000 La Rochelle, France
4IFREMER, Laboratoire Ressources Halieutiques Aquitaine, 1, allée du parc Montaury, 64600 Anglet, France 5Université de Bordeaux and 6CNRS, UMR 5805, Avenue des Facultés, 33405 Talence, France
7IFREMER, Laboratoire Génétique et Pathologie, Polder des Champs, 85230 Bouin, France
ABSTRACT: Spatial changes in the dietary regime of Ruditapes philippinarum from intertidal sedi-ments of Arcachon Bay were depicted by analyzing stable isotope ratios in both its adductor muscles and potential trophic sources. Manila clams were collected from 50 sites in May to June 2006. Dietary reconstruction was based on the IsoSource mixing model, considering trophic enrichments of 3.5 ‰ for carbon and 3.0 ‰ for nitrogen, which were determined experimentally. δ13C and δ15N values,
respectively, averaged –28.2 and 5.2 ‰ for riverine particulate organic matter (POM), –20.6 and 4.7 ‰ for inner bay phytoplankton, –21.0 and 5.6 ‰ for outer bay phytoplankton, –16.8 and 4.8 ‰ for micro-phytobenthos, –18.4 and 3.9 ‰ for sedimentary organic matter (SOM) and 11.8 and 4.0 ‰ for Zostera
noltii. Clam muscle δ13C and δ15N values ranged from –20.5 to –16.4 ‰, and from 7.6 to 9.3 ‰,
respec-tively. δ15N significantly decreased from southern to northern parts of the bay, while δ13C values
increased with tidal elevation. Outer bay phytoplankton was the major diet component of clams. Clams from the southeast mainly incorporated outer bay phytoplankton despite the proximity of the Leyre River, whereas clams from the northwest incorporated approximately equal parts of inner and outer bay phytoplankton, riverine POM, microphytobenthos and SOM. These patterns were consis-tent with spatial gradients driven by the dominant role of tidal hydrodynamics within the bay and land-use characteristics of the catchment.
KEY WORDS: Ruditapes philippinarum · Muscle · C and N stable isotopes · Trophic sources · Mixing model · Spatial variability · Arcachon Bay · SW France
wild R. philippinarum population represents the sec-ond most prevalent suspension-feeder stock in Arca-chon Bay, it is expected to play a key role in both the benthic food web and benthic–pelagic coupling within the bay.
Stable isotope analysis has been used widely to investigate time-integrated dietary patterns of organ-isms and transfers of organic matter within food webs (Peterson & Fry 1987, Post 2002). δ13C helps to identify
primary food sources assimilated by consumers, whereas δ15N is used to determine their trophic
posi-tion (DeNiro & Epstein 1978, 1981, Post 2002). δ13C and
δ15N in an organism respectively reflect the δ13C and
δ15N of its diet with a trophic enrichment (δ
consumer –
δdiet) estimated to average 0.5 to 1 ‰ for δ13C (DeNiro
& Epstein 1978, Peterson & Fry 1987) and 3 to 4 ‰ for δ15N (DeNiro & Epstein 1981, Post 2002).
How-ever, these average values hide large variations among species (Peterson & Fry 1987), feeding modes (McCutchan et al. 2003) and, as organisms are often analyzed whole, highly significant differences be-tween their different tissues (Vanderklift & Ponsard 2003). For instance, Stephenson & Lyon (1982), Lor-rain et al. (2002) and Malet et al. (2007) reported δ13C
differences greater than 2 to 3 ‰ between adductor muscles and digestive glands in suspension-feeding bivalves. An increasing practice in stable isotope studies on marine bivalves has been
to analyze the adductor muscle in-stead of the whole body to depict both temporal (Lorrain et al. 2002, Page & Lastra 2003, Kasai et al. 2004, Malet et al. 2007) and spatial tropho-dynamics (Machás et al. 2003, Page & Lastra 2003). Adductor muscles have slower turnover and much lower lipid contents than other tissues such as gonads and digestive glands (Paulet et al. 2006, Malet et al. 2007), and they are a good indicator of long-term diet (Peterson & Fry 1987). However, no species- and/or tissue-specific trophic enrichment values are avail-able for bivalves in published reviews (Peterson & Fry 1987, Vander Zanden & Rasmussen 2001, Post 2002, McCutchan et al. 2003). Thus, it would be particularly useful to ex-perimentally determine these values when using muscle instead of the whole body approach in tracing or-ganic matter flows through suspen-sion-feeding molluscs (Lorrain et al. 2002, Page & Lastra 2003, Malet et al. 2007).
The present study focused on large-scale spatial variations in the dietary pattern of the suspension-feeding bivalve Ruditapes philippinarum living in intertidal areas of Arcachon Bay. C and N isotopic ratios of its adductor muscles were determined together with those of its potential trophic sources. Trophic enrichment values for adductor muscle were estimated from a long-term diet-switch experiment with the diatom Skeletonema costatum and dietary inferences were deduced from the IsoSource mixing model. In light of known spatial variations in hydro-logical features within the bay, variations in dietary patterns of Manila clams are then discussed.
MATERIALS AND METHODS
Study site. Arcachon Bay (44° 40’ N, 1° 10’ W) is a
156 km2 semi-sheltered lagoon located on the
south-west coast of France (Fig. 1). Tidal flats extend over 110 km2, of which 70% are covered by dense Zostera
noltii seagrass beds (Auby & Labourg 1996). Although Z. noltii meadows appeared homogeneous,
macro-zoobenthic community analysis revealed the existence of 4 distinct macrobenthic communities (Blanchet et al. 2004). The main forcing variables such as water mass characteristics and sediment grain-size are under the
Fig. 1. Arcachon Bay, southwest France, showing location of sampling stations for benthic sources, i.e. sediment, Zostera noltii and microphytobenthos (j), pelagic
control of tidal hydrodynamics (Auby & Labourg 1996, Blanchet et al. 2004). Arcachon Bay is influenced by both oceanic and continental sources following a semi-diurnal macrotidal rhythm. Neritic waters enter the inner lagoon through 2 channels, the Piquey Channel which extends to the north and the larger Teychan Channel at the south (Fig. 1). The seawater exchange ranges from 160 × 106to 400 × 106m3per tide following
the spring to neap tide cycle, and meets freshwater inputs coming principally from the Leyre River in the east. According to Direction Régionale de l’Environ-nement (DIREN) data, Leyre River discharge during 2006 was low compared to its average 20 yr discharge, and the maximum runoff was 25 m3s–1in March 2006.
The remaining freshwater inputs are provided by 17 secondary streams and diffuse sources located on the eastern side of the lagoon (De Wit et al. 2005). Sedi-ment grain-size in Z. noltii beds varies from mud to sandy mud (Blanchet et al. 2004). Clams were usually located near the mid-tidal level within seagrass mead-ows (Caill-Milly et al. 2006). The Manila clam habitat in Arcachon Bay appears to be a mosaic of sedimentary biofacies where salinity and sediment temperature fluctuate yearly between 4 and 35, and between –2 and 44°C, respectively (Dang et al. 2008).
Sampling strategy. Manila clams were sampled at
50 geographically referenced stations within Arcachon Bay between mid-May and mid-June 2006 (Fig. 1). Stations were evenly dispersed within the ca. 70 km2
distribution area of the species, as previously de-scribed by stock assessment studies (Caill-Milly et al. 2006). Tidal elevation (m) of each station was provided by both Service Hydrographique de la Marine (SHOM, Brest) and Direction Départementale de l’Equipement de la Gironde (DDE, Bordeaux). A total of 3 adult clams ranging from 30 to 36 mm in shell length were col-lected at each station.
Prior to the clam sampling (24 April to 15 May 2006), marine and continental water, sediment and benthic primary producers were sampled. Water was collected at 4 stations within Arcachon Bay and at 2 stations in the Leyre River (Fig. 1). Particulate organic carbon (POC) and nitrogen (PON), chlorophyll a (chl a) and δ13C and δ15N of particulate organic matter (POM)
were then determined. The dominance of phyto-plankton within the bulk POM was checked using a POC:chl a ratio of 200 (Cifuentes et al. 1988). When the water column POM exhibited POC:chl a ratios of 80 to 180, samples were used to characterize living phyto-plankton. Surface sediment, microphytobenthos and living Zostera noltii leaves were sampled at 7 intertidal stations (Fig. 1). Water was sampled using a Niskin bottle and immediately poured into pre-cleaned plastic bottles before filtration. Surface sediment was sampled directly using acid-cleaned and pre-combusted glass
vials. Living Z. noltii leaves were hand-sampled and placed within clean plastic bags.
Long-term diet-switch experiment. Batch cultures of
the diatom Skeletonema costatum were kept in out-door concrete tanks (80 m3) under natural light
condi-tions and continuous aeration (Baud & Bacher 1990, Sauriau et al. 1997). Salty groundwater pumped up from the subsoil was used as the culture medium since its nutrient composition was recognized to favour S.
costatum growth (Baud & Bacher 1990). Diatom
cul-tures in exponential growth phase (i.e. after 3 to 4 d and with cell concentrations of ca. 1.5 × 10⁶cells ml–1)
were used as monospecific algal food for rearing clams (Sauriau et al. 1997). Temperature and salinity in the tanks ranged from 15.1 to 19.2°C, and 32.5 to 32.7, respectively. The food ration was ca. 2 × 10⁹algal cells
d–1 clam–1. Algal isotopic composition was monitored
weekly by filtering four 0.5 l samples through pre-combusted Whatman GF/F fiberglass filters (25 mm diameter). Filters were then immediately stored at –20°C until freeze-drying.
A total of 100 adult Manila clams were collected from the intertidal mudflats of Ile aux Oiseaux (Arca-chon Bay) at the end of May 2006. They averaged 41.1 ± 1.1 mm shell length and 0.43 ± 0.08 g tissue dry weight. Clams were reared in 500 l tanks for 160 d. They were placed on trays filled with medium to coarse sand allowing them to bury and adopt a natural suspension-feeding behaviour. The flow of under-ground seawater was controlled in each tank at a rate of 10 l min–1 and was continuously aerated; 5 clams
were randomly sampled on 1 June 2006 and then 5, 11, 20, 40, 76, 103, 126 and 160 d later. At each sampling date, individual clams were cleaned and placed in an aerated tank with filtered underground seawater for 48 h to allow gut content evacuation. All sampled clams were subsequently frozen at –20°C until dis-section.
Sample processing. Clam shell length was measured
by a digital caliper to the nearest mm. Clams were then opened, their posterior adductor muscles dissected, frozen at –20°C for storage and then frozen at –80°C prior to freeze-drying. Water samples were filtered onto 47 mm GF/F filters for chl a and onto pre-combusted 25 mm GF/F filters for POC, PON, δ13C and δ15N.
Filters for chl a were stored frozen (–80°C), whereas filters for C and N elemental and isotopic analysis were freeze-dried and then stored at room temperature. Sediment samples were frozen at –20°C. Zostera noltii leaves were cleaned of their epiphytes, decarbonated in a bath of 2% HCl and then rinsed with Q-water (C elemental and isotopic analysis), or only rinsed with Q-water (N elemental and isotopic analysis). Leaves were then dried overnight in an oven (60°C) and stored in aluminum foil at room temperature. Sediment for
carbon and nitrogen elemental and isotopic analysis was decarbonated using 2N HCl (Kennedy et al. 2005). Filters for carbon and nitrogen elemental and isotopic analysis were decarbonated using HCl fumes (Lorrain et al. 2003). Prior to analysis, clam muscle and sedi-ment samples were freeze-dried and ground using mortar and pestle to get a homogeneous fine powder.
Z. noltii leaves were similarly ground.
Sample analysis. Chl a was analyzed by
fluores-cence (Yentsch & Menzel 1963). C and N elemental and isotopic analysis were performed using an ele-mental analyzer (Carlo Erba 2500) in line with an iso-tope ratio mass spectrometer (VG Isoprim). Data were corrected and calibrated against homemade working standards (casein and glycin) and against certified standards (acetanilide, IAEA-N2, USGS-24). These standards allowed the analytical precision to be set at 0.2 ‰. Isotopic values are reported in the usual per mil unit (‰) following:
δAX = [(R
sample/Rref) – 1] × 1000
where A is the atomic mass of the heavy stable isotope of the element X, and Rsampleand Rrefare the ratios of
heavy to light isotopes for carbon (13C/12C) and
nitro-gen (15N/14N). References are Vienna Pee Dee
Belem-nite (VPDB) for δ13C and atmospheric nitrogen for δ15N.
Trophic enrichment estimates. Temporal changes in
stable isotope ratios exhibited by clam muscles were fitted to the equation proposed by Tieszen et al. (1983): Yt= a + b× ec t. In this time-based equation, Yt(‰) is
theδ ratio of clam tissues at time t (days since the first sampling date), a (‰) is related to the δ ratio of tissues in equilibrium with the new diet, b (‰) refers to the difference between initial and asymptotic δ ratio of tissues and c (d–1) is the turnover rate of tissues. All
equation parameters were estimated by non-linear regression using SigmaPlot 1.02 (Jandel Scientific). Trophic enrichment values for both δ13C and δ15N were
then calculated as the difference between the δ ratios of tissues in equilibrium with the new diet and the average δ ratios of the diet. The half-life of δ13C and
δ15N was defined as ln(0.5 c–1) in days, and was the
time over which 50% of the isotope ratios were ex-changed in the tissue.
Mixing model: IsoSource. Phytoplankton from both
the inner and outer bay, Leyre River POM, microphyto-benthos, sedimentary organic matter (SOM) and
Zostera noltii leaves were considered as potential
trophic resources for the Manila clam. Macroalgae were not considered as a potential food source for
Ruditapes philippinarum due to their very low
preva-lence in clam habitat within Arcachon Bay. The IsoSource software (Phillips & Gregg 2003, Phillips et al. 2005) was used to determine the relative contribu-tion of each source to the mixed signature of clam
adductor muscles at the 50 stations sampled. Experi-mentally determined muscle-specific trophic enrich-ments for both δ13C and δ15N were subtracted from
adductor muscle values before IsoSource analysis.
Statistical analyses. Statistical analyses were
per-formed using Statistica 7.1 software (StatSoft). The maximum type I error rate was set at α = 0.05. Results are expressed as mean ± SD with n equal to the num-ber of samples analyzed. Homogeneity of variance was checked using Cochran’s test. First, a nested ANOVA was conducted to compare C and N isotopic ratios of the Manila clam muscle between the 50 stations (Sokal & Rohlf 1981). Second, single linear regressions were computed between δ13C, δ15N and the distance (km) of
each station from the Leyre River mouth, tidal eleva-tion (m) and clam shell length (mm). Distances from the Leyre River were calculated with the Arcview 3.2 GIS software.
RESULTS
Trophic enrichment of δδ13C and δδ15N
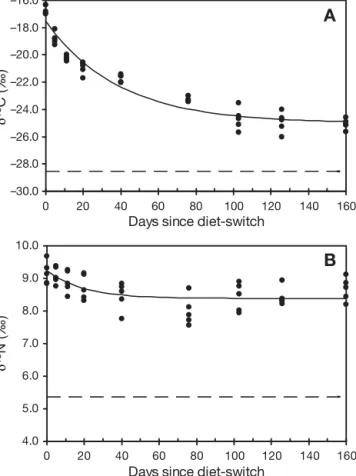
During the course of the diet-switch experiment, adult Manila clams exhibited a small growth in shell length (+ 3.3 ± 1.1 mm); however, they increased by 3.2- and 2.6-fold in total tissue and adductor muscle dry weight, respectively. At the start of the feeding experiment, carbon and nitrogen isotopic ratios of adductor muscles averaged –16.7 ± 0.3 and 9.2 ± 0.4 ‰ (n = 5), respectively. Both δ13C and δ15N values of
adductor muscles changed toward more depleted val-ues and converged on asymptotic valval-ues reflecting the incorporation of the algal diet (Fig. 2). Skeletonema
costatum had stable carbon and nitrogen isotopic ratios
of –28.5 ± 0.8 and 5.4 ± 0.6 ‰ (n = 45), respectively. The exponential decay model provided a good fit to changes in both δ13C and δ15N muscle values with
sig-nificant correlations (δ13C: r = 0.96, p < 0.001; δ15N: r =
0.63, p < 0.01). The trophic enrichment for adductor muscles was + 3.5 ‰ for δ13C and + 3.0 ‰ for δ15N. The
half-life values were 26.8 and 13.3 d for δ13C and δ15N,
respectively.
Isotopic signatures
Clam muscle
Carbon isotopic ratios of muscle tissue sampled at the 50 stations in the bay ranged from –20.2 to –16.4 ‰ (Fig. 3), owing to significant δ13C differences between
stations (nested ANOVA, p < 0.001). However, most of the values were scattered around –17.4 ± 0.6 ‰. Spatial
dispersion in δ13C values seemed
heteroge-neous with no evidence of a consistent spa-tial pattern (Fig. 3). No significant relation-ships were thus found between δ13C and
distance to the Leyre River or clam shell length (p > 0.05) (Table 1). However, a sig-nificant positive correlation was found be-tween δ13C and tidal elevation (p < 0.05)
(Table 1).
Nitrogen isotopic ratios of muscle tissues ranged between 7.4 and 9.8 ‰ with a mean value of 8.5 ± 0.5 ‰ (Fig. 4). Significant dif-ferences in δ15N were observed among
sta-tions (nested ANOVA, p < 0.001). The high-est clam muscle δ15N values were located at
the southeastern part of the bay along the Teychan channel, whereas almost all the low δ15N values were located to the north in the
bay (Fig. 4). A negative correlation was ob-served between δ15N and the distance to the
Leyre River (p < 0.05) (Table 1). No signifi-cant correlations were found with tidal eleva-tion or clam shell length (p > 0.05) (Table 1).
Primary producers and sediment
Stable isotopic ratios of primary producers and sedi-ment in Arcachon Bay are presented in Table 2. POM sampled in the Leyre River was highly depleted in 13C
compared to the phytoplankton of the bay. Microphy-tobenthos had much lighter δ13C values than riverine
POM and bay phytoplankton but a similar δ15N value
compared to inner bay phytoplankton. The scatterplot of stable isotope values of clam muscle tissues cor-rected for trophic enrichments (δ13C: 3.5 ‰; δ15N: 3 ‰)
and potential trophic sources is presented in Fig. 5. With the exception of one station located close to the Leyre River mouth, which was significantly different in δ13C (–23.6 ± 0.1 ‰), isotopic values of other stations
appeared as a single cluster with δ13C ranging from
–21.7 to –19.5 ‰ and δ15N from 4.6 to 6.3 ‰. The
scatterplot also highlights the close correspondence between the clam isotopic values corrected for trophic enrichment and those of outer and inner bay phyto-plankton. –30.0 –28.0 –26.0 –24.0 –22.0 –20.0 –18.0 –16.0 0 20 40 60 80 100 120 140 160
Days since diet-switch
Days since diet-switch
δ 15N (‰) δ 13C (‰)
A
4.0 5.0 6.0 7.0 8.0 9.0 10.0 0 20 40 60 80 100 120 140 160B
Fig. 2. Ruditapes philippinarum. Changes in (A) δ13C and (B)
δ15N of the posterior adductor muscle of adult clams during a
diet-switch experiment. Mean δ13C and δ15N values for the algal
diet (
– –
) and exponential decay curves (—
) are indicatedFig. 3. Ruditapes philippinarum. Spatial variation in carbon isotopic ratios (δ13C) of posterior adductor muscle of adult clams sampled at 50 stations in
Arcachon Bay in May–June 2006
δ15N δ13C
R2 p R2 p
Leyre distance (km) 0.40 < 0.01 0.01 0.58 Tidal level (m) < 0.01 0.80 0.15 0.01 Clam shell length (mm) < 0.01 0.35 < 0.01 0.41 Table 1. Single regression results between δ15N, δ13C and
Food source analysis: IsoSource
The IsoSource mixing model estimated that, at the bay scale, phytoplankton contributed most (63% on av-erage) to the diet of Manila clams. Outer bay phyto-plankton contributed the most (50 ± 27%), followed by riverine POM (16 ± 9%) and inner bay phytoplankton (14 ± 10%). The proportions of microphytobenthos, SOM and Zostera noltii to the clam diet were 9 ± 5, 7 ± 5 and 5 ± 3%, respectively. Excluding Zostera noltii as a potential food source from the mixing model does not affect these values since contributions of outer bay phytoplankton, riverine POM, inner bay phytoplank-ton, microphytobenthos and SOM were 52 ± 25, 12 ± 8, 15 ± 8, 12 ± 6 and 9 ± 6%, respectively.
Modelling of the Manila clam food sources yielded different proportions of each food source, depending on ge-ographical location (Fig. 6). Clams lo-cated in the southern part of the bay along the Teychan Channel assimi-lated much higher outer bay phyto-plankton than clams located to the north. In the northeastern end of the bay, trophic sources of clams were the most diverse: contributions of riverine POM, inner bay phytoplankton, mi-crophytobenthos and SOM were higher than for clams collected in the south. The riverine POM contribution was sometimes higher than that of outer bay phytoplankton, and the con-tribution of Zostera noltii to the clam diet was low and never exceeded 9%.
DISCUSSION
Trophic enrichment in Manila clam muscle
Trophic enrichment in 13C and 15N
of consumers relative to their diet is consistently reported in stable iso-tope analyses (DeNiro & Epstein 1978, 1981, Peterson & Fry 1987). The trophic enrichment for δ13C
experi-mentally found in the adductor muscle of Manila clams (3.5 ‰) was much higher than the average values of 0.8 ± 1.1 and 0.47 ± 1.23 ‰ given for whole body organisms by DeNiro & Epstein (1978) and Vander Zanden & Ras-mussen (2001), respectively. However, variations existed among species as δ13C trophic enrichment values ranged from –3 to
+ 3.5 ‰ (Post 2002). Yokoyama et al. (2005a) reported an experimentally determined trophic enrichment of 0.6 ‰ for δ13C in whole body of Ruditapes
philip-pinarum juveniles. Highly significant variations have
also been reported among tissues within species, and McCutchan et al. (2003) reported a higher trophic shift for consumers analysed as muscle (+1.3 ± 0.3 ‰) than for consumers analyzed whole (+ 0.3 ± 0.1 ‰). Tissue-specific differences in trophic enrichment are linked to biochemical compounds (DeNiro & Epstein 1978) and pathways by which compounds are metabolized in and/or routed to different tissues (Gannes et al. 1997). Lipids are depleted in 13C compared to carbohydrates
and proteins (DeNiro & Epstein 1978). Since lipid
con-Fig. 4. Ruditapes philippinarum. Spatial variation in nitrogen isotopic ratios (δ15N) of posterior adductor muscle of adult clams sampled at 50 stations in
Arcachon Bay in May–June 2006
Potential source δ13C δ15N
Mean ± SD n Mean ± SD n
Phytoplankton (outer bay) –20.96 ± 1.23 4 5.62 ± 1.39 5 Phytoplankton (inner bay) –20.60 ± 0.42 4 4.75 ± 0.33 11 POM Leyre –28.24 ± 0.10 2 5.24 ± 1 Microphytobenthos –16.81 ± 2.29 2 4.76 ± 0.55 2 Sedimentary organic matter –18.40 ± 0.26 7 3.94 ± 0.66 7
Zostera noltii leaves –11.77 ± 1.07 7 3.99 ± 1.18 7 Table 2. Carbon and nitrogen stable isotope ratios for primary producers and sediment in Arcachon Bay. δ15N analysis from Pothier & Savoye (unpubl. data).
tents are much lower in muscle tissues than in gonads and digestive glands of bivalves (Lorrain et al. 2002, Malet et al. 2007), muscles typically are enriched in 13C
relative to other lipid-rich organs.
To our knowledge, tissue-specific δ13C trophic
en-richment has never been estimated for marine bivalves, despite recent experimental studies by Yokoyama et al. (2005a), Paulet et al. (2006) and Dubois et al. (2007). Our experimental results are in accordance with Paulet et al. (2006) and field studies which analyzed tissue-specific trophodynamics in bivalves (Stephen-son & Lyon 1982, Lorrain et al. 2002, Malet et al. 2007). In these studies, differences in δ13C between adductor
muscles and digestive glands ranged from +1.8 to + 5.5 ‰, depending on the species and season. A simi-lar range (+1.4 to + 2.5 ‰) was reported by Page & Las-tra (2003) between adductor muscle and gut contents of Ruditapes decussatus. As δ13C in digestive glands
reflects the assimilated diet with a low trophic enrich-ment, dietary reconstruction from adductor muscle of bivalves should use new δ13C trophic enrichment
val-ues instead of the average valval-ues given in the litera-ture. However, new estimates are required for bivalves other than R. philippinarum. The weight-to-weight proportion of clam adductor muscles versus whole body was constant over the feeding experiment and averaged 15.8 ± 2.3% (authors’ unpubl. data, diet-switch experiment). Assuming that the weighted aver-age of the isotopic composition of all organs equals the isotopic composition of the whole body (see equation in Lorrain et al. 2002), the utilization of the trophic enrichment of 3.5 ‰ for carbon in muscle with a trophic enrichment of 0.5 ‰ for carbon in whole body Manila clams (Yokoyama et al. 2005a) would indicate a 0.1 to 0.3 ‰ trophic enrichment for carbon in all remaining
tissues. This mass-balance analysis suggests that a > 3 ‰ muscle-specific δ13C trophic enrichment may be
consistent with <1 ‰ δ13C trophic enrichment for whole
body in Manila clams.
In contrast to carbon, the trophic enrichment of 3 ‰ in δ15N from the diatom Skeletonema costatum to
Manila clam during the diet-switch experiment was in the range of the 3 to 4 ‰ given by Peterson & Fry (1987). This was consistent with the average values provided by Post (2002) (3.4 ± 1 ‰) and McCutchan et al. (2003) (2.9 ± 1.2 ‰) for muscle tissues of a large variety of consumers.
Spatial variation in δδ13C and δδ15N of Manila clams
Variation in carbon isotopic ratios of clam adductor muscles were lower than 4 ‰ and ranged from –23.7 to –19.9 ‰ for values corrected for trophic enrichment. Contrary to what could be expected from depleted δ13C Leyre River POM (Table 1) and the spatial extent
of its low salinity plume on most of the clam habitat during winter (Bouchet 1993), lack of significant corre-lation between δ13C clam muscle and distance to the
Leyre River suggested no or low contributions of river-ine materials to the diet of clams. Clam muscles, as slow growing tissues, should reflect the isotope compo-sition of food assimilated during their growth season, from April to July in Arcachon Bay (Robert et al. 1993). Since clams in the present study were sampled from mid-May to mid-June, and the half-time of δ13C was
estimated at ca. 1 mo, this suggests that clam muscles have integrated food variability for the end of winter. However, the period between early April and June was characterized by low Leyre River runoffs with
Fig. 5. Ruditapes philippinarum. N vs. C stable isotope ratios (mean ± SD) of posterior adduc-tor muscles of clams sampled at 50 stations (corrected for trophic shift; f) and trophic sources
potentially consumed as inner bay phytoplankton-dominated particulate organic matter (POM; f), outer bay phyto-plankton-dominated POM (j), Leyre POM (⏐×),
microphytoben-thos (m), sediment (d) and
Zos-tera noltii (
-
). The area enclosed by the dotted line corresponds to the expected δ13C and δ15N ofthe food resources incorporated by the Manila clam in its adduc-tor muscle, as deducted from trophic shifts of 3.5 and 3 ‰for
restricted spatial extension of the river plume and high pelagic primary production in the inner bay (Glé et al. 2008), explaining the spatial patterns in δ13C of clam
muscles. The hypothesis of selective feeding or selec-tive assimilation against riverine compounds cannot, however, be excluded because it is consistent with the conclusions of Kasai et al. (2004). They indicated that in Japanese coastal habitats, Ruditapes philippinarum consumed mainly marine POM despite the dominance of terrestrial material in the water column. Similar con-clusions were given for R. decussatus from the Ria For-mosa lagoon, Portugal (Machás et al. 2003), and Ria de Arosa (Page & Lastra 2003).
In contrast, small-scale variability was exemplified by the significant positive correlation between δ13C
values of clam muscle and tidal elevation. Two hypo-theses may explain this: (1) local variation in the contri-butions of benthic food sources, i.e. microphytoben-thos, SOM and associated bacteria, which may vary according to tidal elevation; and/or (2) higher contribu-tion of pelagic sources to the diet of clams located at low tidal levels, since pelagic sources were less 13
C-enriched than benthic sources (Table 1) (Kang et al. 1999, Kasai et al. 2004, Kanaya et al. 2005, Schaal et al. 2008). Both mechanisms can operate simultane-ously because resuspended bacteria may constitute a
Fig. 6. Ruditapes philippinarum. Predicted spatial variation in the proportion of trophic sources for adult clams within Arcachon Bay. Trophic sources considered are outer bay phytoplankton, inner bay phytoplankton, riverine particulate organic matter (POM; Leyre River), microphytobenthos, sedimentary organic matter and Zostera noltii. The black circle bound to each pie represents the
notable contribution to Ruditapes philippinarum diet in Zostera noltii meadows, despite a dominant contri-bution of phytoplankton (Kharlamenko et al. 2001).
δ15N values of muscle tissue from clams varied by
2.4 ‰ across the bay, exhibiting a south to north de-creasing trend with enriched 15N values in the
south-east, near the Leyre River mouth. A similar trend was reported between inner and outer parts of the Ria For-mosa lagoon for both muscles and digestive glands of
Mytilus galloprovincialis and Ruditapes decussatus
(Machás et al. 2003). In contrast, McKinney et al. (2001) found a significant correlation between δ15N in
Geukensia demissa mussels and nitrogen derived
from anthropogenic activities. As suspension-feeders, Manila clams incorporate diet components linked to primary production, which depend on nutrient inputs within coastal systems. Thus 2 hypotheses could ex-plain δ15N variations in relation to changes in δ15N of
nitrogen-loadings in Arcachon Bay: (1) inputs of heav-ier nitrogen by rivers and streams compared to oceanic waters and (2) spatial variability within the bay in the nitrogen recycling by microbial organisms in the water column and/or sediments.
First, rivers and streams running into Arcachon Bay are fuelled by different nitrogen sources, but relative proportions among atmospheric depositions, fertilizers and wastewaters depend on land use and manage-ment policies in the catchmanage-ment. Intensive agriculture occupies only 9% of the land-catchment surface but contributes 78% of the total nitrogen load entering the lagoon, mainly in the form of nitrates (De Wit et al. 2005, Deborde et al. 2008). To prevent eutrophication in the lagoon, all paper mill effluents and human wastewaters have been collected since the 1970s by a sewage collector which diverts treatment plant efflu-ents to the open ocean, 8 km south of the entrance to the lagoon (De Wit et al. 2005). This results in a negli-gible influence of wastewater inputs on the nitrogen-cycling within Arcachon Bay. The influence of fertiliz-ers appears low or spatially restricted to small stream inputs located in the northwestern bay since δ15N of
both Leyre River POM and inner bay phytoplankton (Table 1) are similar to those reported in other coastal systems (e.g. Kang et al. 1999, Machás et al. 2003, Page & Lastra 2003, Kasai et al. 2004).
Secondly, mineralization processes are intense in Arcachon Bay, reflected by the composition of inter-tidal flats, which consist of muddy sediments enriched in organic matter with pore water containing higher recycled nutrient concentrations (Deborde et al. 2008). These authors estimated that during one year, nutrient exports to the pelagic system by tidal pumping pro-vided about 5 times more ammonium inputs than the freshwater fluxes, which predominantly carried nitrates (De Wit et al. 2005, Deborde et al. 2008).
Ac-cording to Glé et al. (2008), seasonal and spatial varia-tion in pelagic primary producvaria-tion in Arcachon Bay is driven by the relative balance between nutrient levels. The highest pelagic primary production rates are ob-served in spring in the whole bay (outer and inner) fol-lowing winter nutrient inputs by freshwater runoffs. In contrast, mid-spring to fall primary production is much lower in the outer than the inner bay. During the period of nitrogen-limitation, inner bay production is sustained by ammonium pulses coming from benthic remineralisation. In this context, light δ15N values
re-corded during the present study in inner bay phyto-plankton during spring (Table 1) indicated the uptake of ammonium during a period of nitrate depletion (Cifuentes et al. 1988). At the whole bay scale, these processes are indeed constrained by tidal hydrody-namics and residence time of water masses (Glé et al. 2008) and they may contribute to the spatial variability observed in δ15N clam muscle through the
incorpora-tion of spatially distinct labelled δ15N phytoplankton.
Spatial variation in the dietary regime
The spring dietary regime of Ruditapes
philippi-narum in Arcachon Bay was dominated by
phyto-plankton with minor contributions of Zostera noltii and intermediate proportions of SOM. Dominance of phytoplankton in the dietary regime of Manila clams has been shown by other studies (Kharlamenko et al. 2001, Kasai et al. 2004, Kanaya et al. 2005, Yokoyama et al. 2005b). The present study, however, highlighted spatial variation in the dietary regime of R.
philip-pinarum within its 70 km2 distribution area in
Arca-chon Bay. Numerous stable isotope studies of coastal food webs have similarly suggested that spatial changes in trophic structure are common in hetero-geneous environments (Stephenson & Lyon 1982, Deegan & Garritt 1997, Cloern et al. 2002). Although variability in food resources was buffered by the time-integrated response of muscle tissues (Tieszen et al. 1983), spatial changes in stable isotope ratios of Manila clams in Arcachon Bay were much lower than those recorded in bivalves inhabiting the estuarine to ocean gradient (Riera & Richard 1996, Cloern et al. 2002, Page & Lastra 2003). The present study suggests major differences between the southern and northern parts of the bay in terms of diversity of trophic sources. The proportion of trophic sources gradually changed from almost entirely outer phytoplankton in the south along the Teychan Channel to a more diversified diet regime along the Piquey Channel (Fig. 1). This spatial pattern may be mainly explained by water mass circulation within the bay, as 60% of oceanic inputs entering the lagoon followed the Teychan Channel versus 15% for
the Piquey Channel (Plus et al. 2006). Both δ13C and
δ15N values of clams located in the south in the vicinity
of the Leyre River mouth indicate a major contribution of outer bay phytoplankton during periods of low Leyre River discharge. The network of channels reduces marine inputs to the northern bay, resulting in decreased outer bay phytoplankton availability, and clams thus have to diversify their trophic sources to guarantee their metabolic requirements. Higher con-tributions of inner bay phytoplankton, riverine POM, microphytobenthos, SOM and Z. noltii in the food regime of clams located in the northern bay were also consistent with longer residence times of water masses (Plus et al. 2006), higher numbers of riverine diffuse sources (De Wit et al. 2005) and larger Zostera noltii meadow surfaces (Auby & Labourg 1996) compared to the southern bay. This is in agreement with numerous studies (e.g. Deegan & Garritt 1997) which have sug-gested that benthic primary consumers rely on locally produced food sources in estuarine food webs.
Acknowledgements. We are particularly grateful to P. Lebleu
and F. Prince for their assistance in the field; K. Charlier and I. Billy for technical assistance with the elemental analyzer; H. Palvadeau, M. Noury and J. Wienebett for assistance during feeding experiments; G. Paulliac, G. Lamaison and L. Bourasseau for chl a analysis; Y. Descatoire for graphic work; and A. Pothier for unpublished data on stable isotope analy-ses. C.D. was supported by a grant from Fonds Commun de Coopération Aquitaine-Euskadi and Conseil Général de la Gironde. This study was supported by the Programme National d’Environnement Côtier (PNEC), ‘Chantier Littoral Atlantique’, the Institut Français pour la Recherche et l’Ex-ploitation de la MER (IFREMER) and the Centre National de la Recherche Scientifique (CNRS).
LITERATURE CITED
Auby I, Labourg PJ (1996) Seasonal dynamics of Zostera noltii Hornem. in the Bay of Arcachon (France). J Sea Res 35: 269–277
Baud JP, Bacher C (1990) Use of saline ground water for intensive rearing of Ruditapes philippinarum juveniles in a nursery system. Aquaculture 88:157–178
Blanchet H, de Montaudouin X, Lucas A, Chardy P (2004) Heterogeneity of macrozoobenthic assemblages within a
Zostera noltii seagrass bed: diversity, abundance, biomass
and structuring factors. Estuar Coast Shelf Sci 61:111–123 Bouchet JM (1993) Stratifications, fronts halins dans une lagune mésotidale (Bassin d'Arcachon – France). In: Sorbe JC, Jouanneau JM (eds) 3eColl Int d'Oceanogr Golfe de
Gascogne. Station Marine d'Arcachon, Arcachon, p 33–39 Caill-Milly N, Duclercq B, Morandeau G (2006) Campagne d’évaluation du stock de palourdes du bassin d’Arcachon. Rapp IFREMER, Anglet, p 1–51
Cifuentes LA, Sharp JH, Fogel ML (1988) Stable carbon and nitrogen isotope biogeochemistry in the Delaware estuary. Limnol Oceanogr 33:1102–1115
Cloern JE, Canuel EA, Harris D (2002) Stable carbon and nitrogen isotope composition of aquatic and terrestrial plants of the San Francisco Bay estuarine system. Limnol
Oceanogr 47:713–729
Dang C, de Montaudouin X, Gonzalez P, Mesmer-Dudons N, Caill-Milly N (2008) Brown muscle disease (BMD), an emergent pathology affecting Manila clam Ruditapes
philippinarum in Arcachon Bay (SW France). Dis Aquat
Org 80:219–228
De Wit R, Leibreich J, Vernier F, Delmas F and others (2005) Relationship between land-use in the agro-forestry system of les Landes, nitrogen loading to and risk of macro-algal blooming in the Bassin d’Arcachon coastal lagoon (SW France). Estuar Coast Shelf Sci 62:453–465
Deborde J, Anschutz P, Auby I, Glé C and others (2008) Role of tidal pumping on nutrient cycling in a temperate lagoon (Arcachon Bay, France). Mar Chem 109:98–114
Deegan LA, Garritt RH (1997) Evidence for spatial variability in estuarine food webs. Mar Ecol Prog Ser 147:31–47 DeNiro MJ, Epstein S (1978) Influence of diet on the
distribu-tion of carbon isotopes in animals. Geochim Cosmochim Acta 42:495–506
DeNiro MJ, Epstein S (1981) Influence of diet on the distribu-tion of nitrogen isotopes in animals. Geochim Cosmochim Acta 45:341–351
Dubois S, Blin JL, Bouchaud B, Lefebvre S (2007) Isotope trophic-step fractionation of suspension-feeding species: implications for food partitioning in coastal ecosystems. J Exp Mar Biol Ecol 351:121–128
Flassch JP, Leborgne Y (1992) Introduction in Europe, from 1972 to 1980, of the Japanese Manila clam (Tapes
philip-pinarum) and the effects on aquaculture production and
natural settlement. ICES Mar Sci Symp 194:92–96 Gannes LZ, O’Brien DM, Martínez del Rio C (1997) Stable
iso-topes in animal ecology: assumptions, caveats, and a call for more laboratory experiments. Ecology 78:1271–1276 Glé C, Del Amo Y, Sautour B, Laborde P, Chardy P (2008)
Variability of nutrients and phytoplankton primary pro-duction in a shallow macrotidal coastal ecosystem (Arca-chon Bay, France). Estuar Coast Shelf Sci 76:642–656 Gosling E (2004) Bivalve molluscs: biology, ecology and
cul-ture. Fishing News Books, Blackwell, Oxford
Kanaya G, Nobata E, Toya T, Kikuchi E (2005) Effects of dif-ferent feeding habits of three bivalve species on sediment characteristics and benthic diatom abundance. Mar Ecol Prog Ser 299:67–78
Kang CK, Sauriau PG, Richard P, Blanchard GF (1999) Food sources of the infaunal suspension-feeding bivalve
Ceras-toderma edule in a muddy sandflat of Marennes-Oléron
Bay, as determined by analyses of carbon and nitrogen stable isotopes. Mar Ecol Prog Ser 187:147–158
Kasai A, Horie H, Sakamoto W (2004) Selection food sources by Ruditapes philippinarum and Mactra veneriformis (Bivalva: Mollusca) determined from stable isotope analy-sis. Fish Sci 70:11–20
Kennedy P, Kennedy H, Papadimitriou S (2005) The effect of acidification on the determination of organic carbon, total nitrogen and their stable isotopic composition in algae and marine sediment. Rapid Commun Mass Spectrom 19: 1063–1068
Kharlamenko VI, Kiyashko SI, Imbs AB, Vyshkvartzev DI (2001) Identification of food sources of invertebrates from the seagrass Zostera marina community using carbon and sulfur stable isotope ratio and fatty acid analyses. Mar Ecol Prog Ser 220:103–117
Langton RW, Winter JE, Roels OA (1977) The effect of ration size on the growth and growth efficiency of the bivalve mollusc Tapes japonica. Aquaculture 12:283–292 Lorrain A, Paulet YM, Chauvaud L, Savoye N, Donval A,
Saout C (2002) Differential δ13C and δ15N signatures among
➤
➤➤
➤
➤
➤
➤
➤
➤
➤
➤
➤
➤
➤
➤
➤
➤
➤
➤
➤
scallop tissues: implications for ecology and physiology. J Exp Mar Biol Ecol 275:47–61
Lorrain A, Savoye N, Chauvaud L, Paulet YM, Naulet N (2003) Decarbonation and preservation method for the analysis of organic C and N contents and stable isotope ratios of low-carbonated suspended particulate material. Anal Chim Acta 491:125–133
Machás R, Santos R, Peterson B (2003) Tracing the flow of organic matter from primary producers to filter feeders in Ria Formosa Lagoon, southern Portugal. Estuaries 26: 846–856
Malet N, Sauriau PG, Faury N, Soletchnik P, Guillou G (2007) Effect of seasonal variation in trophic conditions and the gametogenic cycle on δ13C and δ15N levels of diploid and
triploid Pacific oysters Crassostrea gigas. Mar Ecol Prog Ser 346:203–217
Mann R (1979) The effect of temperature on growth, physiol-ogy, and gametogenesis in the Manila clam Tapes
philip-pinarum. J Exp Mar Biol Ecol 38:121–133
McCutchan JHJ, Lewis WMJ, Kendall C, McGrath CC (2003) Variation in trophic shift for stable isotope ratios of carbon, nitrogen, and sulfur. Oikos 102:378–390
McKinney RA, Nelson WG, Charpentier MA, Wigand C (2001) Ribbed mussel nitrogen isotope signatures reflect nitrogen sources in coastal salt marshes. Ecol Appl 11: 203–214 Page HM, Lastra M (2003) Diet of intertidal bivalves in the Ría
de Arosa (NW Spain): evidence from stable C and N iso-tope analysis. Mar Biol 143:519–532
Paulet YM, Lorrain A, Richard J, Pouvreau S (2006) Experi-mental shift in diet δ13C: a potential tool for
ecophysiolog-ical studies in marine bivalves. Org Geochem 37:1359–1370 Peterson BJ, Fry B (1987) Stable isotopes in ecosystem
stud-ies. Annu Rev Ecol Syst 18:293–320
Phillips DL, Gregg JW (2003) Source partitioning using stable isotopes: coping with too many sources. Oecologia 136: 261–269
Phillips DL, Newsome SD, Gregg JW (2005) Combining sources in stable isotope mixing models: alternative meth-ods. Oecologia 144:520–527
Plus M, Maurer D, Stanisière JY, Dumas F (2006) Carac-térisation des composants hydrodynamiques d’une lagune mésotidale, le bassin d’Arcachon. Rapp IFREMER Arca-chon, R.INT.DIR/LAB/SERV AN, p 1–58
Post DM (2002) Using stable isotopes to estimate trophic
posi-tion: models, methods, and assumptions. Ecology 83: 703–718
Riera P, Richard P (1996) Isotopic determination of food sources of Crassostrea gigas along a trophic gradient in the estuarine bay of Marenne-Oléron. Estuar Coast Shelf Sci 42:347–360
Robert R, Trut G, Laborde JL (1993) Growth, reproduction and gross biochemical composition of the Manila clam
Ruditapes philippinarum in the Bay of Arcachon, France.
Mar Biol 116:291–299
Sauriau PG, Haure J, Baud JP (1997) Sprinkling: a new method of distributing live algae food in marine coastal ponds used for Manila clam Tapes philippinarum (Adams & Reeve) intensive culture. Aquac Res 28: 661–669 Schaal G, Riera P, Leroux C (2008) Trophic coupling between
two adjacent benthic food webs within a man-made inter-tidal area: a stable isotopes evidence. Estuar Coast Shelf Sci 77:523–534
Sokal RR, Rohlf FJ (1981) Biometry. WH Freeman, New York Stephenson RL, Lyon GL (1982) Carbon-13 depletion in an estuarine bivalve: detection of marine and terrestrial food sources. Oecologia 55:110–113
Tieszen LL, Boutton TW, Tesdahl KG, Slade NA (1983) Frac-tionation and turnover of stable carbon isotopes in animal tissues: implication for δ13C analysis of diet. Oecologia 57:
32–37
Vander Zanden MJ, Rasmussen JB (2001) Variation in δ15N
and δ13C trophic fractionation: implications for aquatic
food web studies. Limnol Oceanogr 46:2061–2066 Vanderklift MA, Ponsard S (2003) Sources of variation in
con-sumer-diet δ15N enrichment: a meta-analysis. Oecologia
136:169–182
Yentsch CS, Menzel DW (1963) A method for the determina-tion of phytoplankton chlorophyll and pheophytin by flurorescence. Deep-Sea Res 10:221–231
Yokoyama H, Tamaki A, Harada K, Shimoda K, Koyama K, Ishihi Y (2005a) Variability of diet-tissue isotopic fraction-ation in estuarine macrobenthos. Mar Ecol Prog Ser 296: 115–128
Yokoyama H, Tamaki A, Koyama K, Ishihi Y, Shimoda K, Harada K (2005b) Isotopic evidence for phytoplankton as a major food source for macrobenthos on an intertidal sandflat in Ariake Sound, Japan. Mar Ecol Prog Ser 304: 101–116
Editorial responsibility: Katherine Richardson, Copenhagen, Denmark
Submitted: November 6, 2008; Accepted: May 11, 2009 Proofs received from author(s): July 7, 2009